Towards a Model of Information Aesthetics in Information Visualization pdf
Bạn đang xem bản rút gọn của tài liệu. Xem và tải ngay bản đầy đủ của tài liệu tại đây (502.37 KB, 6 trang )
1
Towards a Model of Information Aesthetics in Information Visualization
Andrea Lau and Andrew Vande Moere
Key Centre of Design Computing & Cognition, University of Sydney, Australia
{andrea; andrew}@arch.usyd.edu.au
Abstract
This paper proposes a model of information aesthetics
in the context of information visualization. It addresses the
need to acknowledge a recently emerging number of
visualization projects that combine information
visualization techniques with principles of creative design.
The proposed model contributes to a better understanding
of information aesthetics as a potentially independent
research field within visualization that specifically focuses
on the experience of aesthetics, dataset interpretation and
interaction. The proposed model is based on analysing
existing visualization techniques by their interpretative
intent and data mapping inspiration. It reveals
information aesthetics as the conceptual link between
information visualization and visualization art, and
includes the fields of social and ambient visualization.
This model is unique in its focus on aesthetics as the
artistic influence on the technical implementation and
intended purpose of a visualization technique, rather than
subjective aesthetic judgments of the visualization
outcome. This research provides a framework for
understanding aesthetics in visualization, and allows for
new design guidelines and reviewing criteria.
Keywords information aesthetics, information
visualization, aesthetics, visualization art.
1. Introduction
Information visualization has recently emerged as an
independent research field which aims to amplify
cognition by developing effective visual metaphors for
mapping abstract data [1]. The design of such effective
data representations are generally supported by insights
from visual cognition and perception research [2], as well
as taxonomies which match data types to the most
effective mapping technique [3, 4]. Some researchers have
suggested that information visualization may be further
augmented by engaging in an interdisciplinary discourse
with design and art communities, or vice versa, and have
proposed that artistic expression can be effectively
supported by better understanding existing information
visualization techniques [5-7]. Driven by a parallel stream
of independent designers and artists, an increasing number
of such visualization art (or data art) works have emerged
that aim to express the subjective experience of our
information society by artistically motivated but data-
driven visual forms [8].
However, such works have not yet been readily
acknowledged in either the art or visualization community.
While information visualization predominantly focuses on
effectiveness and functional considerations, it may be
neglecting the potentially positive influence of aesthetics
on task-oriented measures. Conversely, the reflection of
artistic intent in visualization art often disregards
functionality, making some works unintentionally
incomprehensible. We propose that information aesthetics
bridges this apparent gap between functional and artistic
intent by focusing on aesthetics as an independent medium
that augments information value and task functionality.
Aesthetics has been identified as one of the key
problems yet to be solved in current information
visualization research [9]. Accordingly, this paper
proposes a conceptual model of information aesthetics in
an aim to better understand its core characteristics, as well
as its commonalities and differences with the fields of
information visualization and visualization art. By better
appreciating its intentions and employed techniques, this
research aims to describe how data can be represented in
insightful and appealing ways.
2. Background
2.1. Aesthetics & Information Aesthetics
Aesthetics has already been discussed as a key factor
in several subfields of information visualization. This is
reflected in ambient visualization – informative displays
communicating information in the periphery of attention –
which explicitly recommends aesthetics as a method to
ensure displays remain unobtrusive in the physical settings
in which they are placed [10]. Metrics for aesthetics have
also been defined in the field of graph drawing, in terms
of readability, such as minimising the number of edge
crossings or maximising symmetry [11]. In the context of
industrial design, the scientific discipline of engineering
aesthetics proposes more rigorous empirical methods for
evaluating aesthetics. It aims to systematically identify
how people’s multiple senses work together to form
aesthetic judgements to assess the potential success of
products in the marketplace [12]. Research in aesthetics is
also a focus in the fields of affective computing [13] and
user experience research [14, 15], which aim to develop
computational interfaces that react to or provoke human
emotions.
2
In this research, ‘aesthetics’ is used to refer to the
degree of artistic influence on the visualization technique
and the amount of interpretative engagement which it
facilitates. This is in contrast with ‘aesthetics’ as the visual
appeal and quality of visual artefacts, which largely
depends on human subjective judgment. To the best of our
knowledge, the term ‘information aesthetics’ was first
used by Bense (cited [16]) to refer to a quantitative
measure of aesthetics according to the information content
of an image’s constituent parts. More recently, Manovich
[8] used the term ‘info-aesthetics’ to refer to an emerging
theoretical concept which reflects digital society through
digital interfaces. This paper uses ‘information aesthetics’
in the context of visualization only, while ‘information
aesthetic visualization’ refers to visualization techniques
demonstrating both artistic and informative value.
2.2. Towards Information Aesthetics
The following factors have facilitated the recent
growth and importance of information visualization, & in
particular, information aesthetics, in popular culture.
Software Availability. A number of applications have
recently emerged that specialise in the production of
complex visual artefacts. Designed for creative
individuals, the intuitive visual programming interfaces
employed
1
have resulted in a process of programming
which resembles sketching. This allows designers to
realise their ideas in a direct and iterative way, using high-
level technical sophistication without requiring a full
understanding of complex configuration issues. Some
applications are supported by a growing online community
who encourage creativity and sharing.
Dataset Availability. The Internet has made the
individual creation, collection and sharing of data easier.
Next to personal content creation, the Freedom of
Information legislation has allowed the public to gain
access to previously unattainable government and
corporation data. Non-government-organisations have
started to collect and expose data as a means of provoking
and persuading opinions in relevant cultural issues.
Several involuntary leaks have led to the exposure of
proprietary, sensitive data.
Internet Speed & Distribution. The capabilities
related to increasing Internet bandwidth have allowed data
to become more accessible. This availability is not limited
to raw datasets as new interfaces have been created that
allow interactive access to large sets of information.
Online software ‘mash-ups’ are becoming more common,
bringing together distributed data sources into common,
highly interactive interfaces.
Interdisciplinary Skills. Design students, from digital
media to architecture, are increasingly exposed to cross-
disciplinary knowledge such as programming and interface
techniques, supplementing creative design experience with
state-of-the-art computer science skills. An emerging
group of visualization designers wish to cross boundaries
1
For example: Max/MSP (cycling74.com), Virtools (virtools.com), VVVV
(vvvv.org), Processing (processing.org).
between fields, by inventing, designing and prototyping
novel techniques.
Evolving Aesthetics. Evolving forms of aesthetics are
emerging, especially driven and appreciated by online
media, exploiting visual appeal to entice users. New visual
forms are created as a result of designers attempting to
out-do each other, in a never-ending quest for the most
impressive design portfolios.
2.3. Models of Visualization
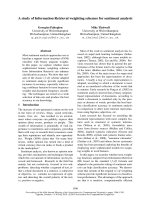
Figure 1 illustrates a simple conceptual model of the
collaboration between visualization researchers and artists
[6]. The linear spectrum shows how techniques which are
highly data-accurate often limit an artist’s creative input,
whilst those created with full artistic freedom are often
less representative. It is suggested that rather than
collaborating at either extreme, artists and researchers
should work closely together to develop novel techniques.
Similarly, examples of museum technology demonstrate
the ability for interfaces to act as ‘art’ to be appreciated
and as ‘tool’ with which to perform tasks [17]. These
issues are related to information aesthetics in its aim to
convey both informative and aesthetic value.
Figure 1. Data versus artistic freedom [6].
Several theoretical visualization models exist. The
Periodic Table of Visualization Methods [18] organises
one hundred visualization techniques based on context,
purpose, and type of representation, allowing creators to
combine appropriate techniques based on their
requirements. Other models classify visualization
techniques according to underlying interdisciplinary
factors, such as the relationship between a user’s
expectations and a visualization designer’s mapping
assumptions [19]. The user expectations may match the
designer’s assumptions, so that the data mapping is clear.
In other cases, the mapping technique may be more
arbitrary and determined by context and data. Data is thus
an inefficient determining factor for classifying
techniques. Another visualization model classifies
representations through an empirical assessment of
perceived similarity in features, such as attractiveness and
understandability [20]. The groups of representations
inform creators by examining the limitations and strengths
of each factor. Other task- and problem-oriented models
classify techniques in terms of user goals and intended
functionality [21, 22].
These models are extended in this research. It
considers visualization as an artefact which is to be
interpreted, rather than a means to facilitate tasks or
represent a certain dataset. The model aims to facilitate an
understanding of information aesthetics from the
perspective of information visualization and visualization
art, in its intentions and used techniques.
3
3. Model of Information Aesthetics
3.1. Domain Model
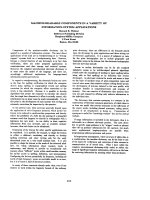
The unique characteristics of information aesthetics
and its relationships with related fields are mapped in
Figure 2. Each field is defined according to three factors:
data, aesthetics, and interaction. Information
visualization, for instance, is located on the bottom edge,
as it focuses on representing data using interactive
methods with little concern for aesthetics.
Figure 2. Domain model for information aesthetics.
The model shows information aesthetics’ focus on the
three issues of: representing abstract data, providing an
interactive interface, and using visual appeal to engage the
user. Extending the two visualization-related sides of the
model, information aesthetics adopts more interactive
methods than visualization art and places more emphasis
on visual style and experience than information
visualization. In this way, it is proposed that information
aesthetic visualization employs techniques from, and is
directly related to, both information visualization and
visualization art. In its aim to realise the collective purpose
of these two fields, an expanded model is required to
describe its influencing factors.
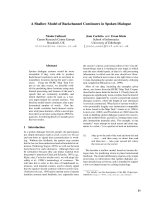
3.2. Information Aesthetics Model
The proposed model of information aesthetics is
defined by two characteristics which highlight the
relationship between what a visualization facilitates and
the means by which it achieves this. In other words,
information aesthetics is analysed from an information
visualization perspective, in terms of functionality and
effectiveness, and from visualization art, in terms of
artistic influence and meaningfulness. Two factors define
the model: data focus and mapping technique (Figure 3).
Mapping technique is determined through observations
made in terms of what methods of representation have
been used to map the data into visual form. Data focus is
determined by observing how the visualisation facilitates
knowledge acquisition. This model is based on objective
observations rather than an examination of creators’
intentions, as we have found that textual descriptions of a
visualization’s intentions do not always match the final
outcomes, as its purpose is not always fully realised.
Figure 3. Mapping technique and data focus.
Forty-seven existing applications which visually
represent abstract data have been analysed and were
placed on a model (see Figure 4), after which the resulting
configuration was considered. One should note that the
respective data focus and mapping technique of these
techniques are mapped to the model proportionally. That
is, the extremes represent a complete focus on the factor,
whilst techniques possessing characteristics of both ends
of the extreme are located in the centre.
Figure 4. Model of information aesthetics.
3.2.1. Mapping Technique: Direct vs Interpretive.
Mapping technique is a concept which describes the
methods employed by a visualization creator to represent
an abstract dataset. It is the process of translating data
values to a visual representation. The focus on direct
mapping is generally driven by standards learnt from
visual cognition research, including Gestalt rules and
perception psychology [2], and guidelines which
determine which representations are most ideal depending
on data type [4]. The use of more systematic mapping
techniques is prevalent in visualization which focuses on
direct representations. However, this model does not
define direct mapping as a one-to-one correlation between
data and representation as created by a computational
algorithm. Rather, visualization techniques which employ
direct mapping are inversible. That is, a user is able to
infer underlying data values from the visual representation.
4
On the other hand, mappings which involve subjective
decisions and stylistic influences are highly interpretive.
The visualization design may be stylised, adopted from
cross-disciplinary inspirations. Such more subjective
mapping techniques can be characterised in their inability
to be inversed. That is, users perceiving the visualization
have more difficulty in comprehending underlying data
values or patterns.
3.2.3. Data Focus: Intrinsic vs Extrinsic. Data focus is a
concept which defines a visualization’s ability to facilitate
the communication of information, and the type of
information disseminated. Here, data focus is considered
as a reflection of what the visualization allows users to
accomplish rather than what the creator intended for the
visualization to achieve. Visualization techniques with
intrinsic data focus aim to facilitate insight into data by
employing cognitively effective visual mapping. This
intrinsic focus can be seen as synonymous with functional
‘tools’ [17] which aim to support user tasks and
disseminate information. These techniques allow users to
discover useful patterns in data, such as outliers, trends,
and clusters.
In contrast, those with extrinsic data focus facilitate the
communication of meaning that is related to or underlies
the dataset. These extrinsically-focused techniques are
aimed towards visualization which are able to be
appreciated and interpreted, and to invoke personal
reflection. The creation of ‘art’ [17] is often synonymous
with a focus on extrinsic data meaning. Such visualization
techniques allow high-level goals to be fulfilled, such as
understanding underlying meaning in the context of social
and cultural issues.
3.2.3. Other Factors. The following factors have not been
explicitly mapped to the proposed model, but are relevant
in their analysis of existing techniques.
Interaction allows the user to explore the dataset by
dynamically manipulating the mapping metaphor, through
actions such as filtering or zooming. The ability to
aggregate, summarise, and cluster the data allows users to
gain a better understanding of the patterns hidden inside
dataset. The predefined choice of what to represent and
how to represent thus determines how users build up
different perspectives to test their assumptions. In general,
information visualization techniques with an intrinsic
focus thus contain interactive features. Those techniques
which aim for extrinsic meaning often explicitly limit
interactivity, ensuring the communication of the creator’s
predefined perspective rather than fundamentally
unpredictable user interpretations of the data.
Platforms utilised in the creation of visualization often
reflect the data and mapping focus. In general, those which
emphasise data patterns and direct mapping are task-
oriented, and therefore utilise familiar, generic user
interface elements and interaction metaphors. In contrast,
information aesthetic techniques tend to be developed
using designer-targeted software, such as Processing and
Macromedia Flash, affording greater creative and stylistic
flexibility in mapping and interaction. Visualization art is
often created using alternative media, providing creators
with the creative freedom to explore highly interpretive
mappings and communicate multiple, potentially
ambiguous meanings.
Dataset Attributes such as size, data type and time-
dependency vary widely, and have not been included in
the proposed model. Similarly, the degree of data
aggregation in the resulting visualization has not been
correlated. However, the model demonstrates how the
nature of the dataset often determines an information
aesthetic approach. For instance, techniques with an
extrinsic focus often represent datasets that can be
understood by non-experts, such as social data, and
datasets which are reflective of the state of society, such as
news headlines or speeches. Such techniques often provide
insights into underlying meanings that are related to the
dataset, proposing new perspectives on culture and society
as a whole instead of highlighting or explaining data
patterns or tendencies.
4. Model Analysis
The proposed model demonstrates that mapping
technique and data focus are qualitatively correlated, i.e.
the choice of mapping technique generally determines the
resulting data focus (and vice versa). That is, visualization
techniques that are based on direct mapping often focus on
intrinsic patterns, whilst interpretive mapping highlights
extrinsic data meaning. Closer analysis shows these two
extremes can be identified as the fields of information
visualization and visualization art, respectively, although a
wide spectrum of other visualization techniques fall
between them (see Figure 5). We propose that it is this
field that can be identified as ‘information aesthetics’,
which includes the subfields of social visualization,
ambient visualization and informative art.
Figure 5. Categories within the model of information
aesthetics.
5
4.1. Information Visualization
Information visualization mapping techniques draw
from visual cognition research in order to maximise the
effectiveness and efficiency of the user’s ability to detect
data patterns [2, 4]. However, techniques which target
non-expert or general users tend to employ more
interpretive mapping. Visual appeal is treated as a means
of attracting and maintaining user engagement so that the
visualization – often a commercial tool – increases in
popularity. On the other hand, there are some techniques
which place a slightly greater focus extrinsic meaning.
These techniques are often specific to a dataset and while
remaining highly effective, provide the interactivity and
flexibility which enables higher-level interpretation.
4.2. Visualization Art
Visualization art techniques often tend to employ
ambiguous and interpretive mapping methods in order to
facilitate the expression of some underlying message
extrinsic to the data, by engaging the user and provoking
personal reflection [23]. Their data mappings are also
often highly arbitrary or subjective, and not linked to
effective visual perception guidelines as in information
visualization. Instead, visualization art focuses on novel
techniques for mapping data, or appropriating existing
methods, but mostly with the aim to provoke open
interpretation, facilitating the expression of meaning
underlying the data rather than the presentation of patterns.
Some visualization art techniques employ novel data
metaphors in order to elicit curiosity and personal
engagement. Other techniques
re-contextualise existing
data mapping methods taken from information
visualization to question its ‘scientific’ credibility and
power to sway human opinions and attitudes.
4.3. Information Aesthetic Visualization
Information aesthetic visualization techniques facilitate
both intrinsic insight into patterns and extrinsic meaning
underlying the data. Its mapping techniques are generally
direct and accurate, similar to those in information
visualization, but stylistic and artistic, as in visualization
art. This means that information aesthetic works can
exploit typical visualization techniques for alternative
purposes than they were intended for. While such
approaches might map data directly, it is not the primary
intent of the works to augment understanding of the
dataset. Its outcome might closely resemble typical
information visualization techniques, in an effort to
increase the credibility of the resulting visual artefact, or to
allow users to investigate message-enforcing data patterns.
However, by including aesthetic aspects, it reaches beyond
simple data pattern detection, often conveying a more
subjective, deeper meaning about what the data, and
therefore the visualization itself, represents.
Ambient Visualization & Informative Art aim to
inform viewers of data patterns through visually engaging
displays. Although such approaches are often inspired by
art [10], they are limited to conveying only meaning
embedded within the dataset itself. By obscuring data
mappings behind aesthetic means they intend to entice
interest over longer periods of time, but do not focus on
the conceptual perspective to reach beyond communicate
patterns within data.
Social Visualization employs direct mapping
techniques augmented by artistic styles, to engage, and
promote exploration and interpretation. Users interacting
with social visualizations tend to interpret intrinsic data
patterns as a reflection of their personality and history.
While their technique might be inspired by information
visualization, their intent towards extrinsic concepts
resembles that of art.
4.4. Implications
Information visualization, information aesthetics, and
visualization art form a continuum between direct
mapping with intrinsic focus, and interpretive mapping
with extrinsic focus. Although the model reveals a
relationship between mapping technique and data focus,
one should note that the two factors do not always
correlate exclusively with each other. For instance, fields
which do not fall directly in the continuum include social
visualization, informative art, and ambient visualization.
These are distinct fields that are nevertheless part of and
most probably formed the foundation for the information
aesthetic movement.
This model shows that information aesthetics reaches
beyond the combination of information visualization and
visualization art. It is based on both intrinsic and extrinsic
data meaning, and the use of artistically-enhanced but
effective mapping techniques. Thus, aesthetics, considers
the context in which the data should be interpreted, rather
than the subjective judgment. Often, information aesthetic
works use visualization techniques to convey patterns, but
leaving their interpretation open to the user. Aesthetics is
then used as a means of appealing to users that may have
never considered visualization before, in order to attract
attention, encourage personal involvement, and allow for
more profound, long-term impressions.
The proposed model can be used by visualization
designers from different fields to ascertain which
technique is best for a particular visualization purpose. For
instance, a visualization aimed at communicating the
effects of global climate change (i.e. extrinsic focus) may
adopt highly interpretive mapping techniques with little
concern for the effective representation of the complex
data involved, thereby demonstrating the power of
visualization for mostly propaganda purposes. However,
the misuse of such approaches may endanger the
trustworthiness of the visualization field as a whole, but at
the same time demonstrates new potential avenues in
visualization research. By considering cross-disciplinary
influences, information visualization can allow for high-
level interpretations of ever-more complex datasets.
6
5. Discussion & Conclusion
This paper has identified information aesthetics as a
visualization field which closely merges aspects of
aesthetics, data and interaction. Accordingly, the proposed
model investigated the influence of data focus and
mapping technique on a large collection of existing
abstract visualization techniques. Information aesthetics
forms a cross-disciplinary link between information
visualization and visualization art. It adopts more
interpretive mapping techniques to augment information
visualization with extrinsic meaning, or considers
functional aspects in visualization art to more effectively
convey meanings underlying datasets.
The model is unique in its focus on aesthetics as the
degree of artistic influence on the mapping technique of a
specific visualization, and the aesthetic engagement it
affords, as opposed to aesthetics as a measure of subjective
appeal. More specifically, our model analyses the intent
(i.e. meaning) of a specific technique, and the mechanics
(i.e. data mapping) that it uses to accomplish this. More
detailed user studies to assess the influence of these two
subjective qualities form future work.
This paper demonstrates how information aesthetics
can be interpreted beyond the simple notion of subjective
appeal, and that different degrees of information aesthetic
quality exist. The proposed model creates an opportunity
for a cross-disciplinary community of researchers and
artists to develop design guidelines and more accurate
reviewing criteria for information aesthetics, and provides
an initial framework for understanding aesthetics in
information visualization.
Acknowledgements
Due to space constraints, the visualization techniques
of the model as depicted in Figure 4 are referenced at
/>.
References
[1] S. Card, J. D. Mackinlay and B. Shneiderman. (1999).
Readings in Information Visualization: Using Vision to Think.
Morgan Kaufmann, Los Altos, CA.
[2] C. Ware. (2000). Information Visualization: Design for
Perception. Morgan Kaufmann Publishers, San Francisco.
[3] W. S. Cleveland and R. McGill. (1984). Graphical
Perception: Theory, Experimentation, and Application to the
Development of Graphical Methods. J. Am. Stat. Assc. 79(387):
531-554.
[4] J. Mackinlay. (1986). Automating the Design of Graphical
Presentations of Relational Information. ACM Trans. Graph.
5(2): 110-141.
[5] G. Judelman. (2004). Aesthetics and Inspiration for
Visualization Design: Bridging the Gap between Art and
Science. In International Conference on Information
Visualisation (IV), London, UK, IEEE Computer Society. pp.
245-250.
[6] D. F. Keefe, D. B. Karlitz, E. L. Vote and D. H. Laidlaw.
(2005). Artistic Collaboration in Designing VR Visualisations.
IEEE Comp. Graph. and Appl. 25(2): 18-23.
[7] A. Vande Moere. (2005). Form Follows Data: the Symbiosis
between Design & Information Visualization. In International
Conference on Computer-Aided Architectural Design
(CAADFutures), Vienna, Austria, Springer, Dordrecht. pp. 167-
176.
[8] L. Manovich. (2000). Info-aesthetics,
/>, accessed March 2004.
[9] C. Chen. (2005). Top 10 Unsolved Information Visualization
Problems. IEEE Comp. Graph. & Appl. 25(4): 12-16.
[10] J. Mankoff, A. K. Dey, G. Hsieh, J. Kientz, S. Lederer and
M. Ames. (2003). Heuristic Evaluation of Ambient Displays. In
CHI 2003, Ft. Lauderdale, Florida, USA, ACM Press. pp. 169-
176.
[11] H. C. Purchase. (2002). Metrics for Graph Drawing
Aesthetics. J. Vis. Lang. & Comp. 13(5): 501-516.
[12] Y. Liu. (2003). Engineering Aesthetics and Aesthetic
Ergonomics: Theoretical Foundations and a Dual-process
Research Methodology. Ergonomics. 46(13/14): 1273–1292.
[13] R. Picard. (1999). Affective Computing for HCI. In
International Conference on Human-Computer Interaction,
Munich, Germany, Lawrence Erlbaum Associates, Inc. pp. 829 -
833.
[14] B. Laurel. (1993). Computers as Theatre. Addison-Wesley,
Reading, Massachusetts.
[15] D. A. Norman. (1998). The Design of Everyday Things. MIT
Press, London.
[16] R. Scha and R. Bod. (1993). Computational Esthetics.
Informatie en Informatiebeleid. 11(1): 54-63.
[17] K. Boehner, P. Sengers, Y. Medynskiy and G. Gay. (2005).
Opening the Frame of the Art Museum: Technology Between Art
and Tool. In Digital Arts and Culture (DAC), Copenhagen,
Denmark, pp. 123-132.
[18] R. Lengler and M. J. Eppler. (2007). Towards A Periodic
Table of Visualization Methods for Management. In Proceedings
of Graphics and Visualization in Engineering (GVE 2007),
Clearwater, Florida, USA, ACTA Press. pp.
[19] M. Tory and T. Möller. (2004). Rethinking Visualization: A
High-Level Taxonomy. In Information Visualization (INFOVIS),
Austin, Texas, USA, IEEE Computer Society. pp. 151-158.
[20] G. L. Lohse, K. Biolsi, N. Walker and H. H. Rueter. (1994).
A Classification of Visual Representations. Commun. ACM.
37(12): 36-49.
[21] B. Shneiderman. (1996). The Eyes Have It: A Task by Data
Type Taxonomy for Information Visualization. In Symposium on
Visual Languages, Boulder, CO, USA, IEEE Computer Society.
pp. 336-343.
[22] S. Wehrend and C. Lewis. (1990). A Problem-Oriented
Classification of Visualization Techniques. In Visualization
(VIS), San Francisco, California, IEEE Computer Society. pp.
139-143.
[23] W. W. Gaver, J. Beaver and S. Benford. (2003). Ambiguity
as a Resource for Design. In Human Factors in Computing
Systems (CHI), Ft. Lauderdale, Florida, USA, ACM Press. pp.
233-240.