Báo cáo khoa học: The multifarious short-term regulation of ammonium assimilation of Escherichia coli: dissection using an in silico replica pdf
Bạn đang xem bản rút gọn của tài liệu. Xem và tải ngay bản đầy đủ của tài liệu tại đây (449.03 KB, 21 trang )
The multifarious short-term regulation of ammonium
assimilation of Escherichia coli: dissection using an
in silico replica
Frank J. Bruggeman
1
, Fred C. Boogerd
1
and Hans V. Westerhoff
1,2,3
1 Molecular Cell Physiology, Institute of Molecular Cell Biology, CRBCS, Vrije Universiteit, Amsterdam, the Netherlands
2 Mathematical Biochemistry, SILS, Universiteit van Amsterdam, the Netherlands
3 Stellenbosch Institute for Advanced Studies, Stellenbosch, South Africa
Many unicellular organisms exhibit enormous plasti-
city towards sudden changes in their physico-chemical
environment. Much of the adaptation capacity derives
from the ‘emergent’ properties of biochemical net-
works composed of signal-transduction, metabolic,
and gene-expression regulatory levels [1]. Most of the
Keywords
ammonium assimilation; systems biology;
glutamine synthetase; robustness; silicon
cell
Correspondence
H.V. Westerhoff, Molecular Cell Physiology,
Institute of Molecular Cell Biology, CRBCS,
Vrije Universiteit, de Boelelaan 1085,
NL-1081, HV Amsterdam, the Netherlands
Fax: +31 20 598 7229
Tel: +31 20 598 7230
E-mail:
Note
The mathematical model described here has
been submitted to the Online Cellular Sys-
tems Modelling Database and can be
accessed free of charge at http://jjj.
biochem.sun.ac.za/database/Bruggeman/
index.html
(Received 7 October 2004, revised 31 Janu-
ary 2005, accepted 23 February 2005)
doi:10.1111/j.1742-4658.2005.04626.x
Ammonium assimilation in Escherichia coli is regulated through multiple
mechanisms (metabolic, signal transduction leading to covalent modification,
transcription, and translation), which (in-)directly affect the activities of its
two ammonium-assimilating enzymes, i.e. glutamine synthetase (GS) and
glutamate dehydrogenase (GDH). Much is known about the kinetic proper-
ties of the components of the regulatory network that these enzymes are part
of, but the ways in which, and the extents to which the network leads to
subtle and quasi-intelligent regulation are unappreciated. To determine whe-
ther our present knowledge of the interactions between and the kinetic prop-
erties of the components of this network is complete ) to the extent that
when integrated in a kinetic model it suffices to calculate observed physiolo-
gical behaviour ) we now construct a kinetic model of this network, based
on all of the kinetic data on the components that is available in the literature.
We use this model to analyse regulation of ammonium assimilation at vari-
ous carbon statuses for cells that have adapted to low and high ammonium
concentrations. We show how a sudden increase in ammonium availability
brings about a rapid redirection of the ammonium assimilation flux from
GS ⁄ glutamate synthase (GOGAT) to GDH. The extent of redistribution
depends on the nitrogen and carbon status of the cell. We develop a method
to quantify the relative importance of the various regulators in the network.
We find the importance is shared among regulators. We confirm that the ade-
nylylation state of GS is the major regulator but that a total of 40% of the
regulation is mediated by ADP (22%), glutamate (10%), glutamine (7%) and
ATP (1%). The total steady-state ammonium assimilation flux is remarkably
robust against changes in the ammonium concentration, but the fluxes
through GS and GDH are completely nonrobust. Gene expression of
GOGAT above a threshold value makes expression of GS under ammonium-
limited conditions, and of GDH under glucose-limited conditions, sufficient
for ammonium assimilation.
Abbreviations
a-KG, a-ketoglutarate; ATase, adenylyltransferase; GDH, glutamate dehydrogenase; GOGAT, glutamate synthase; GS, glutamine synthetase;
NRI, response regulator of two-component signal transduction couple NRI ⁄ NRII; NRII, sensor of two-component signal transduction couple
NRI ⁄ NRII; UTase, uridylyltransferase.
FEBS Journal 272 (2005) 1965–1985 ª 2005 FEBS 1965
adaptation phenomena remain to be explained
mechanistically in terms of the network topology and
the kinetic properties of the molecular components of
the network. One possible approach to finding these
explanations is through calculation of the properties of
(parts of) such cellular networks from the experiment-
ally determined properties of the macromolecules
within them, for those cases where these properties are
known sufficiently (e.g. [2–5]). Such detailed kinetic
models of parts of living cells have been called ‘silicon
cells’ or ‘silicon replicas’ ([6], see also http://www.
siliconcell.net and ). Silicon cells
can be used: (a) to test whether the molecular-biologi-
cal knowledge can account for observed physiological
behaviour; (b) to analyse behaviour accounted for; and
(c) to predict behaviour not observed experimentally
(e.g. [2–4,7]). Here, we present a silicon cell for the
biochemistry underlying the metabolic regulation of
ammonium assimilation in Escherichia coli.
A classical example of a hierarchical regulatory net-
work is the glutamine synthetase (GS) adenylylation
cascade involved in the regulation of ammonium
assimilation of E. coli [8–13]. It is composed of two
ammonium-assimilatory routes: one through GS ⁄ glu-
tamate synthase (GOGAT) and one through GDH
(glutamate dehydrogenase). Both lead to the net reduc-
tive addition of ammonium to a-ketoglutarate (KG).
Whereas GDH accomplishes this in a single reaction,
the GS ⁄ GOGAT pathway constitutes two reactions
that additionally hydrolyse ATP. The affinity of GS
for ammonium (i.e. % 0.1 mm) is a factor of % 10
higher than the affinity of GDH for ammonium (i.e.
% 1mm) [14,15]. GS⁄ GOGAT is essential for growth
at low (< 1 mm) ammonium concentrations, when
GDH appears to be redundant. GDH might function
in ammonium assimilation when free energy limits
growth and sufficient ammonium is available [16,17].
Furthermore, GDH has been implicated in osmotoler-
ance and pH homeostasis [18].
While growing on glucose and ammonium, as sole
carbon and nitrogen source, respectively, the carbon
skeleton of both glutamate (GLU) and glutamine
(GLN) is derived from catabolism, i.e. from a-KG (a
tricarboxylic acid cycle intermediate), and the nitrogen
atom is obtained directly from incorporating ammo-
nium. Glutamine (the product of GS) and GLU (the
product of GDH and GOGAT) serve as precursors for
the synthesis of a diverse range of metabolites, i.e.
(almost all) amino acids, purine and pyrimidine
nucleotides, glucosamine-6-phosphate, and NAD
+
[11]. This central role of GLU and GLN at the inter-
section of catabolism and anabolism in E. coli led
physiologists and enzymologists to perform detailed
studies on the regulation of the regulatory network
connected to ammonium assimilation (reviewed in
[11–13]). This network proved to harbour a stunning
complexity, comprising at least five different regulatory
mechanisms dedicated to the regulation of ammonium
assimilation through direct effects on the activity of
and amount of GS. One mechanism resides in the dif-
ference in affinity of GS and GDH for ammonium,
rendering GDH more important at high ammonium
concentrations [15,19]. A second mechanism operates
through the cumulative feedback control of GS by
various end products of the GLN- and GLU-demand
pathways [20]. The third mechanism involves the aden-
ylyltransferase (ATase) catalysed inactivation of GS
through a progressive adenylylation of its 12 subunits
[21]. The net rates of (de) adenylylation depend on: (a)
the concentration of GLN [22]; and (b) the uridylyla-
tion state and the a-KG-binding state of the trimeric
proteins PII [23] and GlnK [24,25]. The latter two pro-
teins act as substrates for the ambiguous enzyme uri-
dylyltransferase (UTase) that can (de) uridylylate all
three subunits of PII [26] and also those of GlnK
[24,25]. GlnK has recently been shown to be important
under conditions of nitrogen starvation whereas PII is
functional at higher concentrations of ammonium [27].
All activities of UTase ⁄ UR are sensitive to the GLN
concentration. Additionally, PII can bind one a-KG
molecule per subunit each having different effects on
the signalling role of PII. The fourth mechanism
involves the transcriptional stimulation of the glnALG
operon, which codes for GS, NRII, and NRI, by the
doubly phosphorylated dimeric response-regulator
NRI. The dimeric protein NRII acts as the cognate
sensor of the two-component regulatory system NRI-
NRII. When it binds PII complexed with one molecule
of a-KG, NRII catalyses the dephosphorylation of
phosphorylated NRI [12,28]. The fifth mechanism is by
regulation of the concentration of GS through protein
turnover (reviewed in [11]).
The network as a whole has been postulated to integ-
rate and decide upon information concerning the phy-
siological carbon and nitrogen status through its
sensitivities for ammonium, a-KG, and GLN [12,22,29].
A silicon cell that includes all known kinetic properties
of the macromolecules involved in the five regulatory
mechanisms might prove to be the only way to under-
stand such complex regulation. Provided that the kin-
etic properties of the molecules are represented correctly
in the replica, the latter should behave in the same way
as the real pathway. With this challenge in mind, we
now construct a silicon cell version of the regulation
of the GS adenylylation cascade, based exclusively on
what is known about the molecular constituents, i.e. on
Multifarious regulation dissected F. J. Bruggeman et al.
1966 FEBS Journal 272 (2005) 1965–1985 ª 2005 FEBS
all the kinetic data. We then analyse the effects of chan-
ges in the ammonium level and in the carbon status
(a-KG) on the transient and short-time steady-state
properties of the ammonium-assimilation flux by the
network. When considering such relatively short time
scales, regulation through gene expression can be
assumed to be negligible (e.g. [30]). allowing one only to
consider metabolic regulatory processes. We devise and
apply a method that determines the relative importance
of the various regulators during transient regulation of
the rate of GS. Finally, we alter gene expression of
GDH, GOGAT, and GS and calculate the effects on
the ammonium assimilation flux. We observe that the
regulatory network gives rise to a number of regulatory
phenomena that are not present in the constituent indi-
vidual molecules, yet may exemplify much of the basis
for the quasi-intelligent response of the living cell to
changes in its environment.
The mathematical model described here has been sub-
mitted to the Online Cellular Systems Modelling Data-
base and can be accessed at />database/Bruggeman/index.html free of charge.
Results
The ammonium assimilation network in silico:
biochemical and physiological aspects
The silicon cell version of the ammonium assimilation
network in E. coli was constructed from existing litera-
ture data on the kinetic and physicochemical properties
of its components (Experimental procedures). The inter-
action network is shown in Fig. 1. The model incorpor-
ates the kinetic data known for the central proteins
(GS, GOGAT, GDH, ATase, UTase, PII). The kinetic
parameter values derive from in vitro measurements in
cell-free extracts or with purified proteins, except for
the kinetic parameters of ATase. The latter parameters
were obtained from fitting them to adenylylation states
of GS as function of GLN and a-KG levels in a recon-
stituted system containing only ATase, UTase, PII and
GS (with constant concentrations of a-KG and GLN)
(Experimental procedures). We emphasize that we did
not fit to systemic behaviour as a whole: all behaviour
we calculate here results from the properties of the com-
ponents rather than from a fit. Also the physiological
boundary conditions, e.g. moiety conserved totals, were
obtained from the literature. The silicon cell employed
simple modular kinetics for the reactions outside the
ammonium assimilation pathway itself, such as amino
acid synthesis of amino acids derived from GLU and
GLN. A detailed description of the kinetic model can
be found in the Supplementary material.
The three gln regulatory genes are expressed constitu-
tively at a low level [13], suggesting that the intracellular
concentrations of PII, UTase and ATase are independ-
ent of nitrogen status. Accordingly, the amount of the
regulatory protein PII and the activities of UTase, and
ATase were fixed at levels normally encountered in wild
type E. coli cells. The expression levels of the genes
glnA, gltBD, and gdhA, encoding GS, GOGAT, and
GDH, respectively, do depend on the physiological state
of E. coli (e.g. [31]). Time-dependent gene expression
was not taken into account: the replica was meant to
reconstruct the short-term metabolic regulation only.
Furthermore, the kinetics of the anabolic modules were
chosen such that: (a) the net ammonium assimilation
fluxes (J
N
¼ 25–41 m mÆ min
)1
) were consistent with
intermediate specific growth rates of E. coli (0.3–
0.5 h
)1
); and (b) the flux via the GLU demand route
was approximately eight times higher than the flux via
the GLN demand route [32]. The maximal rates for GS,
GOGAT, and GDH used in the calculations below were
determined with wild type E. coli growing at a specific
growth rate of 0.3 h
)1
in an ammonium-limited or a
glucose-limited chemostat (Table 1).
The ammonium assimilation network in silico –
partial validation
No comprehensive physiological studies of the ammo-
nium assimilation network under controlled conditions
that could serve as a full validation of the model could
be found in the literature. Therefore, we choose to
compare the in silico behaviour of the wild type and
mutants (obtained by removing the corresponding
reactions) to the reported physiology of the corres-
ponding real wild type and mutant strains. Unfortu-
nately, the type of physiological experiments carried
out to determine the physiology of mutants is semi-
quantitative at best. In the cases used in this section
none of them included measurements of the maximal
rates at the used physiological conditions. This means
that the physiological behaviour of the mutants in vivo
and in silico can be compared in a qualitative sense
only. The steady states of the in silico wild type and
mutants were calculated for four different ‘physiologi-
cal’ conditions, i.e. at a low (0.05 mm; Table 2) and at
a high (1.0 mm; Table 3) intracellular ammonium con-
centration, each for two a-KG concentrations (0.2 and
1.0 mm). These a-KG concentrations represent the low
and high end of the reported physiological range of
intracellular concentrations [31].
The following experimentally obtained physiological
data (a–d) are qualitatively consistent with the simula-
ted in silico data shown in Tables 2 and 3. (a) Under all
F. J. Bruggeman et al. Multifarious regulation dissected
FEBS Journal 272 (2005) 1965–1985 ª 2005 FEBS 1967
conditions, the calculated wild type steady-state GLN
concentration (0.6–1.0 mm) proved to be at least one
order of magnitude lower than the calculated GLU
concentration (4.0–21 mm). This reproduces the con-
centration ranges and the relationship that has been
observed frequently in vivo [31,33–35]. (b) As expected
for the wild type, at glucose limitation the in silico GS
was adenylylated to a higher degree than for the condi-
tions mimicking ammonium limitation. Accordingly,
ammonium assimilation ran predominantly via GS dur-
ing ammonium limitation whereas GDH dominated
during glucose limitation. The ammonium assimilation
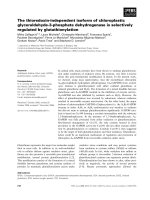
Fig. 1. Reaction scheme of the metabolic
ammonium-assimilation network in E. coli.
Subnetworks (UTase, ATase, metabolism),
defined such that there is no mass flux
between them, are enclosed in dashed
boxes. Metabolites are denoted in upper
case letters. Boundary metabolites (with
concentrations held constant) are denoted
by white letters in grey boxes. Dashed
arrows portray the regulatory interconnec-
tions between the subnetworks governed
by the communicating intermediates that
are displayed outside of the dashed boxes.
Full arrows represent the rates, which are
further characterized by v
j
’s (where j
denotes the enzyme abbreviation). Activa-
tors and inhibitors are depicted in bold and
plain format below or above the process
rates they regulate. ATPase stands for the
cellular free-energy pathways that re-phos-
phorylate ADP. The following abbreviations
were used: UT, uridylyl transfer; UR, uridylyl
removal; DEAD, deadenylylation; AD, ade-
nylylation; GS, glutamine synthetase; GDH,
glutamate dehydrogenase; GOGAT, gluta-
mate synthase; GLNDEM, glutamine
demand; GLUDEM, glutamate demand; NH,
ammonium; KG, a-KG; GLU, glutamate;
GLN, glutamine; MET
GLN
, metabolite
derived from glutamine; and MET
GLU
, meta-
bolite derived from glutamate.
Table 1. Measured maximal rates of GS, GOGAT and GDH deter-
mined for E. coli K12 growing at a dilution rate of 0.3 h
)1
in an
ammonium-limited and glucose-limited chemostat. All maximal
rates are in m
MÆmin
)1
.
Enzyme Ammonium limited Glucose limited
GS 600 110
a
GOGAT 85 55
GDH 360 205
a
Corrected experimental value (Experimental procedures).
Multifarious regulation dissected F. J. Bruggeman et al.
1968 FEBS Journal 272 (2005) 1965–1985 ª 2005 FEBS
fluxes are comparable under the two conditions (this
illustrates growth at comparable growth rates). (c)
Experimental cells lacking GOGAT show unimpaired
growth at high ammonium concentrations. Only under
nitrogen-limitation they grow more slowly [36]. The
in silico GOGAT mutant showed a similar behaviour;
its ammonium flux (J
N
) was clearly much lower than
that of the wild type at low ammonium concentrations,
irrespective of the a-KG level. At the higher ammo-
nium concentration the silicon GOGAT deletion cells
did assimilate ammonium at a substantial rate, again
consistent with the experimental result. (d) Mutants
lacking GDH have no obvious growth impairment
when both free energy and carbon are available in
excess [17,32]. In agreement with this experimental
observation, the silicon GDH deletion mutant sus-
tained a high ammonium-assimilation flux during
ammonium-limited growth. (e) Cells of Salmonella
typhimurium devoid of ATase and induced for GS
expression accumulate GLN to high levels under high
ammonium conditions, even after the initially depleted
GLU pool has been restored [37,38]. This is indeed cal-
culated for the in silico pathway for the case of glucose
limitation. (f) Experimental mutants lacking UTase
exhibit a high adenylylation state of GS independent of
the absence or presence of ammonium in the medium
[39,40]; they are not able to sense changes in the nitro-
gen status (they sense nitrogen all the time). Likewise,
GS was adenylylated to a substantial extent in the
in silico UTase mutant growing at two limitations.
An in silico PII mutant was not included, because the
interpretation of the phenotypes of experimental PII
mutants is confounded by the presence of the PII para-
logue, GlnK, in these mutants [41]. The in silico mutant
strain deficient in GS did engage in ammonium assimil-
ation but its GLN production flux was zero (Tables 2
and 3). In reality such a mutation is indeed lethal due to
the fact that GS is the sole enzyme capable of producing
GLN.
Steady-state response to changes in ammonium
concentration
The effects of the external nitrogen and internal carbon
and nitrogen status on the metabolic regulation of
the ammonium assimilation flux were investigated. The
Table 2. Calculated steady-state in silico physiology of wild type and of mutant E. coli strains in the presence of 0.05 mM ammonium
(ammonium-limited chemostat) and 0.2 (A) or 1.0 (B) m
M a-KG. The values for the maximal rates were 360 mMÆmin
)1
(GDH), 600 mMÆmin
)1
(GS), and 85 mMÆmin
)1
(GOGAT).
Genotype
GLN
(m
M)
GLU
(mM)
n
AMP
(AMPÆGS
)1
)
J
GS
(mMÆmin
)1
)
J
GDH
(mMÆmin
)1
)
J
N
(mMÆmin
)1
)
ABABABA B ABA B
Wild type 0.6 0.9 4.0 5.3 1.2 1.5 30 30 2.8 6.5 33 37
GS
–
0.0 0.0 0.3 0.6 0.0 0.0 0.0 0.0 3.7 7.3 3.7 7.3
GOGAT
–
0.1 0.4 0.1 0.2 0.0 0.0 2.7 5.2 3.8 7.4 7.0 13
GDH
–
0.6 0.8 3.5 3.9 0.7 0.4 31 34 0.0 0.0 31 34
Atase
–
1.5 2.5 4.3 5.3 0.0 0.0 36 37 2.6 6.4 39 43
Utase
–a
0.0 0.0 0.6 1.3 7.0 9.1 4.5 6.0 3.6 7.2 8.1 13
a
Initial conditions: PII ¼ 0.003 mM, PIIUMP
i
¼ 0.000 mM (i ¼ 1,2,3).
Table 3. Calculated steady-state in silico physiology of wild type and of mutant E. coli strains in the presence of 1.0 mM ammonium (glu-
cose-limited chemostat) and 0.2 (A) or 1.0 (B) m
M a-KG. The values for the maximal rates where 205 mMÆmin
)1
(GDH), 110 mMÆmin
)1
(GS),
and 55 m
MÆmin
)1
(GOGAT).
Genotype
GLN
(m
M)
GLU
(mM)
n
AMP
(AMP GS
)1
)
J
GS
(mM min
)1
)
J
GDH
(mMÆmin
)1
)
J
N
(mMÆmin
)1
)
ABABABABABAB
Wild type 0.6 1.0 6.0 21 2.1 7 18 12 17 31 35 43
GS
–
0.0 0.0 3.6 27 0.0 0.0 0.0 0.0 19 28 19 28
GOGAT
–
0.6 1.0 1.9 14 5.2 10 6.3 8.0 21 34 27 42
GDH
–
0.0 0.0 0.1 0.2 0.0 0.0 2.1 3.0 0.0 0.0 2.1 3.0
ATase
–
2.1 14 5.7 14 0.0 0.0 26 25 17 34 43 59
UTase
–a
0.0 0.1 4.1 24 11 11 3.3 3.1 19 29 22 32
a
Initial conditions: PII ¼ 0.003 mM, PIIUMP
i
¼ 0.000 mM (i ¼ 1,2,3).
F. J. Bruggeman et al. Multifarious regulation dissected
FEBS Journal 272 (2005) 1965–1985 ª 2005 FEBS 1969
external nitrogen and the internal carbon and nitrogen
status were taken to be reflected by the ammonium,
a-KG, and the GLN concentration, respectively. Meta-
bolic steady states were computed at internal ammo-
nium concentrations ranging from 0.01 to 1 mm, while
the a-KG concentration was either set to 0.2 or to
1.0 mm. The calculations were performed for cells that
had expression levels of GS, GDH, and GOGAT that
mimicked long exposure to ammonium limitation, i.e.
identical conditions to those in Table 2. All calculations
involved metabolic steady states that had been reached
within minutes after cells ) incubated for generations at
ammonium limitation (i.e. 0.05 mm ammonium) ) had
been shifted to the ammonium concentration indicated
on the abscissa of Fig. 2. The computed steady states
thus reflect metabolic states reached before enzyme syn-
thesis or degradation could have had any effect. The
range of a-KG concentrations was again chosen to
mimic the physiological concentrations range [31].
The steady-state relationship between the overall
ammonium-assimilation flux (J
N
) and the ammonium
concentration for two different a-KG concentrations is
shown in Fig. 2A,B. Irrespective of the a-KG concentra-
tions, J
N
increased sharply with the ammonium concen-
tration as long as the latter stayed below % 0.03 mm.
Above this ammonium concentration the dependence of
the ammonium assimilation flux on the ammonium con-
centration changed drastically: the ammonium assimil-
ation flux increased only slightly with a further increase
in ammonium concentration. Below the threshold, the
metabolic regulation appeared to fail, in view of the
sharp drop in J
N
with even a minor decrease in ammo-
nium. Our calculations suggest that the expression of
the ammonium transporter AmtB may be necessary to
sustain ammonium assimilation at ammonium concen-
trations below this threshold.
To investigate which regulatory mechanism acting on
GS has the highest effect on the dependency of the
ammonium assimilation flux on the ammonium concen-
tration we removed three such mechanisms. The ammo-
nium assimilation flux in the insets of Fig. 2A,B
corresponds to the three different models in which the
direct regulation of GS is ‘mutated’ by removal of the
terms from the rate equation of GS that correspond to:
(a) thermodynamic regulation; (b) kinetic regulation;
and (c) both thermodynamic and kinetic regulation.
Removal of thermodynamic regulation corresponds to
neglecting the inhibitory effect of the backward reac-
tion of GS on the rate of biosynthetic ammonium
assimilotion (by deleting the term [ADP][GLN][Pi] ⁄
K
eq,GS
from Eqn 19a). The kinetic effect was removed
by abolishing both the effect of adenylylation on the
maximal rate of GS (the J
GS
term on Eqn 19a and b
was set to 1) and by eliminating the product inhibition
terms, e.g. ADP ⁄ K
ADP
. To enable a fair comparison,
the maximal rate of GS in the ‘mutated’ models was
corrected such that the net ammonium assimilation flux
(J
N
) of the mutated and the original model was identi-
cal at 0.05 mm of ammonium (i.e. 32 and 37 mmÆmin
)1
,
respectively, at 0.2 and 1.0 mm a-KG). Clearly, both
insets indicate that the effect of the removal of both
regulatory mechanisms (but not of either alone) on the
ammonium assimilation flux was drastic, i.e. at 1.0 mm
a-KG, J
N
now increased from 47 at 0.02 mm ammo-
nium to 160 mmÆmin
)1
at 1.0 mm (The value for the J
N
at 1.0 mm ammonium in the case for removal of the
kinetic and thermodynamic regulation was 69 and
47 mmÆmin
)1
, respectively.)
Ammonium assimilation is thought to be associated
with high activities of GS and GOGAT at low concen-
trations of ammonium (< 1 mm) and no activity of
GDH, whereas GDH is presumed to carry the flux
exclusively at higher concentrations of ammonium [11].
This has been postulated to be favourable because of
the additional hydrolysis of one ATP per molecule of
ammonium assimilated if the GS⁄ GOGAT pathway is
used [17]. To investigate whether the shift from GS ⁄
GOGAT to GDH should actually be expected on the
basis of known kinetics and of metabolic regulation
alone, the relative contributions of GS and GDH to the
net ammonium assimilation flux were calculated as a
function of the ammonium concentration, again for the
two different concentrations of a-KG (Fig. 2C,D).
Contrary to the expectations, GDH was calculated to
be active at low ammonium concentrations. Even at the
ammonium level that maximally supported GS activity
(0.03 mm), GDH activity contributed 12% to the
ammonium assimilation flux (at 1.0 mm a-KG). The
relative contribution of GS increased strongly with
increasing ammonium concentrations before it went
through a maximum of 88% at 0.03 mm ammonium.
Hereafter, the contribution of GS decreased, quickly at
first and then slowly, to settle to a plateau value of 20%
(for 1.0 mm a-KG) for ammonium in excess of 1 mm
(data not shown). The heights of both the peak in the
dependence of the variation of the relative contribution
of the two enzymes on the ammonium concentration
and, to a lesser extent, the minimum plateaus, decreased
with an increase in the a-KG concentration. Remark-
ably, Fig. 2C shows that, at a low a-KG concentration,
even at an ammonium concentration exceeding 1 mm,
GS contributed significantly to the overall ammonium
assimilation (43% at 1.0 mm NH
4
+
and 0.2 mm KG).
The strict paradigm of ammonium assimilation flux
through GS at low and through GDH at high ammo-
nium concentrations should perhaps be replaced by the
Multifarious regulation dissected F. J. Bruggeman et al.
1970 FEBS Journal 272 (2005) 1965–1985 ª 2005 FEBS
Fig. 2. Calculated, steady-state characteristics of the ammonium assimilation network as function of the ammonium concentration at two
a-KG concentrations, i.e. 0.2 (A, C, E, G), and 1.0 (B, D, F, H) m
M; AB, overall ammonium assimilation flux (J
N
); CD, flux ratio of GS and GDH
(J
GS
⁄ J
GDH
); EF, apparent maximal rate of GS (V
APP
GS
) and the adenylylation state of glutamine synthetase (n
AMP
); GH, the concentration of PII
with one a-KG attached to it (PIIKG
1
), of PII saturated with both UMP and KG (PIIUMP
3
KG
3
), and of glutamine (GLN). The numbered lines in
the insets of (A) and (B) correspond to the removal of thermodynamic regulation (1), kinetic regulation (2), and both (3). In order to guarantee
identical ammonium assimilation fluxes of the original and the mutated model at 0.05 m
M ammonium, the fluxes in the insets were calculated
with the following values for the maximal rates of GS (in m
M min
)1
), 555 (1, inset A), 160 (2, inset A), 160 (3, inset A), 550 (1, inset B), 140
(2, inset B), 140 (3, inset B).
F. J. Bruggeman et al. Multifarious regulation dissected
FEBS Journal 272 (2005) 1965–1985 ª 2005 FEBS 1971
subtler picture emerging from what we calculated here
on the basis of the properties of the participating
enzymes. The general perception that all ammonium
assimilation at high ammonium concentrations follows
the energetically cheaper route along GDH, is not sup-
ported by the known kinetic properties of the pathway.
Indeed it is well known that microorganisms are not
generally efficient free-energy transducers [42].
The contribution of GS to the nitrogen assimilation
flux was smaller at the high a-KG concentration (24%
at 1.0 mm NH
4
+
). This indicates that GS may not
only play a role at low external ammonium conditions
but also at low internal carbon conditions. Indeed, not
only does the enzyme couple GS ⁄ GOGAT have a
higher affinity for ammonium than GDH, it also has a
higher affinity for a-KG, i.e. the K
M
values of GDH
and GOGAT for a-KG are 0.3 mm and 7 lm, respect-
ively. Apparently, GS ⁄ GOGAT not only senses the
internal nitrogen status (GLN) but, additionally, the
internal carbon status.
The concentrations of GLN and PIIKG
1
(the form of
the signalling protein PII that binds to the sensor NRII
activating the phosphatase activity of the latter towards
NRIP) increased steadily with the ammonium concen-
tration above 0.03 mm. The extent of the increase in the
concentration of PIIKG
1
depended on the a-KG con-
centration (Fig. 2G,H). At 1.0 mm ammonium and
1.0 mm a-KG, its concentration amounted to % 22 nm,
which represented 0.7% of the total amount of PII pre-
sent (3 lm). An increased concentration of PIIKG
1
implies an increased rate of NRII-PIIKG
1
-catalysed
dephosphorylation of NRIP and hence a decrease in the
expression level of GS. The physiological concentration
of NRII (assuming it is comparable to the concentra-
tion of NRI) is between 1 and 2 nm for cells grown in
the presence of excess ammonium and it may rise to
>60 nm in cells grown at low nitrogen conditions
[42a]. Therefore, especially at high concentrations of
a-KG, where the contribution of GS to J
N
was relat-
ively low (Fig. 2D), gene expression of GS may be down
regulated by PIIKG
1
. The concentration of the other
regulatory PII intermediate, i.e. PIIUMP
3
KG
3
,
decreased with increasing ammonium concentrations,
but increased with increasing a-KG concentrations.
These two species reflect the decrease in the overall
uridylylation state of PII as a function of increasing
ammonium concentration (data not shown).
Transient response to a sudden increase
in ammonium availability
Schutt and Holzer [43] measured a rapid decrease in
the apparent maximal rate of GS (its maximal rate
corrected for its adenylylation state) upon a sudden
increase in the ammonium concentration to cells that
had been adapted to growth on proline, i.e. to the vir-
tual absence of ammonium. They stopped short of
determining the actual composite rates of ammonium
assimilation and of confirming that the system shifted
between rates as effectively as often hypothesized.
Inspired by this work, we subjected the silicon net-
work, adapted to ammonium limitation as reflected in
the values of the maximal rates of GS, GDH and GO-
GAT and at the reference steady state used previously
(i.e. an ammonium concentration of 0.05 mm), to a
sudden increase in the ammonium concentration to
1.0 mm. To investigate the effect of the carbon status
we performed the calculations at constant concen-
trations of both 0.2 and 1.0 mm of a-KG (Fig. 3).
At low concentrations of ammonium and a-KG,
in silico ammonium assimilation ran predominantly via
GS ⁄ GOGAT (Figs 3A and 2C). Upon the 20-fold
increase in the ammonium concentration at time zero,
the rate of GS (and GDH) initially increased rapidly,
as expected from the increase in the concentration of
one of their substrates. After a few seconds the rates
began to decrease. Eventually the (steady-state) GS
rate dropped to a level lower than before the addition
of the ammonium, in spite of the 20-fold increased
concentration of one of its substrates. Figure 3C illus-
trates that the decrease in the rate of GS correlated
with a decline in its apparent maximal rate (to % 10%
of its preshift value). This in turn correlated with the
(rapid) adenylylation of nearly all subunits of GS
(from 1.2 to 11 AMP ⁄ GS) within 3 min. Within a min-
ute after the ammonium shift, the GLN concentration
increased rapidly to finally settle down to a higher
steady state than before the ammonium change
(Fig. 3E). The progressive adenylylation of GS resulted
from two effects both caused by the rapid increase of
the GLN concentration. Firstly, GLN itself may have
directly stimulated the ATase-catalysed adenylylation
reaction. Secondly, GLN interacts with UTase and
may hereby have increased the level of PIIKG
1
and
decreased the level of PIIUMP
3
KG
3
(Fig. 3E), giving
rise to both a further stimulation of the ATase-cata-
lysed adenylylation reaction and a release of the stimu-
lation of the ATase-catalysed deadenylylation reaction.
Effects of mutations on the transient response
of the network
To obtain a more detailed picture of the contribution of
the different proteins involved in the regulation of the
shift from GS- to GDH-dominated ammonium assimil-
ation upon an increase in the ammonium concentration,
Multifarious regulation dissected F. J. Bruggeman et al.
1972 FEBS Journal 272 (2005) 1965–1985 ª 2005 FEBS
we removed ATase, UTase, and PII from the model.
We performed these in silico experiments at an a-KG
concentration of 1.0 mm, i.e. the conditions where the
shift was most appreciable (Supplementary Figs S1–
S3). These ‘deletions’ took place at the moment of the
addition of ammonium to make sure that the initial
conditions at the moment of the addition were similar
to those in Fig. 3B. This illustrates the potential power
of silicon cells; here we calculate the outcome of an
experiment not achievable in the laboratory. The
removal of ATase caused an accumulation of GLN (to
67 mm within 5 min after the pulse) (Supplementary
Fig. S1). Most importantly, in this simulated absence of
the regulation through ATase, GS contributed 44% to
the ammonium assimilation rate 5 mins after the addi-
tion of ammonium. Similarly, in order to investigate the
role of UTase in regulating the maximal rate of ATase
we removed UTase from the model (Supplementary
Fig. 3. Calculated transient response to a sudden increase in the ammonium concentration from 0.05 to 1.0 mM at time zero. The a -KG con-
centration was 0.2 m
M (panels A, C, and E), or 1.0 mM (panels B, D and F) continuously. A, B: rates of glutamine synthetase (vGS), glutam-
ate synthase (vGOGAT) and glutamate dehydrogenase (vGDH). C, D: adenylylation state of glutamine synthetase (nAMP) and the ‘apparent’
maximal rate of glutamine synthetase (V
APP
GS
). E, F: concentrations of glutamine (GLN), PII with one a-KG attached to it (PIIKG
1
), and PII
saturated with UMP and a-KG (PIIUMP
3
KG
3
).
F. J. Bruggeman et al. Multifarious regulation dissected
FEBS Journal 272 (2005) 1965–1985 ª 2005 FEBS 1973
Fig. S2). Removal of UTase led to (relative to the wild
type): (a) an increased steady-state concentration of
GLN; (b) a similar adenylylation state and apparent
maximal rate of GS; and (c) comparable rate changes in
GS, GOGAT and GDH. Apparently, GLN can take
over the regulatory role of PIIKG
1
and PIIUMP
3
KG
3
after the pulse. (Of course, removal of UTase is likely
to have important effects on the regulation of ammo-
nium assimilation due to its second regulatory role, i.e.
hierarchical regulation of the activity of the two-compo-
nent signalling network NRI ⁄ NRII through its directs
effect on the concentration of PIIKG
1
, but gene expres-
sion regulation is not considered here).
Do these results hint at PII being redundant for
metabolic ammonium assimilation: can GLN substi-
tute for PII? This we investigated by removing PII
from the model at the moment the 1 mm ammonium
was added (Supplementary Fig. S3). PII turned out to
be of major importance; its removal led to an accumu-
lation of GLN and to total deadenylylation of GS
(causing its apparent maximal rate to rise to its max-
imal value of 600 mmÆmin
)1
). As in the case of the
removal of ATase, PII removal interfered with the
shift from GS ⁄ GOGAT- to GDH-dominated ammo-
nium assimilation. This may have been due to the
synergistic effect of PIIKG
1
, PIIUMP
3
KG
3
and GLN
on the rate of ATase (Eqns 15b and 16b).
These results indicate that the interplay between
GS ⁄ GOGAT and GDH critically depends on the sig-
nalling cascade composed of both ATase and PII,
UTase being perhaps more important as a hierarchical
regulatory mediator. Additionally, the calculated
results of PII removal indicated that ATase alone may
be insufficient for regulating the level of ammonium
assimilation upon an ammonium pulse.
Analysis of regulation of the transient response
of the GS rate
The decrease in the rate of GS upon the sudden addition
of ammonium at time zero (Fig. 3A,B) is a result of the
regulatory network as a whole. For, in the metabolic
subnetwork alone, the rate of GS should have increased
upon the addition of ammonium (as exemplified by the
results obtained in silico after the removal of ATase
(Supplementary Fig. S1). The change in the rate of GS
could be caused by the changes in: its state of covalent
modification (n
AMP
), and the concentrations of sub-
strates (GLU; ATP) and products (GLN; ADP). There
was no method available yet however, to analyse the
relative importance of these various regulatory routes.
These regulatory influences could well depend on time,
making such an analysis even more complicated.
To test whether the adenylylation of GS is indeed
the most important regulatory event to downregulate
the flux of GS upon a rise in the ammonium level, we
set out to develop an in silico method that should
enable us to quantify the relative strengths of parallel
regulatory pathways as a function of time. To this aim
we wrote the fractional change in the rate of GS at
time t as follows:
dlnv
GS
dt
ðtÞ¼
X
5
i¼1
@lnv
GS
@lnX
i
ðtÞÁ
dlnX
i
dt
ðtÞ¼
X
5
i¼1
H
v
GS
X
i
ðtÞð1Þ
where the sum was taken over the regulatory contri-
butions of all five regulators (denoted by X
i
). The
regulator with the highest regulatory contribution
(H
v
GS
X
i
for the regulatory contribution of X
i
on the
rate of GS) at time t has the highest contribution to
the change in the rate of GS at that moment in time.
After integrating over the entire steady-state relaxa-
tion time, one then obtains for the average regulatory
contribution of X
i
ð
H
v
GS
X
i
Þ:
1
t
Z
t
0
d ln v
GS
dt
ðsÞ ds
¼
X
5
i¼1
1
t
Z
t
0
@ ln v
GS
@ ln X
i
ðsÞÁ
d ln X
i
dt
ðsÞ ds ¼
X
5
i¼1
H
v
GS
Xi
ð2Þ
Similarly, the average absolute regulatory contribution
of a regulator X
i
to transient regulation of v
GS
over a
time span 0 to t should be given by
H
v
GS
X
i
¼
1
t
Z
t
0
H
v
GS
X
i
ðsÞ
ds ð3Þ
In Supplementary Fig. S4 the regulatory contributions
of the five regulators are displayed for the changes in
the rate of GS that were shown in Fig. 3. Supplement-
ary Fig. S4 indicates that initially (seconds) ADP,
ATP, GLN, GLU, and n
AMP
(in decreasing order of
importance) were important regulators, after that (sec-
onds to minute) GLU and n
AMP
, and at a later stage
(minutes) n
AMP
was most important. The integrated
regulator contributions can be found in Table 4. In the
average regulatory contribution up- and downregula-
tion are included: negative and positive effects are just
summed up over time. A more interesting variable is
therefore the average absolute regulatory contribution:
here negative effects are integrated, turned into posit-
ive values and summed up with positive effects. It is
noteworthy that the average regulatory contributions
of ATP and ADP have the same sign, even though they
are an activator and an inhibitor of GS, respectively.
This is explained by the definition of the regulatory
Multifarious regulation dissected F. J. Bruggeman et al.
1974 FEBS Journal 272 (2005) 1965–1985 ª 2005 FEBS
contribution and the fact that the sum of ATP and
ADP remains constant. For the time-averaged absolute
regulation, the contribution of the adenylylation to the
regulation of GS proved most important. The import-
ance of the regulatory contributions (on basis of their
magnitude) in decreasing order is n
AMP
, ADP, GLU,
GLN, and ATP. The magnitudes of the regulatory
contributions depended on the a-KG concentration
but their order of importance turned out to be inde-
pendent of the carbon status.
Steady-state analysis of ammonium assimilation
flux as function of the enzyme expression levels
So far, the calculations were performed for fixed
expression levels of GDH, GOGAT and GS, levels that
corresponded to E. coli growing at a rate of 0.3 h
)1
in
either an ammonium-limited or a glucose-limited
chemostat. The proteins constituting the regulatory
cascade (UTase, PII, ATase) are constitutively
expressed at a low level [44]. The levels of expression of
the assimilatory proteins GS and GDH may vary
considerably whereas that of GOGAT changes to a
smaller extent [31]. It is shown (Supplementary Fig. S5)
that if GOGAT is expressed above a threshold activity
level of approximately 60 mmÆmin
)1
expression of GS
at a low level of ammonium and a-KG (respectively,
0.05 and 0.2 mm) is sufficient to guarantee a high
ammonium-assimilation flux. We calculated the impli-
cations for the ammonium assimilation flux of the
above mentioned expression response of E. coli
by changing the maximal rate of GS (range, 50–800
mmÆmin
)1
) and GDH (range: 50–500 mmÆmin
)1
) with
GOGAT fixed at either 85 mmÆmin
)1
(Fig. 4A: ammo-
nium-limited chemostat) or 55 mmÆmin
)1
(Fig. 4B: glu-
cose-limited chemostat).
Figure 4A indicates that gene expression of GS is
necessary for a high ammonium assimilation flux during
ammonium-limited growth. The effects of expression of
GDH on ammonium assimilation are negligible. (It
makes the dependence of J
N
on V
GS
slightly less sigmoi-
dal and the V
GS
value at which J
N
achieves its half-
maximal value shifts slightly to lower V
GS
values.) At
parameter values mimicking glucose-limited growth the
effects of the expression of GS and GDH are only
evident at low values for V
GS
and V
GDH
.
Table 4. Average regulatory and average absolute regulatory contri-
butions of the regulators of the rate of GS from 0 to 5 min after
the pulse at 0.2 m
M and 1.0 mM a-KG.
Average
regulatory
contribution KG (m
M)
Average
absolute
regulatory
contribution KG (mM)
0.2 1.0 0.2 1.0
H
v
GS
GLN
)0.019 )0.032
H
v
GS
GLN
0.079 0.077
H
v
GS
GLU
0.11 0.14
H
v
GS
GLU
0.12 0.14
H
v
GS
ATP
0.0020 0.0026
H
v
GS
ATP
0.016 0.017
H
v
GS
ADP
0.048 0.068
H
v
GS
ADP
0.26 0.26
H
v
GS
n
AMP
)0.45 )0.56
H
v
GS
n
AMP
0.69 0.61
A
B
Fig. 4. Calculated ammonium-assimilation flux (J
N
) as a function
of the maximal rates of GDH and GS. Conditions: (A) V
GOG
¼
85 m
MÆmin
)1
,NH¼ 0.05 mM, and KG ¼ 0.2 mM and B. V
GOG
¼
55 m
MÆmin
)1
,NH
4
+
¼ 1.0 mM, and KG ¼ 1.0 mM, respectively,
mimicking ammonium-limited and glucose-limited chemostat. The
dots in the figures resemble the conditions of the models used in
the text [J
N
value was taken from A: Table 2 (3rd row, 12th
column), and B: Table 3 (3rd row, 13th column)].
F. J. Bruggeman et al. Multifarious regulation dissected
FEBS Journal 272 (2005) 1965–1985 ª 2005 FEBS 1975
Discussion
The approach taken here started from the contempor-
ary knowledge on the interactions between the compo-
nents and their kinetic properties as documented in the
literature. All the kinetic parameters were taken as
such, with one exception; the kinetic parameters of
ATase had to be obtained via a fitting procedure.
Importantly, this was done only at the level of a recon-
stituted subnetwork, i.e. not at the entire system level.
Consequently, any system behaviour that arose in the
subsequent calculations of the entire network resulted
from the properties of and the interactions between its
components. This type of models aims at in silico rep-
lica of biochemical systems. This method of biochemi-
cal calculations has been successful in a number of
cases [2–4,7] (cf. ).
Unfortunately, no studies could be found in the
literature that contained sufficiently large data sets con-
taining transient or steady-state measurements of the
ammonium assimilation network suitable to truly valid-
ate the model. Therefore, we aimed at partial valid-
ation. The kinetic model was demonstrated to exhibit
realistic behaviour as witnessed by the good qualitative
match between calculated and known physiological fea-
tures of wild type and mutant strains of E. coli (Tables 2
and 3 and associated text). Despite the scarcity of
physiological data, the model allows for an insight into
the general features of the network and their underlying
regulatory mechanisms that are presently predictable
on the basis of what is known experimentally.
We tested the model behaviour regarding some fre-
quently posed hypotheses about the physiological fea-
tures of the ammonium-assimilation network. The
hypotheses are mostly based upon qualitative experi-
mentation carried out in vitro. And even though they
are widely accepted to capture the functioning of the
network, they have hardly been confirmed in vivo. The
lack of confirmation is partially explained by the com-
plicated nature of such experiments. With the silicon
cell model at hand, we can determine to what extent
the model behaviour is consistent with these hypo-
theses. We considered the following hypotheses
[11–13,23]. (a) At low ammonium concentrations, GS
carries most of the ammonium assimilation flux, while
GDH takes over at high concentrations (> 1.0 mm).
(b) A sudden change in the ammonium concentration
brings about a short-term (metabolic regulation) redis-
tribution of the flux over GS and GDH caused by
(de-)adenylylation of GS. (c) The degree of adenylyla-
tion of GS is the most important regulator of GS. (d)
Upon a downshift in ammonium availability, extra GS
expression is necessary to sustain growth. In a qualitat-
ive sense, the model confirmed all of these hypotheses;
hence, they may be considered an additional validation
of the model. In addition, and more importantly, the
quantitative nature of the model allows us to make
detailed predictions on the behaviour of the network.
Comparison of the predictions with the relevant data
from the literature, if available, may give us clues
about further experimentation and modelling.
The following predictions stood out most conspicu-
ously in the model calculations. (a) Either the K
M
of
GS for ammonium is much lower than the reported
value of 100 lm or a free energy-dependent transporter
for ammonium uptake is mandatory when the intra-
cellular ammonium concentration falls below 30 lm.
This prediction is based on the in silico observation
that the ammonium assimilation flux collapses below
30 lm ammonium (Fig. 2). The observation indirectly
supports one (or both) of the above alternative predic-
tions, as can be argued as follows. It has been claimed
that the AmtB transport protein facilitates the diffu-
sion of ammonia (NH
3
) across the cytoplasmic mem-
brane; it would not actively transport the ammonium
ion [45]. Furthermore, at neutral pH, the ammonium
transporter appeared to be required only at very low
(< 1 0 lm) external ammonium concentrations [46].
Taken together, the implication would be that, given a
cytoplasmic pH of 7.5, the concentration of intracellu-
lar ammonium should then be even lower (< 3 lm).
Still growth was not affected [46]. In contrast, our
model indicates that at an intracellular ammonium
concentration < 3 lm the ammonium assimilation rate
would not be sufficient to sustain normal growth of
E. coli. In principle, this interesting discrepancy could
be reconciled by either one of the two predictions.
(b) The high affinity for ammonium of GS (K
M
¼
100 lm) relative to that of GDH (K
M
¼ 1100 lm)is
considered to be essential for the activity of the GS-
GOGAT route at low ammonium concentrations.
However, the network behaviour of our replica indi-
cates that the relatively high affinity for a-KG of
GOGAT (K
M
¼ 7 lm) compared to that of GDH
(K
M
¼ 300 lm) is on the basis of a similar argument
indicative for the activity of GS-GOGAT at a low car-
bon status. In other words, even at relatively high
ammonium concentrations and a simultaneously low
level of a-KG, GS-GOGAT would be considerably
active. Thus, the ammonium-assimilating network not
only ‘senses’ the N status but also the C status. Inte-
gration of N and C signals at the metabolic level may
occur in various sophisticated ways, that is, through
regulatory proteins, covalent modifications, and speci-
fic binding of small molecules, but also (partly) via
controlled mass action, that is, by controlling the
Multifarious regulation dissected F. J. Bruggeman et al.
1976 FEBS Journal 272 (2005) 1965–1985 ª 2005 FEBS
substrate and product availability. (c) UTase is not so
much involved in metabolic regulation of GS, and, as
a consequence, is expected to be more engaged in hier-
archical regulation. This prediction is based upon the
comparison of the calculated behaviour of our in silico
ATase, PII and UTase mutants. The removal of either
one of the three proteins at the time of an upshift in
the ammonium level, told us that UTase was not really
necessary for a well-behaved transient behaviour.
Without ATase or PII, a metabolic explosion occurred
as indicated by the excessive accumulation of GLN. It
is noteworthy that such experiments would be virtually
impossible to carry out in reality. UTase catalyses the
uridylylation of PII and PII and its uridylylated forms
interact not only with ATase but also with NRII, the
sensor protein of two component system NRI–NRII,
thereby indirectly affecting the phosphorylation degree
of NRI, the transcriptional regulator. (d) Upon a
downshift in the ammonium availability, expression of
GS is not only necessary (see hypothesis d) but also
sufficient to ensure ammonium assimilation after the
shift. This prediction needs some introduction. Upon
an upshift in ammonium availability, metabolic regula-
tion alone is sufficient to maintain ) by and large )
the ammonium assimilation flux at the level before
the shift (Figs 2 and 3). The situation is different, how-
ever, upon a downshift. Our calculations show that
upon an ammonium downshift, the GS expression
level ) that corresponds with cells that have been
grown at constant high ammonium concentra-
tions ) would be too low to sustain an ammonium
assimilation flux compatible with growth after the
shift; extra expression of GS is necessary. Moreover,
the calculations also show that extra expression of GS
alone is sufficient to arrive at an ammonium assimil-
ation flux compatible with growth (Fig. 4; Supplement-
ary Fig. S5), provided that a moderate amount of
GOGAT is present (i.e. V
max
>60mmÆmin
)1
is
needed). The latter condition is likely to be fulfilled.
GS and GOGAT are encoded by genes that are part
of separate operons (glnALG and gltBDF, respect-
ively). Expression of GOGAT, unlike that of GS, is
not regulated by NRIP [47] and expression levels of
GOGAT are rather condition-invariant ([31] and
unpublished data). Maximal activities of GOGAT
around 60 mmÆmin
)1
or higher are easily achieved.
(e) The sum of the fluxes of GS and GDH ) the over-
all ammonium assimilation flux ) is held almost con-
stant by the metabolic regulation considered in this
model provided that the cells have been adapted to
low levels of ammonium. This partial robustness of the
net ammonium assimilation flux is achieved by the
active regulation of the system, which is dominated by
the adenylylation of GS. The constancy of the ammo-
nium assimilation flux is accompanied by large changes
in the GLU level and the adenylylation state of GS
(not shown). The transient regulation stops when
GLN is nearly restored to its level before the ammo-
nium change (Fig. 3). It is tempting to speculate that
the observed robustness of the ammonium assimilation
flux is one of the salient functions of the regulatory
mechanisms around the GDH-GS ⁄ GOGAT system.
This paper reports on an example of a novel genera-
tion of computer models of parts of living cells, so-
called silicon cells. These ‘silicon cells’ incorporate all
existing experimental information on the molecules of
living cells into computer replica of parts of living cells.
This paper shows that biochemical calculations with
such silicon cell models can serve to calculate how the
network should be expected to function, on the basis of
what is known about its molecules. Comparison of the
calculated network behaviour with what is known
experimentally about physiological behaviour of the
network, serves as a test of whether the molecular
information suffices to understand observed function.
In addition, as shown in this paper, behaviour hypo-
thesized by the physiological community, can be provi-
ded with some molecular basis, if silicon cell behaviour
corresponds with the function that was hypothesized.
One should realize that the molecular information
on which the silicon cell of this paper was based, is
incomplete. Only eventually, when all relevant bio-
chemical knowledge has been obtained and incorpor-
ated in the model, silicon cells will reproduce the
physiological behaviour precisely (within experimental
error). We consider the construction and analysis of
this first-generation silicon cell models already a chal-
lenging and productive scientific endeavour, because it
may lead to the discovery of new principles and mech-
anisms [48,49]. Because such models are an exact as
possible representation of existing experimental infor-
mation, these discoveries should bear more on reality
than those of mainstream mathematical biology made
with phenomenological models.
Experimental procedures
The ammonium assimilation network is
composed of three interacting subnetworks
The network regulating ammonium assimilation in E. coli
at the metabolic level is depicted in Fig. 1. It consists of
three subnetworks, referred to as UTase, ATase and meta-
bolism, which are coupled by four intermediates: the two
PII species, i.e. PIIKG
1
and PIIUMP
3
KG
3
, the adenylyla-
tion state of GS (denoted by the number of adenylyl groups
F. J. Bruggeman et al. Multifarious regulation dissected
FEBS Journal 272 (2005) 1965–1985 ª 2005 FEBS 1977
per GS dodecamer, n
AMP
) and GLN. For a detailed discus-
sion of the assumptions underlying the modular structure
of this network the reader is referred to [50]. The enzymes
and metabolites will be assumed to be homogeneously
distributed in the cytoplasm. This allows us to describe the
dynamics of the network in terms of a set of nonlinear
ordinary differential equations.
Mass-flow description of the UTase subnetwork
and binding of a-KG to PII
Any of the three subunits of PII can be covalently modified
through (de-)uridylylation by the activity of the ambiguous
[51] enzyme UTase, which possesses uridylyl-transferase
(UT) and uridylyl-removing (UR) activities [26]. Eqns (1–3)
were used to describe the dynamics of the various uridylyl-
ated forms of PII.
dPIIUMP
1
dt
¼ v
UT;1
þ v
UR;2
À v
UR;1
À v
UT;2
ð1Þ
dPIIUMP
2
dt
¼ v
UT;2
þ v
UR;3
À v
UR;2
À v
UT;3
ð2Þ
dPIIUMP
3
dt
¼ v
UT;3
À v
UR;3
ð3Þ
Each v
i
in the differential equations (above and below)
denotes the rate at which a certain catalytic process i takes
place. Each rate depends on process-specific parameters
(e.g. K
M
and V
max
) and on concentrations of its substrates,
products, and effectors (see below). In view of the conserva-
tion of the total pool of PII (PII
tot
) at the metabolic time
scale, the concentration of unmodified PII was calculated
from the relationship
PII ¼ PII
tot
À PIIUMP
1
À PIIUMP
2
À PIIUMP
3
ð4Þ
The uridylylated and nonuridylylated PII species are trimers
[52], which can bind one molecule of ATP and one molecule
of a-KG per subunit [23,26]. The dissociation constant for
ATP and PII (% 15 lm [26]) and the physiological concen-
tration of ATP (% 5mm [53]) suggests that PII is practically
saturated with ATP under physiological conditions. It has
been shown that PII needs to be saturated with ATP in order
to be functional [26]. For notational convenience PII is used,
but one may read PIIATP
3
whenever PII is mentioned.
KG was assumed to bind to PII in a rapid-equilibrium
fashion, i.e. the rate of (de-)uridylylation of subunits of PII
was considered to be much slower than the rate of KG bind-
ing to PII. The concentrations of the PIIUMP
i
KG
j
(i,j ¼
0,…,3) species were calculated from the appropriate dissoci-
ation constants and the concentration of PIIUMP
i
KG
j
(i ¼
0,…,3; j ¼ 0,…,2) and KG. Of the 16 different forms of PII,
only two species, PIIKG
1
and PIIUMP
3
KG
3
, appear to
play a significant physiological role [12,52]. Equation (5)
gives the PIIKG
1
concentration as a function of the total
concentration of PII and KG, while Eqn (6) gives the PII-
UMP
3
KG
3
concentration as a function of PIIUMP
3
and
KG. The amount of KG sequestered by PII was considered
negligible; under physiological conditions in E. coli, the
range of KG concentrations is 0.1–0.9 mm [31] and the
range of PII concentrations is 1–3 l m [13,28] which maxi-
mally amounts to 9% sequestration of the total a-KG pool
to the PII-species.
PIIKG
1
¼
3 Á
PIIÁKG
K
1;PII
1 þ 3 Á
KG
K
1;PII
þ 3 Á
KG
2
K
1;PII
ÁK
2;PII
þ
KG
3
K
1;PII
ÁK
2;PII
ÁK
3;PII
ð5Þ
The values for the dissociation constants are: K
1,PII
¼ 5 lm,
K
2,PII
¼ 150 l m and K
3,PII
¼ 150 lm [28].
PIIUMP
3
KG
3
¼
PIIUMP
3
ÁKG
3
K
1;PIIU3
ÁK
2;PIIU3
ÁK
3;PIIU3
1 þ 3 Á
KG
K
1;PIIU3
þ 3 Á
KG
2
K
1;PIIU3
ÁK
2;PIIU3
þ
KG
3
K
1;PIIU3
ÁK
2;PIIU3
ÁK
3;PIIU3
ð6Þ
where K
1,PIIU3
¼ 25 lm, K
2,PIIU3
¼ 150 l m and K
3,PIIU3
¼
150 lm represent the dissociation constants [28].
Mass-flow description of the ATase subnetwork
GS consists of 12 identical subunits, each of which can be
(de) adenylylated. The time dependence of the concentra-
tion of deadenylylated GS was calculated as:
dGS
dt
¼ v
DEAD
À v
AD
ð7Þ
The rates of deadenylylation and adenylylation are given by
v
DEAD
and v
AD
, respectively. The total amount of GS present
in the cell (GS
tot
) was taken to be constant at the metabolic
time scale for which we studied the system. As deadenyl-
ylated GS was chosen as the independent variable, the con-
centration of GSAMP was calculated from GSAMP ¼
GS
tot
) GS. The adenylylation state of GS was calculated
using:
n
AMP
¼ 12 Á
GSAMP
GS
tot
Mass-flow description of the metabolism
subnetwork
The changes in the GLU and GLN concentrations were
calculated following Eqns (8) and (9), respectively:
dGLU
dt
¼ v
GDH
þ 2 Á v
GOGAT
À v
GS
À v
GLUDEM
1
ð8Þ
dGLN
dt
¼ v
GS
À v
GOGAT
À v
GLNDEM
1
ð9Þ
All products of GLN and of GLU metabolism were
lumped into two generalized metabolite pools, called
MET
GLN
and MET
GLU
, respectively. Equations (10 and
11) describe the changes of these two pools:
Multifarious regulation dissected F. J. Bruggeman et al.
1978 FEBS Journal 272 (2005) 1965–1985 ª 2005 FEBS
dMET
GLN
dt
¼ v
GLNDEM
1
À v
GLNDEM
2
ð10Þ
dMET
GLU
dt
¼ v
GLUDEM
1
À v
GLUDEM
2
ð11Þ
where v
GLNDEM1
and v
GLNDEM2
represent the rates of pro-
duction and consumption of MET
GLN
, respectively, and
v
GLUDEM1
and v
GLUDEM2
the rates of production and con-
sumption of MET
GLU
, respectively.
ATP was produced by the reaction referred to as ATP-
ase (which should be seen as a summary of glycolytic
and oxidative phosphorylation activities; Fig. 1) and
consumed in the reaction catalysed by GS. ATP con-
sumption due to adenylylation of GS was neglected (see
below):
dATP
dt
¼ v
ATPase
À v
GS
ð12Þ
The concentration of ADP was calculated from: ADP ¼
A
tot
– ATP. The concentration of inorganic phosphate (P
i
)
was considered constant.
Rate equations for the UTase module
The uridylylation reaction of UTase (UT) follows irrevers-
ible, product-sensitive, ordered bi-bi kinetics with an inhibi-
tory effect of GLN [26]:
where j ¼ 0,…,2, V
UT
¼ 0.0822 mmÆmin
)1
, K
i,PIIUMPj
¼ 0.0018
mm, K
UTP
¼ 0.04 mm, K
PIIUMPj
¼ 0.003 mm, K
PIIUMPj+1
¼
0.0035 mm, K
PPi
¼ 0.114 mm and K
GLN
¼ 0.070 mm [26].
The deuridylylation reaction of PIIUMP
i
by the
UTase (UR) follows irreversible, product-insensitive,
ordered uni-bi kinetics with an activating effect of GLN
[26]:
v
UR;j
¼
V
UR
Á PIIUMP
j
1 þ
K
GLN
GLN
ÀÁ
Á K
PIIUMPj
þ
P
3
j¼1
PIIUMP
i
þ
P
3
j¼1
PIIUMP
j
ÁUMP
K
UMP
0
B
@
1
C
A
ð14Þ
where, j ¼ 1, … ,3, V
UR
¼ 0.0033 mmÆmin
)1
, K
GLN
¼ 0.070
mm, K
PIIUMPj
¼ 0.0023 mm for all values of j and
K
UMP
¼ 8.4 mm [26]. The affinity of UTase (UR) for the
different forms of PII was taken to be independent of the
degree of saturation of PII with a-KG and UMP (see also
[26]).
Rate equations for the ATase module
For the adenylylation of GS by ATase we developed a
kinetic description, for lack of any published results. The
kinetic data for ATase published by Rhee et al. [54] were
not used here. Their assumption that a-KG directly inter-
acts with ATase was later shown to be incorrect by Jiang
et al. [23] (see also [52]). The latter authors showed that
the effect of a-KG was indirect and mediated by a-KG
bound to PII and to PIIUMP
3
. We started from irrevers-
ible product-insensitive Michaelis–Menten kinetics:
v
AD
¼ V
AD
Á 0
AD
Á
GS
K
GS
þ GSðÞ
ð15aÞ
where V
AD
¼ 0.5 mmÆmin
)1
and K
GS
¼ 0.0017 mm. The
factor J
AD
represents a rapid-equilibrium binding function
describing the binding of the effectors of the adenylylation
reaction to ATase:
0
AD
¼
b
1
Á
PIIKG
1
K
PIIKG
þ b
2
Á
GLN
K
GLN
þ b
3
Á
PIIKG
1
ÁGLN
aÁK
PIIKG
ÁK
GLN
1 þ
PIIKG
1
K
PIIKG
þ
GLN
K
GLN
þ
PIIKG
1
ÁGLN
aÁK
PIIKG
ÁK
GLN
ð15bÞ
where a ¼ 0.039, b
1
¼ 10
)22
, b
2
¼ 0.52, b
3
¼ 0.6, K
PIIKG
¼
10
)5
mm and K
GLN
¼ 0.97 mm. All b
i
factors correct for
the different catalytic rate constants (k
cat
values) of the dif-
ferent ATase-effector complexes, whereas the deviation of
a from 1 measures the cooperativity between PIIKG
1
and
GLN. All kinetic data in Eqns (15a and b) (and Eqns 16c
and d) resulted from fitting the ATase kinetics with a
model containing the Eqns (1–4 and 7) to transient and
steady-state experimental data concerning GS activity and
the degree of adenylylation of GS [28] using the software
package Gepasi [55–57]. Please note that the fitting was not
to system behaviour, but to behaviour of enzyme activity.
The deadenylylation of GS by ATase was described
similarly:
v
DEAD
¼ V
DEAD
Á 0
DE
Á
GSAMP
K
GSAMP
þ GSAMPðÞ
ð16aÞ
where V
DEAD
¼ 0.5 mmÆmin
)1
and K
GSAMP
¼ 0.0002 mm.
The factor J
DE
represents a rapid-equilibrium binding func-
tion for the binding of the effectors of the deadenylylation
reaction to ATase:
v
UT;jþ1
¼
V
UT
Á PIIUMP
j
Á UTP
1 þ
GLN
K
GLN
Á
K
i;PIIUMPj
Á K
UTP
þ K
UTP
Á
P
2
i¼0
PIIUMP
i
þ K
PIIUMP
j
Á UTP þ
P
2
i¼0
PIIUMP
i
Á UTP
þ
K
PIIUMPj
ÁK
UTP
Á
P
2
i¼0
PIIUMP
jþ1
K
PIIUMP
jþ1
þ
P
2
i¼0
PIIUMP
i
ÁUTPÁPPi
K
PPi
0
B
B
B
@
1
C
C
C
A
ð13Þ
F. J. Bruggeman et al. Multifarious regulation dissected
FEBS Journal 272 (2005) 1965–1985 ª 2005 FEBS 1979
where A ¼ PIIKG
1
,B¼ GLN, and C ¼ PIIUMP
3
KG
3
.
Furthermore, a
1
¼ 0.023, a
2
¼ 0.88, a
3
¼ 8.49, a
4
¼ 0.88,
b
1
¼ 10
)22
, b
2
¼ 2.77, b
3
¼ 3.23, b
4
¼ 0.0049, b
5
¼ 10
)22
,
b
6
¼ 10
)22
, b
7
¼ 10
)22
, K
PIIKG
¼ 2.2 · 10
)6
mm, K
GLN
¼
0.044 mm and K
PIIUMP3KG3
¼ 1.8 · 10
)5
mm. The factors
a
i
and b
i
have the same meaning as in Eqn (15b). The kin-
etic parameters a
i
en b
i
were obtained from the same fitting
session as described for the adenylylation reaction.
Rate equations for the metabolism module
Glutamate dehydrogenase (GDH) catalyses the formation
of GLU and NADP
+
(NADP) from NH
4
+
, a-KG and
[NADPH + H
+
] (NADPH). GDH kinetics was described
by:
v
GDH
¼
V
GDH
K
KG
ÁK
NH
þ
4
ÁK
NADPH
Á KG Á NH
þ
4
Á NADPH À
GLUÁNADP
K
eq
1 þ
NH
4
þ
K
NH
þ
4
1 þ
KG
K
KG
þ
GLU
K
GLU
1 þ
NADPH
K
NADPH
þ
NADP
K
NADP
ð17Þ
where the dissociation constants are: K
KG
¼ 0.32 mm,
K
NADPH
¼ 0.04 mm, K
NH4+
¼ 1.1 mm, K
NADP
¼ 0.042 mm
[15], K
GLU
¼ 10 mm, and K
eq
¼ 1290 mm
)1
(http://xpdb.
nist.gov/enzyme_thermodynamics/enzyme_thermodynamics.
html).
GOGAT catalyses the formation of two molecules of
GLU and one molecule NADP
+
from one molecule each of
GLN, a-KG and NADPH. Its kinetics is described by an
irreversible rapid-equilibrium ter-ter mechanism that incor-
porates a noncompetitive inhibitory effect of MET
GLU
:
where the dissociation constants are: K
GLN
¼ 0.175 mm,
K
KG
¼ 0.007 mm, K
NADPH
¼ 0.0015 mm, K
GLU
¼ 11 mm,
K
NADP
¼ 0.0037 mm [19] and K
METGLU
¼ 0.65 mm (man-
ual optimization).
GS catalyses the formation of GLN, ADP and P
i
from
GLU, ammonium and ATP. It obeys a random ter-ter
mechanism with a preferential ordered ter-ter pathway [58].
This was approximated by a rapid-equilibrium binding
mechanism. The effect of adenylylation (n
AMP
) on the activ-
ity of GS is most pronounced on its maximal rate [59]:
with the apparent maximal rate constant as V
APP
GS
¼
0
GS
Á V
GS
and the affinity constants K
ATP
¼ 0.35 mm,
K
GLU
¼ 4.1 mm, K
NH4+
¼ 0.1 mm, K
ADP
¼ 0.0585 mm,
K
Pi
¼ 3.7 mm, and K
GLN
¼ 5.65 mm (determined at
adenylyation state 1.7–3.3 [58]), and the equilibrium con-
stant K
eq
¼ 460 [11]. The GS
tot
concentration is % 14 lm
at physiological conditions of adaptation to low ammo-
nium concentrations [13]. The phenomenological factor
J
GS
was obtained from a fit of the dependence of the maxi-
mal rate of GS to the adenylylation state as measured by
[59] and described by:
0
GS
¼
a
1
1 þ
n
AMP
a
2
a
3
Á
b
1
1 þ
n
AMP
b
2
b
3
ð19bÞ
with a
1
¼ 10, a
2
¼ 2.37, a
3
¼ 1.15, b
1
¼ 0.10, b
2
¼ 10.87
and b
3
¼ 19.22. The values for a
i
en b
i
were obtained from
fitting the apparent maximal rate of GS to its adenylylation
state with Mg
2+
as cofactor (Fig. 2 in [59]). Ginsburg et al.
[59] reported moderate cooperative effects of the rate of GS
with respect to its substrates. Their analysis however, was
insufficient to extract allosteric kinetic information. There-
fore, we choose to approximate the kinetics of GS by
Eqns (19a and b). The maximal rate of GS under glucose-
limited chemostat culturing conditions was experimentally
determined (Table 1). However, the rate is uncorrected for
adenylylation; to take the effect of adenylylation into
account we deduced a correction factor of 5.5 from data
published by Senior [31].
The consumption of GLU, GLN, MET
GLU
, and
MET
GLN
by the lumped enzyme systems GLUDEM
1
,
GLNDEM
1
, GLUDEM
2
and GLNDEM
2
, respectively,
were all modeled with product-sensitive Michaelis-Menten
kinetics:
v
GOGAT
¼
V
GOGAT
Á
GLNÁKGÁNADPH
K
GLN
ÁK
KG
ÁK
NADPH
1 þ
MET
GLU
K
METGLU
Á 1 þ
GLN
K
GLN
þ
GLU
K
GLU
Á 1 þ
KG
K
KG
þ
GLU
K
GLU
Á 1 þ
NADPH
K
NADPH
þ
NADP
K
NADP
ð18Þ
v
GS
¼
V
APP
GS
K
ATP
K
NH
þ
4
K
GLU
ATP Á NH
þ
4
Á GLU À
ADPÁGLNÁPi
K
eq
1 þ
ATP
K
ATP
þ
ADP
K
ADP
þ
Pi
K
Pi
þ
ADPÁPi
K
ADP
K
Pi
1 þ
NH
þ
4
K
NH
þ
4
þ
GLN
K
GLN
þ
GLU
K
GLU
þ
GLNÁNH
þ
4
K
GLN
K
NH
þ
4
þ
GLUÁNH
þ
4
K
GLU
K
NH
þ
4
ð19aÞ
0
DE
¼
b
1
Á
A
K
A
þ b
2
Á
B
K
B
þ b
3
Á
C
K
C
þ b
4
Á
AÁB
a
1
ÁK
A
ÁK
B
þ b
5
Á
AÁC
a
2
ÁK
A
ÁK
C
þ b
6
Á
BÁC
a
3
ÁK
B
ÁK
C
þ b
7
Á
AÁBÁC
a
4
ÁK
A
ÁK
B
ÁK
C
1 þ
A
K
A
þ
B
K
B
þ
C
K
C
þ
AÁB
a
1
ÁK
A
ÁK
B
þ
AÁC
a
2
ÁK
A
ÁK
C
þ
BÁC
a
3
ÁK
B
ÁK
C
þ
AÁBÁC
a
4
ÁK
A
ÁK
B
ÁK
C
ð16bÞ
Multifarious regulation dissected F. J. Bruggeman et al.
1980 FEBS Journal 272 (2005) 1965–1985 ª 2005 FEBS
v ¼
V
max
S
K
m;S
1 þ
S
K
m;S
þ
P
K
m;P
ð20Þ
(where S and P represent the concentrations of substrate
and product, respectively.) P was arbitrarily set at 0.1 mm
for the GLNDEM
2
and GLUDEM
2
rate equations. The
kinetic parameters of the four lumped enzyme systems are
given in Table 5 and were chosen such that (a) the net
ammonium-assimilation fluxes (J
N
¼ 34–46 mm min
)1
cf.
Table 1) were consistent with intermediate specific growth
rates of E. coli (0.4–0.6 h
)1
) and (b) the flux via the GLU
demand route was approximately eight times higher than
the flux via the GLN demand route [32].
The kinetics for the ATP re-synthesis reaction was
described with irreversible product-insensitive Michaelis–
Menten kinetics,
v ¼
V
ATP
ADP
K
ADP
þ ADP
ð21Þ
with V
ATP
¼ 100 mmÆmin
-1
and K
ADP
¼ 0.5 mm.
Physiological conditions
All the concentrations in the model (irregardless of whether
they are variables or parameters) are intracellular concen-
trations. No measurements of the intracellular ammonium
concentrations could be found in the literature. The internal
ammonium concentration for E. coli W growing in an
ammonium-limited chemostat at a growth rate of 0.3 h
)1
can be estimated for the data obtained by Senior [31]. Assu-
ming a 14% nitrogen content [60] and that the cytoplasmic
volume equals 2 lLÆmg
)1
dry weight [13] we obtain an
ammonia assimilation flux (J
NH3
)of25mmÆmin
)1
. Assu-
ming that ammonia crosses the membrane by passive
diffusion only, the ammonia gradient (DNH
3
¼ NH
3,cult
)
NH
3,cyto
) over the membrane in a steady state with this
ammonia assimilation flux can be estimated to be DNH
3
¼
J
NH3
V
cell
⁄ (PA
cell
) (where J
NH3
is in mmolÆL
cyto
)1
Æmin
)1
,
V
cell
denotes the cellular volume in l
cyto
Æcell
)1
, P equals the
permeability coefficient of NH
3
for E. coli lipo-
somes ) 1.2 dmÆmin
)1
[61], and A
cell
denotes the area of the
plasma membrane of E. coli in dm
2
Æcell
)1
). If we assume
E. coli to be cigar shaped (perfectly spherical at the two
ends) with a radius of 0.3 · 10
)6
m, and a total length of
3 · 10
)6
m [62], its volume and surface area should equal
0.79 · 10
)18
m
3
and 5.6 · 10
)12
m
2
, respectively. We calcu-
late an ammonia gradient of 29 nm. From the data of
Senior [31] the ammonium concentration in the culture can
be estimated to be 78 lm at 0.3 h
)1
using a Monod con-
stant of 130 lm for ammonium, and a maximal growth rate
of 0.8 h
)1
, as obtained from a fit of the Monod equation to
the growth rate as function of the ammonium concentra-
tion in the culture. At a culture pH of 7.15 and using an
acid dissociation constant pK
a
equal to 9.25, this amounts
to an ammonia concentration in the culture of 0.62 lm.
Considering the ammonia gradient over the membrane
(29 nm), the cytoplasmic ammonia and ammonium concen-
tration become 0.59 lm and 33.2 lm, respectively (cytoplas-
mic pH was assumed to be 7.5). We estimated the
cytoplasmic ammonium concentration of E. coli K12 grow-
ing ammonium-limited in a chemostat at a growth rate of
0.3 h
)1
to be somewhat higher due its smaller maximal
growth rate (% 0.5 h
)1
, determined in our laboratory), i.e.
we took 50 lm for the cytoplasmic ammonium concentra-
tion when evaluating the model at ammonium-limited
conditions. For glucose-limited growth no values for the
intracellular ammonium concentration could be found
either. To characterize ammonium sufficiency under these
growth conditions the ammonium concentration was taken
to be 1.0 mm (10 times higher than the K
M
of GS for
ammonium and close to the K
M
of GDH for ammonium).
The proteins and metabolites that were considered
parameters in the model are listed in Table 6. The values
for the intracellular concentrations of these proteins and
metabolites as used in the calculations were considered to
represent ‘normal’ physiological conditions. The total GS
concentration (GS
tot
)of14lm was chosen as a representa-
tive value for cells grown in the absence of ammonium
[13].
E. coli contains the glnKamtB operon, which encodes a
paralogue of PII, i.e. GlnK, and the ammonium trans-
porter, AmtB [24,67]. This operon is under the control of
NRIP and is not expressed constitutively. So far it seems to
be expressed only under conditions of (severe) nitrogen
limitation [24,25,27]. The proteins GlnK and AmtB were
not included in the kinetic model. Our model is therefore
Table 5. Kinetic parameters of the GLN and GLU consumption
reactions.
Reaction V
max
[mM min
)1
] K
m,S
[mM] K
m,P
[mM]
GLUDEM
1
120 8 0.5
GLUDEM
2
30 0.3 0.5
GLNDEM
1
70 2 0.25
GLNDEM
2
20 1 0.5
Table 6. Physiological parameters used in the silicon cell.
Protein or metabolite Concentration (m
M) Reference
PII
tot
0.003 [13]
UTP 0.5 [63]
GS
tot
(dodecamer) 0.014 [13]
a
UMP 0.01 [64]
PPi 0.05 [65]
A
tot
5.4 [53]
P
i
10 [65]
NADPH 0.15 [66]
NADP 0.05 [66]
a
Determined in the absence of ammonium (growth on GLN).
F. J. Bruggeman et al. Multifarious regulation dissected
FEBS Journal 272 (2005) 1965–1985 ª 2005 FEBS 1981
only valid under conditions preventing the expression of
the glnKamtB operon. These conditions are likely to be met
when E. coli is growing in batch cultures with ammonium
as the nitrogen source, in glucose-limited chemostat cul-
tures, and in ammonium-limited chemostat cultures at
intermediary growth rates. Unfortunately, direct and quan-
titative measurements of the expression level of AmtB in
relation to the external ammonium concentration have not
been reported so far.
Our model did also not include the reported cumulative
feedback inhibition of GS and adenylylated GS. Under
normal physiological conditions end product inhibition was
taken to be negligible [20].
Determination of maximal activities of GS,
GOGAT, and GDH
The dilution rate in an ammonium-limited and glucose-
limited chemostat at which we determined the maximal
rates of GS, GDH and GOGAT for E. coli K12 (YMC10)
in cell-free extract was 0.3 h
)1
. E. coli K12 was grown aero-
bically (sterile air flow of 15 LÆh
)1
)at37°Cina1L
fermentor with a 0.5 L working volume. The mineral med-
ium contained 10 mm NaH
2
PO
4
,10mm KCl, 1.25 mm
MgCl
2
,2mm Na
2
SO
4
, 0.38 gÆL
)1
nitrilo-tri-acetic acid,
20 mm CaCl
2
, 2.5 mgÆL
)1
thiamine HCl, 5 mLÆL
)1
micronutrients stock solution [68], and 50 lLÆL
)1
silicone
antifoaming agent (BDH laboratory supplies). The glucose-
limited cultures contained 14 mm NH
4
Cl and 15 mm glu-
cose. The ammonium-limited cultures contained 11 mm
NH
4
Cl and 20 mm glucose. Samples were taken from the
chemostat and rapidly injected into )45 °C methanol (60%;
diluted with 10 · Mops [69] pH 7.5 to a final volume frac-
tion of sample ⁄ methanol ¼ 1 : 2.5, w ⁄ v). Cell-free extract
was prepared by ultrasonification after harvesting, fixation,
and washing. Extracts were stored at )20 °C. Protein in
cell-free extracts was determined with a BCA protein deter-
mination method (BCA protein assay kit, Pierce). The max-
imal activities of GS, GOGAT and GDH were all
measured spectrophotometrically. The measurements of
GOGAT and GDH involved following the oxidation of
NADPH. The assays were performed at 37 °C by the addi-
tion of 200 lL cell-free extract to a reaction mixture (final
volume 2.0 mL) of 1 · Mops pH 7.5 containing 5 mm
a-KG, 250 lm NADPH, and either 40 mm NH
4
Cl (GDH
assay) or 5 mm GLN (GOGAT assay). The GS activity
was measured at 37 °C in the biosynthetic direction
(Mg
2+
-dependent) in a coupled assay containing pyruvate
kinase (Sigma) and lactate dehydrogenase (Roche). The
reaction was started by the addition of 100 lL cell-free
extract to a 100-mm Hepes pH 7.5 solution (to a final vol-
ume of 2.0 mL) containing 128 mm NH
4
Cl, 5 mm ATP,
20 mm GLU, 1 mm phosphoenolpyruvate, 100 lgÆmL
)1
lactate dehydrogenase (Roche), 25 lgÆ mL
)1
pyruvate kinase
(Sigma), 280 lm NADH and 100 mm MgCl
2
.
Numerical methods
The model was developed with the public domain system-
biology software packages jarnac (tech.
edu/$hsauro/) and gepasi [55–57]. The commercially avail-
able package mathematica (Wolfram Research, Inc.,
Mathematica, Version 4.2 & 5, Champaign, IL; 1999) was
used for all calculations shown in this paper.
Acknowledgements
The authors thank Herbert M. Sauro for answering
questions regarding the software package jarnac,
Wally van Heeswijk for discussions about the GS
regulatory network in general, Lody de Groot for per-
forming the experiments, and Boris N. Kholodenko
and Jan B. Hoek for discussions on the modular
organization of metabolism.
References
1 Westerhoff HV, Koster JG, van Workum M & Rudd
KE (1989) On the control of gene expression. In Con-
trol of Metabolic Processes (Cornish-Bowden A &
Cardenas ML, eds), pp. 399–413. Plenum Press,
New York.
2 Bakker BM, Michels PAM, Opperdoes FR & Westerh-
off HV (1997) Glycolysis in bloodstream form Trypa-
nosoma brucei can be understood in terms of the
kinetics of the glycolytic enzymes. J Biol Chem 272,
3207–3215.
3 Teusink B, Passarge J, Reijenga CA, Esgalhado E, van
der Weijden CC, Schepper M, Walsh MC, Bakker
BM, van Dam K, Westerhoff HV & Snoep JL (2000)
Can yeast glycolysis be understood in terms of in vitro
kinetics of the constituent enzymes? Testing biochemis-
try. Eur J Biochem 267, 5313–5329.
4 Rohwer JM, Meadow ND, Roseman S, Westerhoff
HV & Postma PW (2000) Understanding glucose
transport by the bacterial phosphoenolpyruvate: glu-
cose phosphotransferase system on the basis of kinetic
measurements in vitro. J Biol Chem 275, 34909–34921.
5 Kholodenko BN, Demin OV, Moehren G & Hoek JB
(1999) Quantification of short term signaling by the
epidermal growth factor receptor. J Biol Chem 274,
30169–30181.
6 Westerhoff HV (2001) The silicon cell, not dead but
live! Metab Eng 3, 207–210.
7 Hoefnagel MH, Starrenburg MJ, Martens DE, Huge-
nholtz J, Van Kleerebezem MSII, Bongers R, Westerh-
off HV & Snoep JL (2002) Metabolic engineering of
lactic acid bacteria, the combined approach: kinetic
modelling, metabolic control and experimental analy-
sis. Microbiology 148, 1003–1013.
Multifarious regulation dissected F. J. Bruggeman et al.
1982 FEBS Journal 272 (2005) 1965–1985 ª 2005 FEBS
8 Shapiro BM, Kingdon HS & Stadtman ER (1967)
Regulation of glutamine synthetase. VII. Adenylyl
glutamine synthetase: a new form of the enzyme with
altered regulatory and kinetic properties. Proc Natl
Acad Sci USA 58, 642–649.
9 Stadtman ER (1990) Discovery of glutamine synthe-
tase cascade. Methods Enzymol 182, 793–809.
10 Rhee SG, Chock PB & Stadtman ER (1989) Regula-
tion of Escherichia coli glutamine synthetase. Adv
Enzymol Relat Areas Mol Biol 62, 37–92.
11 Rhee SG, Chock PB & Stadtman ER (1985) Gluta-
mine synthetase from Escherichia coli. Methods Enzy-
mol 113, 213–241.
12 Ninfa AJ, Jiang P, Atkinson MR & Peliska JA (2000)
Integration of antagonistic signals in the regulation of
nitrogen assimilation in Escherichia coli. Curr Top Cell
Regul 36, 31–75.
13 Heeswijk WC van (1998) The glutamine synthetase cas-
cade: A search for its control and regulation. PhD The-
sis, Free University of Amsterdam, the Netherlands.
14 Miller RE & Stadtman ER (1972) Glutamate synthase
from Escherichia coli. An iron-sulfide flavoprotein.
J Biol Chem 247, 7407–7419.
15 Sakamoto N, Kotre AM & Savageau MA (1975) Glu-
tamate dehydrogenase from Escherichia coli: purifica-
tion and properties. J Bacteriol 124, 775–783.
16 Helling RB (1998) Pathway choice in glutamate syn-
thesis in Escherichia coli. J Bacteriol 180, 4571–4575.
17 Helling RB (1994) Why does Escherichia coli have
two primary pathways for synthesis of glutamate?
J Bacteriol 176, 4664–4668.
18 Booth IR & Higgins CF (1990) Enteric bacteria and
osmotic stress: intracellular potassium glutamate as a
secondary signal of osmotic stress? FEMS Microbiol
Rev 6, 239–246.
19 Rendina AR & Orme-Johnson WH (1978) Glutamate
synthase: on the kinetic mechanism of the enzyme
from Escherichia coli W. Biochemistry 17, 5388–5393.
20 Woolfolk CA & Stadtman ER (1967) Regulation of
glutamine synthetase. 3. Cumulative feedback inhibi-
tion of glutamine synthetase from Escherichia coli.
Arch Biochem Biophys 118, 736–755.
21 Kingdon HS, Shapiro BM & Stadtman ER (1967)
Regulation of glutamine synthetase. 8. ATP: glutamine
synthetase adenylyltransferase, an enzyme that catalyzes
alterations in the regulatory properties of glutamine
synthetase. Proc Natl Acad Sci USA 58, 1703–1710.
22 Jaggi R, van Heeswijk WC, Westerhoff HV, Ollis DL
& Vasudevan SG (1997) The two opposing activities of
adenylyl transferase reside in distinct homologous
domains, with intramolecular signal transduction.
EMBO J 16, 5562–5571.
23 Jiang P, Peliska JA & Ninfa AJ (1998) The regulation
of Escherichia coli glutamine synthetase revisited: role
of 2-ketoglutarate in the regulation of glutamine
synthetase adenylylation state. Biochemistry 37,
12802–12810.
24 van Heeswijk WC, Hoving S, Molenaar D, Stegeman
B, Kahn D & Westerhoff HV (1996) An alternative
PII protein in the regulation of glutamine synthetase in
Escherichia coli. Mol Microbiol 21, 133–146.
25 Atkinson MR & Ninfa AJ (1999) Characterization of
the GlnK protein of Escherichia coli. Mol Microbiol
32, 301–313.
26 Jiang P, Peliska JA & Ninfa AJ (1998) Enzymological
characterization of the signal-transducing
uridylyltransferase ⁄ uridylyl-removing enzyme (EC
2.7.7.59) of Escherichia coli and its interaction with the
PII protein. Biochemistry 37, 12782–12794.
27 Blauwkamp TA & Ninfa AJ (2002) Physiological role
of the GlnK signal transduction protein of Escherichia
coli: survival of nitrogen starvation. Mol Microbiol 46,
203–214.
28 Jiang P, Peliska JA & Ninfa AJ (1998) Reconstitution
of the signal-transduction bicyclic cascade responsible
for the regulation of Ntr gene transcription in Escheri-
chia coli. Biochemistry 37, 12795–12801.
29 Kamberov ES, Atkinson MR & Ninfa AJ (1995) The
Escherichia coli PII signal transduction protein is acti-
vated upon binding 2-ketoglutarate and ATP. J Biol
Chem 270, 17797–17807.
30 de la Fuente A, Snoep JL, Westerhoff HV & Mendes
P (2002) Metabolic control in integrated biochemical
systems. Eur J Biochem 269, 4399–4408.
31 Senior PJ (1975) Regulation of nitrogen metabolism in
Escherichia coli and Klebsiella aerogenes: studies with
the continuous-culture technique. J Bacteriol 123, 407–
418.
32 Reitzer LJ (1996) Ammonia assimilation and the bio-
synthesis of glutamine, glutamate, aspartate, aspara-
gine, l-alanine, and d-alanine. In Escherichia coli and
Salmonella: cellular and molecular biology (Neidhardt
EA, ed.), pp. 391–407. ASM Press, Washington, D.C.
33 Lowry OH, Carter J, Ward JB & Glaser L (1971) The
effect of carbon and nitrogen sources on the level of
metabolic intermediates in Escherichia coli. J Biol
Chem 246, 6511–6521.
34 Osorio AV, Camarena L, Salazar G, Noll-Louzada M
& Bastarrachea F (1993) Nitrogen regulation in an
Escherichia coli strain with a temperature sensitive
glutamyl-tRNA synthetase. Mol Gen Genet 239, 400–
408.
35 Roe AJ, McLaggan D, Davidson I, O’Byrne C &
Booth IR (1998) Perturbation of anion balance during
inhibition of growth of Escherichia coli by weak acids.
J Bacteriol 180, 767–772.
36 Goss TJ, Perez-Matos A & Bender RA (2001) Roles of
glutamate synthase, gltBD, and gltF in nitrogen meta-
bolism of Escherichia coli and Klebsiella aerogenes.
J Bacteriol 183, 6607–6619.
F. J. Bruggeman et al. Multifarious regulation dissected
FEBS Journal 272 (2005) 1965–1985 ª 2005 FEBS 1983
37 Kustu S, Hirschman J, Burton D, Jelesko J & Meeks
JC (1984) Covalent modification of bacterial glutamine
synthetase: physiological significance. Mol Gen Genet
197, 309–317.
38 Kustu S, Hirschman J & Meeks JC (1985) Adenylyla-
tion of bacterial glutamine synthetase: physiological
significance, Curr Top Cell Regul 27, 201–213.
39 Bancroft S, Rhee SG, Neumann C & Kustu S (1978)
Mutations that alter the covalent modification of glu-
tamine synthetase in Salmonella typhimurium. J Bacter-
iol 134, 1046–1055.
40 Bloom FR, Levin MS, Foor F & Tyler B (1978) Regu-
lation of glutamine synthetase formation in Escherichia
coli: characterization of mutants lacking the uridylyl-
transferase. J Bacteriol 134, 569–577.
41 van Heeswijk WC, Stegeman B, Hoving S, Molenaar
D, Kahn D & Westerhoff HV (1995) An additional
PII in Escherichia coli: a new regulatory protein in the
glutamine synthetase cascade. FEMS Microbiol Lett
132, 153–157.
42 Westerhoff HV, Hellingwerf KJ & Van Dam K (1983)
Thermodynamic efficiency of microbial growth is low
but optimal for maximal growth rate. Proc Natl Acad
Sci USA 80, 305–309.
42a Weiss V, Claverie-Martin F & Magasanik B (1992)
Phosphorylation of nitrogen regulator I of Escherichia
coli induces strong cooperative binding to DNA essen-
tial for activation of transcription. Proc Natl Acad Sci
USA 89, 5088–5092.
43 Schutt H & Holzer H (1972) Biological function of the
ammonia-induced inactivation of glutamine synthetase
in Escherichia coli. Eur J Biochem 26, 68–72.
44 van Heeswijk WC, Rabenberg M, Westerhoff HV &
Kahn D (1993) The genes of the glutamine synthe-
tase adenylylation cascade are not regulated by nitro-
gen in Escherichia coli. Mol Microbiol 9, 443–457.
45 Soupene E, He L, Yan D & Kustu S (1998) Ammonia
acquisition in enteric bacteria: physiological role of the
ammonium ⁄ methylammonium transport B (AmtB)
protein. Proc Natl Acad Sci USA 95, 7030–7034.
46 Soupene E, Lee H & Kustu S (2002)
Ammonium ⁄ methylammonium transport (Amt) pro-
teins facilitate diffusion of NH3 bidirectionally. Proc
Natl Acad Sci USA 99, 3926–3931.
47 Ernsting BR, Denninger JW, Blumenthal RM & Mat-
thews RG (1993) Regulation of the gltBDF operon of
Escherichia coli: how is a leucine-insensitive operon
regulated by the leucine-responsive regulatory protein?
J Bacteriol 175, 7160–7169.
48 Teusink B, Walsh MC, van Dam K & Westerhoff HV
(1998) The danger of metabolic pathways with turbo
design. Trends Biochem Sci 23, 162–169.
49 Bakker BM, Mensonides FI, Teusink B, van Hoek
P, Michels PA & Westerhoff HV (2000) Compart-
mentation protects trypanosomes from the dangerous
design of glycolysis. Proc Natl Acad Sci USA 97,
2087–2092.
50 Bruggeman FJ, Westerhoff HV, Hoek JB & Kholo-
denko BN (2002) Modular response analysis of cellular
regulatory networks. J Theor Biol 218, 507–520.
51 Ortega F, Acerenza L, Westerhoff HV, Mas F & Cas-
cante M (2002) Product dependence and bifunctionality
compromise the ultrasensitivity of signal transduction
cascades. Proc Natl Acad Sci USA 99, 1170–1175.
52 Ninfa AJ & Atkinson MR (2000) PII signal transduc-
tion proteins. Trends Microbiol 8, 172–179.
53 Rohwer JM, Jensen PR, Shinohara Y, Postma PW &
Westerhoff HV (1996) Changes in the cellular energy
state affect the activity of the bacterial phosphotrans-
ferase system. Eur J Biochem 235, 225–230.
54 Rhee SG, Park R, Chock PB & Stadtman ER (1978)
Allosteric regulation of monocyclic interconvertible
enzyme cascade systems: use of Escherichia coli gluta-
mine synthetase as an experimental model. Proc Natl
Acad Sci USA 75, 3138–3142.
55 Mendes P (1993) GEPASI: a software package for
modelling the dynamics, steady states and control of
biochemical and other systems. Comput Appl Biosci 9,
563–571.
56 Mendes P (1997) Biochemistry by numbers: simulation
of biochemical pathways with Gepasi 3. Trends Bio-
chem Sci 22, 361–363.
57 Mendes P & Kell D (1998) Non-linear optimization of
biochemical pathways: applications to metabolic engi-
neering and parameter estimation. Bioinformatics 14,
869–883.
58 Meek TD & Villafranca JJ (1980) Kinetic mechanism
of Escherichia coli glutamine synthetase. Biochemistry
19, 5513–5519.
59 Ginsburg A, Yeh J, Hennig SB & Denton MD (1970)
Some effects of adenylylation on the biosynthetic prop-
erties of the glutamine synthetase from Escherichia
coli. Biochemistry 9, 633–649.
60 Buurman ET, Teixeira de Mattos MJ & Neijssel OM
(1989) Nitrogen-limited behaviour of micro-organisms
growing in the presence of large concentrations of
ammonium ions. FEMS Microbiol Lett 49, 229–232.
61 Mathai JC, Sprott GD & Zeidel ML (2001) Molecular
mechanisms of water and solute transport across
archaebacterial lipid membranes. J Biol Chem 276,
27266–27271.
62 Francke C, Postma PW, Westerhoff HV, Blom JG &
Peletier MA (2003) Why the phosphotransferase sys-
tem of Escherichia coli escapes diffusion limitation.
Biophys J 85, 612–622.
63 Landick R, Turnbough JRCL & Yanofski C (1996)
Transcription attenuation. In Escherichia coli and
Salmonella: cellular and molecular biology (Neidhardt
EA, ed.), pp. 1263–1286. ASM Press, Washington,
D.C.
Multifarious regulation dissected F. J. Bruggeman et al.
1984 FEBS Journal 272 (2005) 1965–1985 ª 2005 FEBS
64 Neidhardt FC & Umbarger HE (1996) Chemical
composition of Escherichia coli.InEscherichia coli and
Salmonella: cellular and molecular biology (Neidhardt
EA, ed.), pp. 13–17. ASM Press, Washington, D.C.
65 Wanner BL (1996) Phosphorus assimilation and con-
trol of the phosphate regulon. In Escherichia coli and
Salmonella: cellular and molecular biology (Neidhardt
EA, ed.), pp. 1357–1381. ASM Press, Washington,
D.C.
66 Penfound T & Foster JW (1996) Biosynthesis and
recycling of NAD. In Escherichia coli and Salmonella:
cellular and molecular biology (Neidhardt EA, ed.),
pp. 721–730. ASM Press, Washington, D.C.
67 Thomas G, Coutts G & Merrick M (2000) The
glnKamtB operon. A conserved gene pair in prokar-
yotes. Trends Genet 16, 11–14.
68 Evans CGT, Herbert D & Tempest DW (1970) The
continuous culture of microorganisms. 2. Construction
of a chemostat. In Methods in Microbiology (Norris R
& Ribbons DW, eds), pp. 277–327. Academic Press,
London New York.
69 Neidhardt FC, Bloch PL & Smith DF (1974) Culture
medium for enterobacteria. J Bacteriol 119, 736–747.
Supplementary material
The following material is available from http://www.
blackwellpublishing.com/products/journal s/suppmat/
EJB/EJB4626/EJB4626sm.htm
Fig. S1. Transient response of the network to a sudden
increase in the ammonium concentration at time zero
and the simultaneous deletion of ATase.
Fig. S2. Transient response of the network to a sudden
increase in the ammonium concentration at time zero
and the simultaneous deletion of UTase.
Fig. S3. Transient response of the network to a sudden
increase in the ammonium concentration at time zero
and the simultaneous deletion of PII.
Fig. S4. Temporal dynamics of the regulatory contrib-
utors of the regulators of GS upon the sudden change
in the ammonium concentration considered in Fig. 3
of the main text.
Fig. S5. The steady-state ammonium-assimilation flux
(N) as function of the maximal rate of GS and
GOGAT.
F. J. Bruggeman et al. Multifarious regulation dissected
FEBS Journal 272 (2005) 1965–1985 ª 2005 FEBS 1985