AlphaLogD determination: An optimized Reversed-Phase Liquid Chromatography method to measure lipophilicity on neutral and basic small and Beyond-Rule-of-Five compounds
Bạn đang xem bản rút gọn của tài liệu. Xem và tải ngay bản đầy đủ của tài liệu tại đây (1.7 MB, 11 trang )
Journal of Chromatography A 1674 (2022) 463146
Contents lists available at ScienceDirect
Journal of Chromatography A
journal homepage: www.elsevier.com/locate/chroma
AlphaLogD determination: An optimized Reversed-Phase Liquid
Chromatography method to measure lipophilicity on neutral and basic
small and Beyond-Rule-of-Five compounds
Daniel Katz a, Kate Fike a, Justin Longenberger a, Steve Placko a, Laurence Philippe-Venec b,∗,
Andrew Chervenak a
a
b
Analiza Inc, 3615 Superior Avenue E, Suite 4407B, Cleveland, OH, 44114-4139, USA
PIC Analytics, P.O. Box 192, Dexter, MI, 48130-1250, USA
a r t i c l e
i n f o
Article history:
Received 13 November 2021
Revised 21 March 2022
Accepted 11 May 2022
Available online 13 May 2022
Keywords:
High performance liquid chromatography
Superficially porous particle
Shake-flask method
Lipophilicity
Beyond-rule-of-5
a b s t r a c t
Lipophilicity can be measured with different methods, such as Shake-Flask or liquid chromatography.
HPLC presents the advantage of overcoming solubility issues and therefore extending the range of
lipophilicity to high values. A specific HPLC method, called ELogD, had been developed 20 years ago on
a C16 -amide stationary phase, enhancing hydrophobic and hydrogen bond interactions to mimic octanolwater partition. The emergence of novel stationary phases and the need for a less complex mobile phase
have led to the development of a new HPLC assay called alphaLogD, applicable to neutral and basic compounds at pH 7.4, that combines superficially porous particles with a high number of equilibriums between solutes and stationary phase, leading to a lower number of isocratic methods to determine the
logk’w at a higher throughput. Statistical studies have been run to successfully evaluate the alphaLogD
method compared to the Shake-Flask method and to allow this lipophilicity measurement into the socalled Beyond-Rule-of-5-molecules space.
© 2022 The Authors. Published by Elsevier B.V.
This is an open access article under the CC BY-NC-ND license
( />
1. Introduction
Lead Discovery is an iteration of optimizations of different parameters, mainly by improving potency through chemical structure
modifications. These modifications are aimed to modulate in vitro
physicochemical properties with the goal of optimizing in vivo
oral bioavailability. Lipophilicity is one of the first physicochemical properties integrated in medicinal chemistry design, as it impacts passive permeability, metabolism, excretion, oral absorption
and toxicity [1–8]. In addition, physical parameters such as solubility, the flexibility of a molecule based on the presence of rotatable bonds and on the ratio of sp3 carbons, the presence of polar
groups, and the presence of Intramolecular Hydrogen Bonding are
related to lipophilicity [9–11]. Finally, lipophilicity is a powerful parameter used to modulate potency via the LipE concept, allowing
the study of the hydrophobic effect of a structural change on both
lipophilicity and potency [12,13].
∗
Corresponding author.
E-mail address: (L. Philippe-Venec).
The importance of lipophilicity on drug design emphasizes the
need for accurate determination of this property. There are multiple in silico tools that are commercially available and customizable
for the determination of lipophilicity. These computational models
can be inaccurate when asked to calculate the lipophilicity of new
entities that are not published, and they require regular training by
introducing these new entities, which can be demanding in terms
of time and computing power.
Different analytical techniques, such as solvent/water partitioning by shake-flask, partitioning in micelles by capillary electrophoresis, and liquid chromatography have been developed and
miniaturized to adapt to the throughput and low amounts of compound available at the early discovery stage [14,15].
Shake-flask is an accurate, quantitative method that evaluates
the amount of compound in each phase and stands as the “gold
standard” in lipophilicity measurements providing lipophilicity values up to 4.5 [16,17]. However, the shake-flask technique still
shows limitations for compounds of high lipophilicity, as most of
the compounds will reside in the upper organic phase with limited quantification in the lower aqueous phase. In addition, low
/>0021-9673/© 2022 The Authors. Published by Elsevier B.V. This is an open access article under the CC BY-NC-ND license ( />
D. Katz, K. Fike, J. Longenberger et al.
Journal of Chromatography A 1674 (2022) 463146
Table 1
ELogD methods.
solubility of highly lipophilic compounds can generate significant
variability in the quantification of a compound and in the final
lipophilicity value. These limitations present a need for more accurate determinations of lipophilicity values, especially for very hydrophobic compounds.
Liquid chromatography on the other hand is a qualitative
method, highlighting hydrophobic interactions with the lipophilic
stationary phase relative to a non-retained entity. As it is less sensitive to solubility, reversed phase HPLC offers an extended range
of lipophilicity values based on retention times mainly related to
compound interactions and conformations in a specific environment [18]. Several conditions have been developed on different
lipophilic supports to try to cover a wider range of lipophilicity
with one unique method but with some limitations on the class of
studied compounds [19–21].
The ELogD method, amenable to neutral and basic compounds
at pH 7.4, involves a C16 lipophilic support with embedded amide
functions for higher efficiency with regard to hydrophobic interactions [22]. This reliable and reproducible assay has been developed
with a complex mobile phase that contains decylamine, a masking agent to reduce secondary interactions of the solute with the
support, 3-morpholinopropane-1-sulfonic acid (MOPS) as an ionpairing agent to ensure the retention of positively charged entities, and octanol to enhance the energy of interactions present in
the octanol/water system. This mobile phase has proven to bedetrimental to the HPLC instrument, with the crystallization of the decylamine over time, and to limit the shelf-life of the stationary
phase with the saturation of the sites of the C16 amide support
coated with MOPS. The need for reproducibility and reliability has
led to the selection of a new generation of stationary phases, such
as Superficially Porous Particle (or SPP) that contains a solid, nonporous silica core covered by a porous shell layer. SPP enhances
the speed of equilibriums between the stationary and the mobile
phases, leading to reduced resistance to mass transfer, minimal
compound diffusion, and higher column efficiency [23]. As a result,
SPP allows the use of smaller particles and higher flow-rates without generating stronger back pressure. This optimized SPP technology combined to C16 lipophilic chains and an embedded amide
function has led to the development of the Express RP-Amide column to generate lipophilicity data of quality similar to ELogD with
significant reproducibility and a less complex mobile phase. Finally, the developed conditions on the Express RP-Amide stationary phase allow for the measurement of high lipophilicity (logP
≥ 5) and open new opportunities to better support the chemical space expansion towards highly lipophilic compounds, so-called
Beyond-Rule-of-5 molecules.
Method range
ELogDoct range
Flow-rate (mL/min)
% MeOH
Low
Middle
High
<1
1–3
>3
0.5
1
2
15,20,25
40,45,50
60,65,70
2.2. Material for alphaLogD method
The alphaLogD HPLC method uses the Express RP-amide (Supelco), 2.7 μm particle size, 50 mm x 4.6 mm.
The mobile phase contains Ammonium Acetate CH3 CO2 NH4
HPLC grade (EMD Millipore), Ammonium Hydroxide (Fisher), 1Octanol CH3 (CH2 )7 OH (Purity ≥ 99% Fisher), Optima HPLC grade
water (Fisher), Optima HPLC grade Methyl alcohol (Fisher).
The aqueous phase is prepared by adding 0.05% v/v of octanol
to water, and ammonium acetate at a concentration of 50 mM. The
pH is adjusted to pH7.4 with the addition of ammonium hydroxide.
The organic phase contains 0.25% v/v of octanol in methyl alcohol.
2.3. Sample preparation
All standards used to build the calibration curves are from
Sigma-Aldrich with purity ≥ 98% and are described in Table 3. The
standards are dissolved in DMSO (USP, Spectrum) at a concentration of 10 mM and are diluted down to 1 mM with either DMSO
or a mixture of water/methanol 50/50 v/v.
2.4. Instrumentation and software
The HPLC instrument is an Agilent 1100 piloted by Chemstation
Software (Version C.01.06) equipped with a quaternary HPLC pump
(Model G1311A) with a micro vacuum degasser (model G1322A), a
micro-well plate autosampler WPALS (Model G1367A) with an injection loop of 20 μL, a Column thermostatic column compartment
(Model G1330B), and a UV Diode Array Detector (Model G1315B).
The temperatures of column compartment and autosampler are
both maintained at 23 °C.
Statistical Analyses: Linear regressions, ANOVAs, parallel lines
analysis, and Bland-Altman plots were generated using SigmaPlot
version 14.5, from Systat Software, Inc., San Jose California USA,
(www.systatsoftware.com).
2.5. Methodology applied for lipophilicity measurement
2.5.1. ElogD methodology [22]
The ElogD methodology is described with a set of three ranges
of isocratic methods, listed in Table 1 Each range of methods is
related to the lipophilicity range, that is primary estimated by insilico calculation tools before any experimental measurement. An
extrapolation to 0% of methanol is then performed from each of
the method set and the ELogD(octanol /water) is calculated with a calibration curve built on standards of known lipophilicity.
2. Material and methods
2.1. Material for ELogD method [22]
The ELogD HPLC method uses the Supelcosil LC-ABZ (RP-amide)
column (Supelco), 5 μm particle size, 50 mm x 4.6 mm.
The mobile phase contains decylamine CH3 (CH2 )9 NH2 (CAS
2016–57–1, from TCI, purity > 98%), 3-morpholinopropane-1sulfonic Acid (MOPS) C7 H15 NO4 S (CAS 1132–62–1, from J.T. Baker,
purity ≥ 99.5%), Sodium Hydroxide (Purity > 99%), 1-Octanol
CH3 (CH2 )7 OH (Purity ≥ 99% Fisher), Optima HPLC grade water
(Fisher), Optima HPLC grade Methyl alcohol (Fisher).
The aqueous phase is prepared by adding 0.05% v/v of octanol
to water, 0.15% v/v N decylamine, 20 mM of MOPS, and the pH is
adjusted to 7.4 with the ammonium hydroxide.
The organic phase contains 0.25% v/v of octanol in methyl alcohol.
2.5.2. AlphaLogD methodology
Comparative studies run by Carrupt [21] between gradient and
isocratic mobile phases using methanol as organic solvent have
confirmed that optimal results are obtained in isocratic mode at
similar flow-rate, and specifically for compounds of high lipophilicity.
The lipophilicity measurements are therefore run with isocratic
methods at different contents of organic solvent for a further extrapolation to 0% of methanol from each of the method sets, and
2
D. Katz, K. Fike, J. Longenberger et al.
Journal of Chromatography A 1674 (2022) 463146
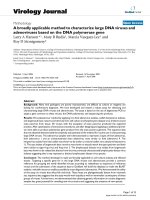
Fig. 1. Alphalogd decision tree.
the alphaLogD at pH7.4 is calculated with a calibration curve built
on standards of known lipophilicity in octanol/water.
Each isocratic method is built with the pumping system programmed to deliver constant volumes of each aqueous and organic
solvent, and is delivered at 2 mL/min.
Each compound is analyzed following a logical approach based
on its retention time for a given method, as described in the decision tree in Fig. 1.
A scout method at 45% of methanol is first applied for a total run time of 8 min, regardless of any predicted or calculated
lipophilicity.
•
•
•
3. Theory and calculations
Lipophilicity models by Reversed-Phase Liquid Chromatography
have been proven to be indirectly related to the Shake-Flask model
where the compound partition between octanol and water logKOW
is driven by an ensemble of diverse types of interactions, as described by the Linear Solvation Energy Relationship, LSER established by Abraham [24] defined by Eq. (1):
Any compound with a retention time below or at 5 min is
then injected in two additional isocratic methods, the 40% of
methanol method for a total run time of 10 min, and the 30%
of methanol method for a maximum run time of 15 min. The
set of these three isocratic methods constitutes the so-called
the “low range” and is applied for compounds of measured
lipophilicity below 4.
Any compound with a retention time higher than 5 min in the
scout method is injected in three different isocratic methods,
with a higher content of organic solvent, the 60% of methanol
method for a run time of 8 min, the 65% of methanol method
for a run time of 5 min, and the 75% of methanol method
for a run time of 3 min. This set of three methods represents the “high range” applied for compounds with a measured
lipophilicity equal to and above 4.
LogKow = c + eE + sS + aA + bB + νV
(1)
Each specific intermolecular interaction is represented by the
product of solute descriptor with the complementary system constant related to the solute. These solute descriptors respectively
highlight the excess molar refraction E, the polarizability S, the effective hydrogen-bond acidity A, the effective hydrogen-bond basicity B, and the McGowan’s characteristic volume V. The constants
stand for the system contributions related to the solute, such as e
for the capacity of the system to interact with the electron lone
pair interactions, s for the ability to form dipole-dipole interactions with the solute, a and b for the capacity of forming hydrogen bonds, v for the ability of the solute to create cavities through
cohesion and dispersion interactions in each phase, and c being
a system constant. Parallel to the Shake-Flask partition, the LSER
model can be applied to a reverse-phase liquid chromatographic
system with each intermolecular interaction contributing to the retention of the solute. In both cases, each system constant is calculated with multiple linear regression analyses for a selected group
of solutes with known descriptors. The resulting logk’ is the qualitative and quantitative description of the intermolecular interactions in the partition process between octanol and water or in the
The optional use of a “scout gradient” from 5% to 95% of organic phase in 20 min at a flow-rate of 2 mL/min can be applied
instead of the “Scout isocratic method” to ensure the total elution
of compounds of high lipophilicity.
•
Compound eluted in the gradient at the retention time higher
than 11 min is studied in the high range of isocratic methods
at 60%, 65% and 70% of methanol.
Compound eluted in this gradient at a retention time below or
at 11 min is then injected in the “low range” of isocratic methods at 30%, 40% and 45% of methanol.
3
D. Katz, K. Fike, J. Longenberger et al.
Journal of Chromatography A 1674 (2022) 463146
Table 2
Comparison of system constants of LC-ABZ and Express RP-Amide stationary phases with system constants of octanol-water partition.
Separation system
Separation constants
ν
Octanol-water [26]
Supelcosil LC-ABZa [26]
Express RP-Amideb [27]
Express RP-Amidec [28]
Ascentis C18 d [28]
a
b
c
d
Applying the theory regarding retention of a solute in a chromatographic system and based on our previous knowledge of
chromatographic lipophilicity determination on LC-ABZ stationary
phase, we are developing a new methodology on the embedded
C16 -amide column Express RP-Amide with Superficially Porous Particle to generate alphaLogD on neutral and basic compounds.
3.81
3.48
4.15
2.23
2.30
e/ν
0.15
0.12
0.09
0.07
0.12
s/ν
−0.28
−0.27
−0.23
−0.17
−0.32
a/ν
0.01
−0.01
−0.03
0.03
−0.11
b/ν
−0.9
−0.89
−0.84
−1.12
−0.91
4. Results and discussion
4.1. Linear solvent strength model
Supelcosil LC-ABZ system:
● Embedded RP –Amide stationary phase, coated with octanol,
● Mobile phase: 20 mM MOPS pH 7.4 saturated with octanol –15% to
70% of methanol containing 0.25% v/v octanol.
Express RP-amide:
● Embedded RP-Amide stationary phase,
● Mobile Phase:20 mM Sodium Phosphate buffer pH 7 saturated with
octanol– isocratic methods from 40 to 55% of Methanol.
Expresss RP-amide:
● Embedded RP-Amide stationary phase,
● Mobile Phase:20 mM Sodium Phosphate buffer pH 2– isocratic
method 75/25% of acetonitrile.
Ascentis C18 :
● Mobile Phase:20 mM Sodium Phosphate buffer pH 2– isocratic
method 75/25% of acetonitrile.
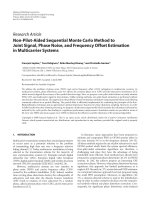
The LSS concept has been validated through the interactions of
tetracaine of known lipophilicity of 2.29 and eluted on the Express
RP-Amide column with isocratic mobile phases containing 50 mM
Ammonium Acetate adjusted to pH 7.4 with ammonium hydroxide, and 0.05% v/v octanol for the aqueous phase and 0.25% v/v octanol in methanol for the organic phase. Seven isocratic methods
containing respectively 20%, 30%, 40%, 45%, 60%, 65%, and 75% of
organic content have been screened and the logk’ of tetracaine is
reported as a linear function of the organic solvent strength Fig. 2),
confirming the use of Eqs. (2) and ((3) for the respective determination of logk’w and the final LogD for charged entities or LogP for
neutral ones.
With a pKa measured at 8.78, the basic tetracaine is partially
ionized in the mobile phase at pH 7.4 and, in addition to the hydrophobic interactions with the lipophilic chains of the stationary
phase, the presence of the hydrogen donor contributes to the retention of the compound based on its interactions with the carbonyl group of the amide function of the stationary phase [26]. The
disruption of the linearity of the regression, however not always
reproducible, could be interpreted as hydrogen bonding within the
system [amide support/mainly aqueous mobile phase/solute] in the
zone between 20% and 45% of methanol. On the other side, the
polarization of the stationary phase in presence of increasing content of methanol, as well as increased hydrophobic interactions of
lipophilic compounds with the C16 chains of the support explains
the second part of the curve, from 45% to 75% of methanol.
equilibrium of the solute between the mobile phase and the stationary phase in a liquid chromatographic system [25].
A comparative study of LSER system constants calculated from
the octanol-water partition and from two chromatographic systems
involving the Supelcosil LC-ABZ and the Express RP-Amide stationary phases, respectively, highlights the similarities of the interactions of the two chromatographic processes with the octanol-water
system in the lipophilicity determination[26–28] (Table 2, Rows (a)
and (b)). The magnitude of each system constant is related to the
importance of the interactions in the partition or retention process,
and the positive or negative sign is indicative of the interactions
with either the stationary phase or the mobile phase in the chromatographic system. The interactions study on the RP amide support emphasizes the positive contribution of the Hydrogen Bond
Acidity (or Hydrogen Bond donor) of the solute with the stationary phase compared to the C18 support (Table 2, Rows (c) and (d)),
with the amide phase being weakly basic compared to the other
embedded phases [28].
The compared ratios of the system constant between the RPamide chromatographic system and the Octanol-Water partition
are nearly identical and therefore a correlation model can be built
between partition and retention, defined by Eq. (2) [26]
logKow or logP = p + qlogk
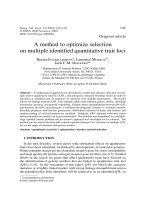
4.2. Choice of standards
The main goal of the study is to create a linear model between
the distribution in an interaction-based system, such as Reversed
Phase Liquid Chromatography, and the partition between two nonmiscible liquid phases, such as octanol-water, for compounds of
known diverse lipophilicities. The choice of the standards is based
on the potential combination of least one hydrogen donor at the
studied pH and of lipophilic chains to create interactions with
the RP-Amide stationary phase that will result in different retention times. The selected standards, mainly basic, have an extended
range of measured pKa leading to the presence of neutral and ionized forms in the mobile phase at pH 7.4 (Table 3). A set of 20
standards on a lipophilicity range from −1 to 6, described in the
literature, are selected (Fig. 3) and studied in the Express RP-Amide
system.
(2)
logKow = partition coefficient between octanol and water = Lipophilicity. logk’ = solute retention between stationary
phase and mobile phase in a reversed-phase liquid chromatography system. p and q = linear regression coefficients.
The solute retention logk’ on the stationary phase is directly related to its interactions between the stationary phase and the mobile phase and is expressed as the capacity factor.
A change in the mobile phase composition will induce a change
in the retention time, and we can apply the Snyder Linear Solvent Strength model (LSS) to assume a direct linear relationship
between the solute retention and a binary mobile phase composition, as shown in Eq. (3):
logk = logk w − S
4.3. Correlation model between partition and retention
Each solution of standard, initially dissolved in DMSO, is diluted
down to 1 mM in either 50/50 v/v or 25/75 v/v water/methanol
mixture. The DMSO present in the injected solution is used as the
void volume marker and its corresponding retention time (t0 ) is
included in the calculation of logk’. The tetracaine is injected and
eluted in each isocratic method from 20% to 75% of methyl alcohol.
Based on their known lipophilicity, the standards of lipophilicity
below 4 are injected in the low ranges of methanol from 20% to
45%, and those compounds with lipophilicity above 4 are injected
(3)
logk’w = extrapolated value of logk’ at 100% of water.
S = Solute dependent solvent strength parameter.
= ratio of organic modifier in the mobile phase of the chromatographic system.
4
D. Katz, K. Fike, J. Longenberger et al.
Journal of Chromatography A 1674 (2022) 463146
Fig. 2. Correlation of retention time of tetracaine with content of methyl alcohol in the mobile phase on 3 different calibration curves captured at different times.
Table 3
Standards used for the calibration curve of alphaLogD.
∗
Compound
CAS no
MW
# H donor
pKa
Procainamide
Allopurinol
Acebutolol
Metrodinazole
Antipyrine
Acetaminophen
Alprenolol
Triamterene
Hydrocortisone
Quinidine
Tetracaine
Omeprazole
Imipramine
Clozapine
Triflupromazine
Bifonazole
Diethylstilbesterol
Clotrimazole
Tolnaftate
Amiodarone
51–06–9
315–30–0
37,517–30–9
443–48–1
60–80–0
103–90–2
13,655–52–2
396–01–0
50–23–7
56–54–2
94–24–6
73,590–58–6
50–49–7
5786–21–0
146–54–3
60,628–96–8
56–53–1
23,593–75–1
2398–96–1
1951–25–3
235.3
136.1
333.4
171.5
188.2
151.2
249.3
253.3
362.5
324.4
264.4
345.4
280.4
326.8
352.4
310.4
268.3
344.8
307.4
645.3
2
2
3
1
0
2
2
3
3
1
1
1
1
1
1
0
2
0
0
1
2.739.42
9.20
9.70
2.49
< 1.7
9.38
9.72
6.39
> 12
4.368.69
1.938.78
6.349.07
9.68
4.107.94
9.39
6.28
9.77
5.99
< 1.2
7.85
∗
measured
Literature logD[20]
−0.91
−0.44
−0.29
−0.02
0.38
0.51
0.97
1.21
1.55
2.04
2.29
2.30
2.40
3.13
3.61
4.77
5.07
5.20
5.40
6.10
ELogD [20]
AlphaLogD
−0.72
−0.06
−0.53
0.08
0.29
0.31
0.59
1.14
1.57
1.61
2.49
2.03
2.53
3.60
3.69
5.24
4.95
4.91
5.46
6.33
−0.98
−0.86
0.27
−0.31
0.02
0.10
1.53
1.01
1.29
1.93
2.75
2.22
2.73
3.48
3.85
4.90
4.83
4.67
5.25
6.42
pKa measured by Capillary Electrophoresis.
Table 4
Linear regression of the 3 calibration curves.
Regression
df
R2
Standard Error of Estimate
Analysis of Variance
Calibration 1
Calibration 2
Calibration 3
y = 1.0279x + 0.3989
20
0.970
0.388
F = 573.282P < 0.001
y = 0.9804x + 0.515
20
0.976
0.329
F = 802.633P < 0.001
y = 1.0105x + 0.4375
20
0.976
0.345
F = 729.403P < 0.001
Power of performed test with alpha = 0.050.
in the high ranges of methanol from 60% to 75%. Each solution is
injected 3 times, and three different lots of Express RP-Amide stationary phase are being tested.
All the chromatographic conditions are similar to the ones applied for the study of tetracaine. The logk’w of each compound is
calculated with Eq. (3) from a curve built with at least three different solvents strengths.
Each linear regression and analysis of variance (ANOVA) statistics are reported in Table 4. The equality of the three linear regressions is shown as pair-wise comparisons tests for parallel lines,
which includes tests for equality of slopes and intercepts, reported
in Table 5. The slopes and y intercepts of the three curves are not
significantly different, so they can be pooled to build one average
calibration curve with the LogD in octanol as a direct function of
the retention of each studied standard on the Express RP-Amide
5
D. Katz, K. Fike, J. Longenberger et al.
Journal of Chromatography A 1674 (2022) 463146
Fig. 3. Structures of 20 standards selected for the development of alphaLogD method.
Table 5
Pair-wise comparison tests for equality of slopes and Intercepts.
Test for Equality of Slopes
Test for Equality of Intercepts
Between Curve 1 and Curve 2
Between Curve 2 and Curve 3
Between Curve 3 and Curve 1
F = 0.7490P = 0.3925
F = 0.0728P = 0.7889
F = 0.3495P = 0.5581
F = 0.0489P = 0.8262
F = 0.0938P = 0.7612
F = 0.0039P = 0.9507
stationary phase (4):
LogDoct7.4 = 1.009(±0.022 )logk wExpress + 0.435(±0.06 )
Flask) systems. The slope value close to one implies similarity of
these energies between the two systems and indicates a good correlation between the octanol-water partitioning system and the
chromatographic interactions of the solute with the mobile phase
and with the RP-amide stationary phase. The intercept highlights
the presence of secondary interactions in the chromatographic system, despite the embedded amide function and the presence of octanol that is supposed to reduce the hydrogen bond interactions of
(4)
4.4. Discussion on the alphaLogD method
4.4.1. Interpretation of interactions on the express RP-Amide phase
The slope of the Eq. (4) highlights differences of energies and
forces, between the distribution (HPLC) and the partition (Shake6
D. Katz, K. Fike, J. Longenberger et al.
Journal of Chromatography A 1674 (2022) 463146
Fig. 4. Correlation of logk’w Express RP-Amide with logk’w LC-ABZ-Discovery on standard compounds.
explain why the embedded RP-amide phase is considered more retentive than a regular C18 support [28].
4.4.2. Positive effect of fused-core particle
The Express RP Amide support is made of purified 2.7–μm superficially porous silica particles that are constituted of 1.7-μm
solid silica cores and 0.5-μm thick shells of 9 nm pores which have
been developed to allow highly efficient and fast separations, supporting high flow-rates while generating low back pressure [31].
The structure of the superficially porous particles induces a reduction of the longitudinal diffusion by 20 to 30%, as now 20%
of the column volume is occupied by non-porous silica thereby
preventing the solute from axial diffusion. In addition, the thin
layer of porous particles reduces eddy dispersion inducing a quick
mass transfer of the solute in the chromatographic system leading
to shorter retention times, sharper peaks and higher column efficiency compared to classic regular porous silica. Fused core particles enhance the linearity of the LSS model over the range of isocratic methods in the high range of polar organic content, as the
low back pressure reduces the electric field that is usually created
by the alignment of mobile phase dipoles at high pressure and that
is responsible for the increase in retention times [32].
Fig. 5. Plot of the differences between alphaLogD method and Literature LogD.
the residual silanols of the stationary phase with the solute [29].
One could argue that the presence of decylamine (used on ELogD system) would reduce these interactions, as the intercept on
the ElogD calibration is slightly lower than the one on the Express RP-Amide (0.21 for ABZ-Discovery and 0.45 for Express RPAmide), but the influence of these secondary interactions on the
final lipophilicity values obtained on alphaLogD is not significant
enough to justify the use of a reagent that is significantly detrimental to the robustness of the entire HPLC system due to recrystallization of the decylamine in the aqueous phase over time.
The chromatographic distribution process of the solute between
the mobile phase and the stationary phase seems to be enhanced
by two main types of interactions. In the low lipophilicity range,
the retention is mainly governed by the hydrogen bonding interactions between the solutes that have hydrogen bond donors and
the amide function of the stationary phase that is hydrogen bond
acceptor due to the presence of the carbonyl group. It has been
described that polar embedded stationary phase can enhance the
retention of polar compounds in Reversed phase HPLC even with
a high ratio of aqueous phase promoting high retention of phenols
[28,30].
In the high lipophilicity range, the hydrophobic interactions
represent an additional contribution to the solute retention and
4.4.3. Ammonium acetate versus MOPS
Ion-pairing chromatography is a very powerful technique to
separate entities based on their ionized forms, as the ion-pairing
agent creates a layer over the hydrophobic surface to add a second
dimension to the retention of the solute by creating a complex that
is simultaneously dissociated in the aqueous phase. The lipophilicity measurement on the ABZ-Discovery is completed in the presence of Morpholino Propane Sulfonic acid (MOPS) for positively
charged entities. The Express RP-Amide chromatographic system
works in the absence of MOPS and only contains the ammonium
acetate at a concentration of 50 mM that could be enough to “ionize” the upper layer of the stationary phase.
A comparison of logk’w of the same compounds on both ABZ
Discovery and Express RP-Amide stationary phases shows a good
correlation between the two systems (Eq. (5)):
Logk w (ABZ − Discovery )
= 0.9257 logk w (Express RP − Amide ) + 0.296
7
(5)
D. Katz, K. Fike, J. Longenberger et al.
Journal of Chromatography A 1674 (2022) 463146
Fig. 6. Structure of “Beyond Rule of 5 molecules used as calibration standards.
Table 6
Calculated and measured properties of “Beyond rule of 5 molecules.
Telaprevir
Atazanavir
Ritonavir
Tacrolimus
Everolimus
Temsirolimus
Zotarolimus
Ledipasvir
∗
∗∗
MW (g/mol)
Rotatable
Bounds
˚
TPSA (A)
# Hydrogen
donors
Out of
compliance Ro5
Measured pKa
Calc LogP (ACD)
ELogP [32]
alphaLogP∗∗
679.8
704.9
720.9
804
958.2
1030
966.2
889
14
18
18
7
9
7
7
12
180
171
202
or178
205
242
219
175
4
5
4
3
3
4
2
4
2
4
3
2
2
2
2
3
11.84
4.29
1.92
3.30∗ 9.90
10.40∗
9.96
9.81
4.32
3.93
5.20
5.28
3.96
3.35
2.96
3.55
6.77
4.4
4.7
4.9
6.1
6.7
6.9
N/A
N/A
4.48
4.81
5.09
N/A
6.8
7.00
6.59
6.99
ACD calculated pKa.
Calculated with global calibration curve.
There is a similar retention of positive entities in the presence
of ammonium acetate on the fused-core support compared to the
presence of MOPS on the porous ABZ-Discovery support, despite
the different hydrophobicity between these two entities. It can be
explained by the high rate of exchanges on the fused core support
between the ion-pair that is formed with the positive form of the
solutes and the acetate counter-ion and the dissociated forms in
the mobile phase. The low hydrophobicity of the acetate counterion does not hide as much as the MOPS the embedded amide function of the support. It therefore enhances the retention of entities
that have a significant number of hydrogen donors, such as the
positively charge entities of the acebutolol and alprenolol that have
respectively 3 and 2 hydrogen donors in their ionized state (Fig. 4).
It is important to highlight the use of ammonium acetate buffer
to control the pH. It significantly simplifies the composition of the
mobile phase and ensures a higher stability of the chromatographic
system, a longer shelf-life of the column and the option of coupling
a mass spectrometer detector for added value to the lipophilicity
determination [21].
4.4.4. Evaluation of alphaLogD measurement against literature values
A further evaluation of the alphaLogD method against the
Shake-Flask method is run on the residuals between alphaLogD
and Literature LogD values with the Bland Altman analysis. The
Normality test of Shapiro-Wilk shows a normal distribution of differences between alphaLogD and literature LogD values. The Bland
8
D. Katz, K. Fike, J. Longenberger et al.
Journal of Chromatography A 1674 (2022) 463146
lected based on calculated properties that do not comply with the
Lipinski Rule of 5 (Table 6), with at least 2 out-of-compliance rules
out of 5 [33]. The applied chromatographic conditions are similar
to the ones used for the small molecules with the use of isocratic
methods in the high range of methanol due to the high predicted
lipophilicity.
The difficulty of this specific study does not reside in the choice
of the Beyond Rule of 5 standards nor in the measurement of the
lipophilicity by chromatography but in finding lipophilicity data in
literature that can correlate to the experimental logk’w . With predicted high lipophilicity and resulting low solubility, most of these
Beyond Rule of 5 compounds are not measurable by the shakeflask method. The calculated values don’t always integrate the 3D
aspect, as for the macrocycles (Fig. 6), and the values of reference
we use for this study are chromatographic data measured on the
ELogD system [34].
The correlation of logk’w (Express RP-Amide) with ELogP (as all
the species are neutral at pH 7.4) on the compounds presents excellent similarities of energies of interactions between the two systems as shown in Fig. 7 and, as a result, we can build a calibration
curve including small and large molecules (Fig. 8).
Fig. 7. Correlation logk’w Express RP-Amide with literature ELogP [32].
Altman Analysis (Fig. 5) indicates that the alphaLogD values are on
average 0.0045 lower than the literature values. In addition, the
study of agreement limits leads to the conclusion that 95% of the
alphaLogD measurements fall between +0.6989 and – 0.7079 of
the literature values.
These results show that the alphaLogD method is comparable
to the Shake-Flask method. The range of alphaLogD might appear wide when compared to the Shake-Flask. It is important to
remember that the Shake-Flask method is highly dependent on
compound solubility in both the aqueous and organic phases, and
that could induce significant variability in the extreme ranges of
lipophilicity.
4.6. Application on research compounds: comparison of lipophilicity
measurements from ELogD and alphaLogD methods
Following the methodology of first applying the scout method
at 45% of methanol, which places the compounds into the appropriate low or high range, the final alphalogD method was tested
on a pool of 324 research compounds of unknown structures and
ionization stages and is compared on the ElogD method (Fig. 9).
The analysis of alphaLogD data compared to the ELogD data
shows a general good correlation between the two methods in the
low lipophilicity range as well as in the high range.
The systematic application of the rule for compounds that
elute below 5 min in the scout method are directed to the “low
range” set of methods, allows a quick and reliable determination of
lipophilicity up to 4. Conversely, the study of compounds in the set
of “high range” when they elute above 5 min in the scout method,
allows the determination of high lipophilicity values above 4.
The outliers can be explained by the initial mis-prediction of
the LogD that triggers the choice of inappropriate set of methods
4.5. Lipophilicity measurement of beyond rule of 5 compounds
The quick exchanges enhanced by Semi-Porous Particles between solute and stationary phase, added to the exceptional mass
transfer enabled by the Fused-core particles lead to high efficiency
of compound elution and result in sharp peaks, allowing study
of entities highly retained on lipophilic support [31]. The chromatographic system developed with the Express RP-Amide is then
tested on the so called Beyond Rule of 5 molecules that are se-
Fig. 8. Calibration curve for alphaLogD determination including small and large molecules.
9
D. Katz, K. Fike, J. Longenberger et al.
Journal of Chromatography A 1674 (2022) 463146
Fig. 9. Research compounds lipophilicity measurement with alphaLogD versus ELogD.
for ELogD versus the alphaLogD methodology, where the choice of
method is uniquely based on a compound’s interactions with the
support at 45% of methanol.
methodology, data curation, reviewing and editing, project administration and supervising.
Declaration of Competing Interest
5. Conclusion
The authors declare that they have no known competing financial interests or personal relationships that could have appeared to
influence the work reported in this paper.
The HPLC alphaLogD method has been successfully developed
to ensure a sustainable and reliable determination of lipophilicity by introducing the advantageous SPP support, allowing higher
flow-rate and reducing analysis time. The method optimization has
led to a less complex system than ELogD, by removing reagents
like N-decylamine and MOPS, that have a detrimental effect on the
stationary phase and equipment in a very short term. Keeping the
approach of determining the logk’w with isocratic methods at different contents of methanol, the alphaLogD methodology doesn’t
rely on predicted lipophilicity values to drive the selection of different ranges of isocratic methods, but is based on interactions of
the compounds with the support at the given amount of 45% of
organic solvent. The retention time in this 45% scout method will
then help assign the range of isocratic methods to be applied for
the lipophilicity determination. An initial gradient can also be applied to ensure the total elution of highly lipophilic compounds
and confirm the choice of high range of isocratic methods for
the further lipophilicity determination.This methodology presents
the advantage of selecting the most appropriate range of mobile
phases for a compound of interest, which significantly increases
the throughput of analysis by 40%. The wide range of measured
lipophilicity values from −1 to 7 with the alphalogD assay represents a reliable tool to design a series of compounds with data
delivered with a single assay.
Finally, the use of hyphenated HPLC to Mass Spectrometry is
now made possible by the absence of MOPS and phosphate buffer
in the mobile phase, and provides the opportunity for higher
throughput by studying a mixture of compounds of potential different lipophilicities, as well as providing higher integrity data by
identifying the main compound from any potential impurity.
Acknowledgments
We thank Aimee Kestranek and Kate Favre for their constant
support and for allocating time to the team to run the method development and optimization.
We thank Wendy Roe and Cory Muraco for Millipore Sigma for
giving us access to a free Superficially Porous Particle Express RPAmide column to allow us starting the alphaLogD method development and optimization.
References
[1] X. Liu, B. Testa, A. Fahr, Lipophilicity and its relationship with passive drug
permeation, Pharm. Res. 28 (2011) 962–977, doi:10.1007/s11095-010-0303-7.
[2] M.J. Waring, Lipophilicity in drug discovery, Expert Opin Drug Discov 5 (2010)
235–248, doi:10.1517/17460441003605098.
[3] M.V.S. Varma, B. Feng, R.S. Obach, M.D. Troutman, J. Chupka, H.R. Miller, A. ElKattan, Physicochemical determinants of human renal clearance, J. Med. Chem.
52 (2009) 4844–4852, doi:10.1021/jm900403j.
[4] T.W. Johnson, K.R. Dress, M. Edwards, Using the Golden Triangle to optimize
clearance and oral absorption, Bioorganic and Medicinal Chemistry Letters 19
(2009) 5560–5564, doi:10.1016/j.bmcl.2009.08.045.
[5] Y. Henchoz, B. Bard, D. Guillarme, P.A. Carrupt, J.L. Veuthey, S. Martel, Analytical tools for the physicochemical profiling of drug candidates to predict
absorption/distribution, Anal Bioanal Chem 394 (2009) 707–729, doi:10.1007/
s0 0216-0 09-2634-y.
[6] V.H. Thomas, S. Bhattachar, L. Hitchingham, P. Zocharski, M. Naath, N. Surendran, C.L. Stoner, A. El-Kattan, The road map to oral bioavailability: an industrial perspective, Expert Opinion on Drug Metabolism and Toxicology 2 (2006)
591–608, doi:10.1517/17425255.2.4.591.
[7] M.J. Waring, C. Johnstone, A quantitative assessment of hERG liability as a
function of lipophilicity, Bioorg. Med. Chem. Lett. 17 (2007) 1759–1764, doi:10.
1016/j.bmcl.2006.12.061.
[8] D.A. Price, J. Blagg, L. Jones, N. Greene, T. Wager, Physicochemical drug
properties associated with in vivo toxicological outcomes: a review, Expert
Opinion on Drug Metabolism and Toxicology 5 (2009) 921–931, doi:10.1517/
17425250903042318.
[9] C.A. Lipinski, F. Lombardo, B.W. Dominy, P.J. Feeney, Experimental and computational approaches to estimate solubility and permeability in drug discovery
and development settings, Adv. Drug Deliv. Rev. 64 (2012) 4–17, doi:10.1016/j.
addr.2012.09.019.
[10] T. Rezai, J.E. Bock, M. v Zhou, C. Kalyanaraman, R.S. Lokey, M.P. Jacobson,
Conformational Flexibility, Internal Hydrogen Bonding, and Passive Membrane
Credit author statement
Dan Katz: Investigation, Methodology, validation, data curation,
reviewing and editing. Kate Fike: Data curation, Formal analysis (statistical), reviewing and editing, Steve Placko: Data curation, reviewing and editing. Justin Longenberger: Data curation,
reviewing and editing. Laurence Philippe-Venec: Conceptualization, writing-original draft. Andrew Chervenak: Conceptualization,
10
D. Katz, K. Fike, J. Longenberger et al.
[11]
[12]
[13]
[14]
[15]
[16]
[17]
[18]
[19]
[20]
[21]
[22]
Journal of Chromatography A 1674 (2022) 463146
Permeability: Successful in Silico Prediction of the Relative Permeabilities
of Cyclic Peptides, J. Am. Chem. Soc. 128 (2006) 14073–14080, doi:10.1021/
ja063076p.
G. Caron, M. Vallaro, G. Ermondi, Log P as a tool in intramolecular hydrogen bond considerations, Drug Discovery Today: technologies. 27 (2018) 65–70.
/>K.D. Freeman-Cook, R.L. Hoffman, T.W. Johnson, Lipophilic efficiency: the most
important efficiency metric in medicinal chemistry, Future Med Chem 5 (2013)
113–115, doi:10.4155/fmc.12.208.
T.W. Johnson, R.A. Gallego, M.P. Edwards, Lipophilic Efficiency as an Important
Metric in Drug Design, J. Med. Chem. 61 (2018) 6401–6420, doi:10.1021/acs.
jmedchem.8b0 0 077.
M.D. Trone, M.S. Leonard, M.G. Khaledi, Congeneric Behavior in Estimations of
Octanol−Water Partition Coefficients by Micellar Electrokinetic Chromatography, Anal. Chem. 72 (20 0 0) 1228–1235, doi:10.1021/ac990852l.
C. Giaginis, A. Tsantili-Kakoulidou, Current State of the Art in HPLC Methodology for Lipophilicity Assessment of Basic Drugs, A Review, Journal of Liquid Chromatography \& Related Technologies. 31 (2007) 79–96, doi:10.1080/
10826070701665626.
D. Lu, P. Chambers, P. Wipf, X.-.Q. Xie, D. Englert, S. Weber, Lipophilicity
screening of novel drug-like compounds and comparison to clogP, Journal of
Chromatography A (2012) 1258, doi:10.1016/j.chroma.2012.07.078.
M.C. Wenlock, T. Potter, P. Barton, R.P. Austin, A Method for Measuring the
Lipophilicity of Compounds in Mixtures of 10, J Biomol Screen 16 (2011),
doi:10.1177/1087057110396372.
B. Zheng, L.M. West, ESTIMATING THE LIPOPHILICITY OF NATURAL PRODUCTS USING A POLYMERIC REVERSED PHASE HPLC METHOD, Journal of Liquid Chromatography \& Related Technologies. 33 (2009) 118–132, doi:10.1080/
10826070903430464.
L. Grumetto, C. Carpentiero, P. di Vaio, F. Frecentese, F. Barbato, Lipophilic and
polar interaction forces between acidic drugs and membrane phospholipids
encoded in IAM-HPLC indexes: their role in membrane partition and relationships with BBB permeation data, J Pharm Biomed Anal 75 (2013) 165–172,
doi:10.1016/j.jpba.2012.11.034.
A. Guillot, Y. Henchoz, C. Moccand, D. Guillarme, J.L. Veuthey, P.A. Carrupt,
S. Martel, Lipophilicity determination of highly lipophilic compounds by liquid chromatography, Chemistry and Biodiversity 6 (2009) 1828–1836, doi:10.
10 02/cbdv.20 090 0115.
P.A. Carrupt, D. Guillarme, S. Martel, S. Rudaz, J.L. Veuthey, Y. Henchoz, Fast log
P determination by ultra-high-pressure liquid chromatography coupled with
UV and mass spectrometry detections, Anal Bioanal Chem 394 (2009) 1919–
1930, doi:10.10 07/s0 0216-0 09-2862-1.
F. Lombardo, M.Y. Shalaeva, K.A. Tupper, F. Gao, ElogDoct: a tool for lipophilicity determination in drug discovery. 2. Basic and neutral compounds, J. Med.
Chem. 44 (2001) 2490–2497, doi:10.1021/jm0100990.
[23] S. Fekete, E. Oláh, J. Fekete, Fast liquid chromatography: the domination of
core-shell and very fine particles, Journal of Chromatography A 1228 (2012)
57–71, doi:10.1016/j.chroma.2011.09.050.
[24] M.J. Kamlet, R.M. Doherty, M.H. Abraham, Y. Marcus, R.W. Taft, Linear solvation energy relationships. 46. An improved equation for correlation and prediction of octanol/water partition coefficients of organic nonelectrolytes (Including strong hydrogen bond donor solutes), Journal of Physical Chemistry 92
(1988) 5244–5255, doi:10.1021/j100329a035.
[25] A. Pagliara, E. Khamis, A. Trinh, P.A. Carrupt, R.S. Tsai, B. Testa, Structural properties governing retention mechanisms on rp-hplc stationary phases used for
lipophilicity measurements, J. Liq. Chromatogr. 18 (1995) 1721–1745, doi:10.
1080/10826079508010 0 02.
[26] N.C. Dias, M.I. Nawas, C.F. Poole, Evaluation of a reversed-phase column (Supelcosil LC-ABZ) under isocratic and gradient elution conditions for estimating
octanol-water partition coefficients, Analyst 128 (2003) 427–433, doi:10.1039/
b300574g.
[27] D. Benhaim, E. Grushka, Characterization of Ascentis RP-Amide column:
lipophilicity measurement and linear solvation energy relationships, Journal of
Chromatography A 1217 (2010) 65–74, doi:10.1016/j.chroma.2009.11.013.
[28] N.S. Wilson, J. Gilroy, J.W. Dolan, L.R. Snyder, Column selectivity in reversedphase liquid chromatography: VI. Columns with embedded or end-capping polar groups, Journal of Chromatography A 1026 (2004) 91–100, doi:10.1016/j.
chroma.2003.11.041.
[29] C. Giaginis, S. Theocharis, A. Tsantili-Kakoulidou, Octanol/water partitioning
simulation by reversed-phase high performance liquid chromatography for
structurally diverse acidic drugs: effect of n-octanol as mobile phase additive,
Journal of Chromatography A 1166 (2007) 116–125, doi:10.1016/j.chroma.2007.
08.004.
[30] Y. Guo, S. Gaiki, Retention behavior of small polar compounds on polar stationary phases in hydrophilic interaction chromatography, Journal of Chromatography A 1074 (2005) 71–80, doi:10.1016/j.chroma.2005.03.058.
[31] J.J. DeStefano, T.J. Langlois, J.J. Kirkland, Characteristics of Superficially-Porous
Silica Particles for Fast HPLC: some Performance Comparisons with Sub-2-μm
Particles, J Chromatogr Sci 46 (2008) 254–260, doi:10.1093/chromsci/46.3.254.
[32] A. Andrade-Eiroa, Reverse-High Performance Liquid Chromatography Mechanism Explained by Polarization of Stationary Phase, CheM 1 (2011), doi:10.
5618/chem.2011.v1.n1.8.
[33] C.A. Lipinski, Lead- and drug-like compounds: the rule-of-five revolution, Drug
Discovery Today: Technologies 1 (2004) 337–341, doi:10.1016/j.ddtec.2004.11.
007.
[34] G. Ermondi, M. Vallaro, G. Goetz, M. Shalaeva, G. Caron, Experimental
lipophilicity for beyond Rule of 5 compounds, Future Drug Discovery 1 (2019)
FDD10, doi:10.4155/fdd- 2019- 0 0 02.
11