Development of a method to measure consumer emotions associated with foods
Bạn đang xem bản rút gọn của tài liệu. Xem và tải ngay bản đầy đủ của tài liệu tại đây (735.6 KB, 10 trang )
Development of a method to measure consumer emotions associated with foods
Silvia C. King
a,
*
, Herbert L. Meiselman
b
a
McCormick and Company, Inc., 204 Wight Avenue, Hunt Valley, MD 21030, USA
b
Herb Meiselman Training and Consulting Services, P.O. Box 28, Rockport, MA 01966, USA
article info
Article history:
Received 30 October 2008
Received in revised form 9 February 2009
Accepted 13 February 2009
Available online 23 February 2009
Keywords:
Emotion
Mood
Consumer
Food
abstract
Emotion attributes have been generally associated with product brands but little work has been pub-
lished to understand consumer emotions associated with the product itself. The purpose of this series
of studies was to develop an emotion-specific questionnaire to test foods with consumers in person or
on the internet. A list of emotion terms was screened and validated with consumers. The emotion terms
selected for foods were generally positive, as compared with emotion testing originating within a clinical
framework. The list of emotions was useful in differentiating between and within categories of foods.
Higher overall acceptability scores correlated with higher emotions, but differences in emotion profiles
did not always correlate to differences in acceptability. A description of the approach used to develop
the questionnaire, questionnaire format, effect of test context, and specific applications of the method
to foods are presented. This test represents a major methodological advance in consumer testing of food
products in a commercial environment.
Ó 2009 Elsevier Ltd. All rights reserved.
1. Introduction
Food affects the way we feel, and researchers have included
mood as a key variable determining food choices. One of the clear-
est demonstrations of this is the Food Choice Questionnaire devel-
oped by Steptoe, Pollard, and Wardle (1995) to identify
determinants of food choice. Nine factors were identified including
mood, which has also been identified in a number of follow-up
cross-cultural studies (Eertmans, Victoir, Notelaers, Vansant, &
Van den Bergh, 2006).
Mood has also been identified as a key behavioral outcome of
foods along with cognitive and physical performance (Lieberman,
2005). In fact, mood is often the easiest outcome to measure, more
easily measured than physical outcomes or subtle cognitive out-
comes. Much of the published food and mood research has come
about as part of this tradition of looking for effects of food on hu-
man performance (Gibson, 2006; Lieberman, 2005).
Despite the evidence that food affects mood, there has been rel-
atively little published on mood research within food product
development. This can be attributed to a number of factors includ-
ing the practice that food companies keep this material secret in
order to gain a competitive advantage. However, another reason
is the lack of a standard method or methods for measuring emo-
tions associated with food within the product development con-
text. This context is important because techniques which are
appropriate for the academic laboratory research might not be
appropriate for commercial settings of consumer laboratories. Aca-
demic laboratory research typically uses student volunteers who
sometimes participate as part of course requirements. Such studies
have minimal time constraints. They also have fewer constraints
on the content of the questionnaire materials presented to stu-
dents or the foods presented to students. There are greater con-
straints within commercial consumer testing: time is usually
constrained, tasks must be reasonable from the consumer perspec-
tive, and foods must appear to be viable commercial products.
1.1. Distinguishing moods and emotions
When one considers measuring mood and emotion, perhaps the
first issue which arises is the distinction between mood and emo-
tion. The answer to this question is easier in theory than in prac-
tice. In theory one can distinguish at least three different
affective behaviors: (1) attitudes which include an evaluative com-
ponent (e.g., ‘‘I like steak.”), (2) emotions, which are brief, intense,
and focused on a referent (e.g., ‘‘The comment made him angry”),
and (3) moods, which are more enduring, build up gradually, are
more diffuse, and not focused on a referent (e.g., ‘‘I am happy.”).
1.2. Lists of moods and emotions
Thus, there is some agreement on the definitions of mood and
emotion, and how to distinguish them in theory. There also is some
agreement on general categories of moods and emotions, and lists
of moods and emotions. The number of terms to describe specific
moods and emotions can be bewildering. Further, much of the
0950-3293/$ - see front matter Ó 2009 Elsevier Ltd. All rights reserved.
doi:10.1016/j.foodqual.2009.02.005
* Corresponding author. Tel.: +1 410 771 7390; fax: +1 410 527 8924.
E-mail address: (S.C. King).
Food Quality and Preference 21 (2010) 168–177
Contents lists available at ScienceDirect
Food Quality and Preference
journal homepage: www.elsevier.com/locate/foodqual
research on moods and emotions and many of the resulting ques-
tionnaires were developed within a clinical psychiatric setting. The
mood and emotion lists reflect this, and can appear negative and
sometimes offensive to the average consumer judging a product.
Such words might include tormented and destroyed.
In their recent review, Laros and Steenkamp (2005) list 173 neg-
ative and 143 positive emotions drawn from the literature (Laros
and Steenkamp, Table 2, p. 1439), and further list 39 ‘‘basic emo-
tions” also drawn from the literature. The number of basic emo-
tions that are negative far exceeds the number of positive
emotions. Laros and Steenkamp caution that their research is based
on Dutch data. Rousset, Deiss, Juillard, Schlich, and Droit-Vilet
(2005) report 237 French emotional words, and further, that over
50% of French people surveyed used 70 of the emotional words.
Laros and Steenkamp (2005) validated the ‘‘wide divergence in
the content and structure of emotions used in these studies” and
attempted to provide a consumer emotions’ model.
At the broadest level, one can view emotions on two dimen-
sions: as positive versus negative (see below in our method), and
pleasure or arousal versus displeasure. Laros and Steenkamp cata-
logue 15 different approaches to such categorizations (Table 1, p.
1438). The most common categorization was positive–negative,
and Laros and Steenkamp go on to use this for their basic hierarchy
of consumer emotions (Laros & Steenkamp, 2005, Fig. 1 p. 1441)
Fig. 1. They used 41 terms which were reduced to 33 terms to de-
scribe emotional response to foods.
Desmet and Schifferstein (2008) have measured responses to
positive and negative emotion words, which they term pleasant
and unpleasant. They noted in two studies that people overwhelm-
ingly use positive rather than negative words, whether describing
recalled food experiences or describing reactions to food samples.
Desmet and Schifferstein refer to this positive bias as ‘‘hedonic
asymmetry”, and attribute it to two things: the general ‘‘positive
affective disposition towards eating and tasting food” and the fact
that actual food products ‘‘are designed to appeal to consumers.”
Gibson (2006) has also commented on the basically positive nature
of the food experience. We will return to the issue of hedonic
asymmetry in the Discussion of this paper.
1.3. Standardized mood questionnaires
A number of standardized questionnaires of mood are used in
research studies. However, it is important to emphasize that these
questionnaires were not designed for general consumer use, and
are most often applied in the clinical setting or the research clinical
setting, not the food or product development laboratory. One of the
oldest questionnaires is the Profile of Mood States (POMS) which
has its roots in American psychology in the 1940s and 1950s.
The Manual for the POMS (McNair, Lorr, and Droppleman (1971))
describes the POMS as ‘‘a rapid, economical method for identifying
and assessing transient, fluctuating affective states” although the
authors emphasize the clinical psychiatric goals of the method.
The POMS uses 65 mood terms which are rated on a five point rat-
ing scale. The survey can be oriented towards a variety of time-
frames: feelings during the past week, today, right now, and the
past three minutes. The POMS measures mood on six dimensions:
tension–anxiety, depression–dejection, anger–hostility, vigor–
activity, fatigue–inertia, and confusion–bewilderment. The POMS
has been used extensively in research and is probably the most
widely used questionnaire for research in clinical and academic
environments (for example, see Smit & Rogers, 2002; Lieberman,
2005; Smith, Clark, & Gallagher, 1999).
Another mood questionnaire is the Multiple Affect Adjective
Check List (MAACL), which is also used extensively in clinical psy-
chiatric settings. The MAACL was first published in 1965 (Zucker-
man & Lubin, 1965), and revised as the MAACL-R in 1985
(Zuckerman & Lubin, 1985). The authors have also published an
extensive bibliography of mood papers (Lubin, Swearingi and
0
10
20
30
40
50
60
P
le
ased/happy
Good/good-
nature
d
S
atisf
ie
d
Ca
l
m
Fri
e
n
d
l
y
A
c
tive/energetic
Peaceful/quiet
En
thu
sias
t
i
c
Free
A
ffecti
o
na
te
/
l
o
v
ing
Inter
e
st
e
d
Wh
o
le
A
dventurous/daring
Sec
ure
Un
d
ersta
n
din
g
Tame
Wild
Po
l
ite
Mil
d
/
t
i
mid
A
ggressive
Mea
n
/c
r
uel
Lo
n
e
ly
/
lost
Sh
a
k
y
A
lon
e
Afr
aid
/
fe
ar
fu
l
Des
t
roy
e
d
/
s
unk
Rejected
Ne
r
v
o
us/
te
n
s
e
A
n
g
r
y
To
rmented
Suffering
Criti
cal
Sa
d
/miserable
D
i
scour
a
g
e
d
D
i
sagr
e
a
b
le
A
nnoye
d/ir
ritated
Di
sgusted
B
o
red
Emotions
Percent reponse
Favorite Least Favorite
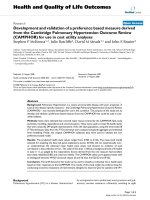
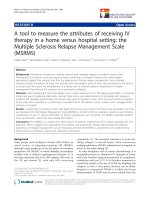
Fig. 1. Mean frequency of emotion terms describing favorite and least favorite foods with US participants (n = 105).
S.C. King, H.L. Meiselman / Food Quality and Preference 21 (2010) 168–177
169
Zuckerman, 1997). The MAACL in its revised form (MAACL-R) con-
tains five categories or scales with a total of 66 adjectives. This is a
checklist and the terms are not scaled. The questionnaire can be gi-
ven in a state form (‘‘how you feel now or today”), or a trait form
(‘‘how you generally feel”). The MAACL-R has two positive scales,
sensation seeking (more active) and positive affect (more passive),
and three negative scales, anxiety, depression, and hostility. The
authors point out the similarities between the MAACL-R and the
POMS, although the correlations between the two scales can vary
with instructions (state form vs. trait form):
1.4. Facial scaling
Another approach to measuring emotions has been the use of
facial scaling. A number of different systems for facial scaling have
recently appeared including the following:
Noldus FaceReader (2007), (7 basic
emotions, 1 positive).
Emotionomics (2007), (7 basic
emotions, 1 positive).
PrEmo (2000), (14
basic emotions, 7 positive, 7 negative).
All of these systems have several things in common which led
us to consider an alternate method. They all have a short number
of emotions. Two of the systems have mainly negative emotions
with only one positive emotion (happiness); the other has small
numbers of both positive and negative emotions. These facial scal-
ing systems were originally designed for consumer products other
than food.
The goal of this research was the development of a question-
naire to measure emotion and mood in a commercial context.
Therefore the method was aimed at product category users and
product users who typically like the product. To accomplish this
we conducted a series of 16 experiments using a total of 5159 sub-
jects. The studies included both Central Location Tests (CLTs) and
Internet surveys, both using standard commercial procedures.
The goals of these series of studies were as follows:
1. Identify appropriate terms to measure emotions associated
with foods maximizing information about the product.
2. Identify scaling approaches to measure emotions with
consumers.
3. Develop a test protocol to evaluate food and measure emotions.
4. Identify method applications.
2. Method for Identifying emotion terms
2.1. Source of terms
The list of emotions to be included in the questionnaire evolved
from two sources: existing mood and emotion questionnaires and
feedback from consumers. Existing questionnaires included the
MAACL-R (Zuckerman & Lubin, 1985) and the POMS (McNair
et al., 1971). Feedback was collected from thousands of consumers
via the internet, central location tests (CLT) and a focus group. A to-
tal of 81 terms were evaluated. The terms were evaluated individ-
ually and/or clustered in groups of 2–3 terms based on the
similarity of their definition (the Microsoft Thesaurus was used
to identify groupings).
2.2. Term identification
An internet survey was used to identify attributes used to de-
scribe a variety of foods. Respondents (N = 105) were asked to de-
scribe their favorite beverage, snack or dessert as well as their least
favorite meal, dessert and snack. Next, they were presented with a
list of emotions and asked to describe how they felt when consum-
ing each product by selecting one or more words that described
their feelings. Fig. 1 presents the results of this study. Positive emo-
tion terms were used to describe favorite foods while negative
terms were associated with least favorite foods. Positive terms
were used with higher frequency. Four negative terms were se-
lected 20% of the time or more (bored, disgusted, annoyed, and dis-
agreeable), as compared with 10 positive terms (pleased, good,
satisfied, calm, friendly, active, peaceful, enthusiastic, free, affec-
tionate). This initial study confirmed the use of positive emotions
to describe reactions to liked foods.
2.3. Term categorization and selection
In an effort to understand consumer’s use of these emotion
terms, we conducted an internet study in which 200 respondents
were asked to categorize emotions, as they relate to food, as po-
sitive, negative, both positive and negative or neither positive nor
negative. The objective of this study was to identify those terms
that are more clearly understood by most consumers as com-
pared with those terms that are unclear or may have different
interpretations depending on the individual and/or situation.
Terms selected >60% were categorized as positive or negative.
In addition, there were terms that were less clearly positive and
negative (50–59% frequency). Terms selected less than 50% of
the time as positive or negative were grouped as inconclusive.
The
results
are
shown
in Table 1. Of the 80 terms evaluated, 32
were positive (25 clearly positive and 7 not as clearly positive)
and 27 were negative (17 clearly negative and 10 not as clearly
negative), leaving 21 terms with no clear classification. These
emotions were deemed unclassifiable because more than 50% of
the participants rated the emotion neither positive nor negative
or both positive and negative. Therefore the emotion did not
clearly belong in either positive or negative categories. We con-
cluded that people vary in their perception of emotional terms
as positive or negative, making the task of developing a standard
measure of emotions for consumers more challenging. We are
still identifying what are the factors that may result in this dis-
agreement, i.e.: consumer demographic and/or psychographic dif-
ferences as well as the food and/or context in which the food may
be consumed. The negative terms from this test used in the final
questionnaire were disgusted, bored and worried; and also
aggressive, mild, quiet, tame, daring, guilty and wild from the un-
clear classification. The negative terms selected were more fre-
quently used by consumers. Some of the terms classified as
unclear were selected based on consumer use for specific product
categories/profiles (aggressive, mild, daring, wild); the other
terms are part of the sensation seeking classification for the MAC-
CL-R questionnaire which we found applicable given some of the
current food trends such as bold flavors, unusual flavor combina-
tions, novel flavors and ethnic cuisines.
The goal for questionnaire length was not to exceed 10–15 min.
to complete an internet survey, and <30 min for a consumer test.
The final questionnaire contained 39 emotion terms.
POMS scales MAACL-R scales
Tension Anxiety
Depression Depression
Anger Hostility
Fatigue
Confusion
Vigor Sensation seeking and positive affect
170 S.C. King, H.L. Meiselman / Food Quality and Preference 21 (2010) 168–177
Criteria for term selection:
(1) Frequency of use. Terms were selected based on a P20% fre-
quency of use on a checklist questionnaire.
(2) Term categorization as positive or negative. Some of the
terms that consumers were not able to classify as positive
or negative were eliminated from the questionnaire.
(3) Consumer feedback regarding their appropriateness to food
testing. Consumers provided feedback on which terms were
appropriate when testing with foods as well as provided
new terms that might have been missing from existing emo-
tion questionnaires.
As testing progressed, respondents were given an opportunity
to comment on the test approach. Comments associated with the
test format suggested that the approach was different and fun.
One or two respondents in each test (n of 100 or more) found some
of the terms offensive, specifically when the original questionnaire
included terms associated with depression and anxiety, and ques-
tioned the objective of the test. This small percentage of question-
ing responses needs to be minimized in the commercial setting.
Negative terms associated with depression (alone, destroyed,
lonely, lost, miserable, rejected, and suffering), hostility (annoyed,
critical, cruel, disagreeable, furious, and mean) and anxiety (afraid,
fearful, shaky, and tense) were excluded from the ballot. Three
negative or non-classifiable terms (calm, guilty and nostalgic) were
included in the ballot based on specific consumer feedback. The
current emotion list of 39 terms is presented in the next section.
3. Method for scaling of emotions
3.1. Checklist questionnaire
In initial testing, consumers chose the emotions to describe
their feelings about a product in the hope that this fast check-all-
that-apply method would produce meaningful results in the com-
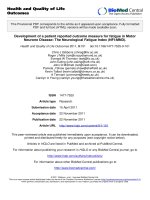
mercial testing context (Fig. 2). The checklist approach was useful
for differentiating products such as flavored crackers with different
flavor profiles (Fig. 3). In this case we were able to differentiate 4
products based on their emotion profile. One of the products (Fla-
vor 3) was clearly different using Analysis of Variance (GLM proce-
dure) and lower in many of the emotions compared to the other
products. We then experimented with a rating scale approach for
emotions, in the hope that scaling emotions would provide addi-
tional information which would be useful in product development
decisions.
3.2. Rating questionnaire
The next step was to measure emotion intensities using a 5-
point intensity scale from 1 = not at all to 5 = extremely (Fig. 4).
This ballot was designed to differentiate among products as well
as within product variations and has been named the EsSense
Profile
TM
. In addition, a 9-point hedonic scale was incorporated
into the ballot to evaluate overall acceptability of the product
and provide an anchor to current consumer testing methods. This
hedonic scale was added to both the checklist and rating ballot.
This test approach was used in an internet survey with 149 par-
ticipants to differentiate various product categories (Fig. 5) such
as pizza, chocolate, vanilla ice cream, fried chicken and mashed
potatoes and gravy. Pizza and chocolate produced the strongest
emotions based on Analysis of Variance. The terms active, adven-
turous, affectionate, whole, and loving were highest in intensity
for chocolate. Pizza was highest in satisfied, both pizza and
chocolate for energetic, enthusiastic, free, friendly, good,
good-natured, interested, pleased and pleasant. Mashed potatoes
was lowest for guilty, while chocolate, pizza, and fried chicken
were highest for guilty. This test allowed us to conclude that
the rating ballot was useful in differentiating a variety of food
products.
This method was also tested with variations within the same
product (Fig. 6) such as salty snack crackers. In this CLT (n = 109)
sample 1 resulted in higher calm and mild emotions, while sam-
ples 2 and 3 rated higher in aggressive and sample 2 rated higher
in eager. The results of this test concluded that a rating ballot was
useful in differentiating flavor variations of the same product. Data
from this ballot were evaluated using Analysis of Variance (GLM
procedure) in all future tests.
Table 1
Consumer classification of emotions. Consumers categorized emotions into positive, negative, both positive and negative, neither positive nor negative. The emotions were then
grouped into three distinct categories: Positive, negative or unclear. Bolded terms are used in the current ballot.
Positive More positive Negative More negative No clear classification
Adventurous Active Angry Afraid Aggressive
Blissful Affectionate Annoyed Alone Bewildered
Comfortable Calm Bad Bored Craving
Content Carefree Cruel Destroyed Critical
Energetic Irresistible Disagreeable Fearful Daring
Enthusiastic Satiating Discouraged Lazy Eager
Free Secure Disgusted Lost Guilty
Friendly Irritated Nervous Mild
Glad Lonely Tense Naughty
Good Mean Worried Polite
Good-natured Miserable Quiet
Happy Nauseated Shaky
Interested Rejected Shy
Joyful Sad Steady
Loving Suffering Surprised
Merry Sunk Tame
Nostalgic Tormented Timid
Peaceful Understanding
Pleasant Underwhelmed
Pleased Wild
Relaxed Young
Satisfied
Tender
Warm
Whole
S.C. King, H.L. Meiselman / Food Quality and Preference 21 (2010) 168–177
171
3.3. Emotion list order
The emotion terms are presented in alphabetical order (as
shown in Fig. 4) so consumers can get acquainted with the ballot
more quickly and shorten the task over each sample evaluation.
We compared this alphabetized approach with a randomized
attribute presentation and found that the results were similar
(correlation coefficient = 0.99). This suggests that the order does
not impact the results and we would expect that keeping the
attributes in the same order would make the task easier for the
participants. However, those applying this questionnaire in
different contexts than we used, would want to check for order
effects.
4. Consumer methods and protocols for testing emotion data
Data were collected via internet survey, CLT and home use tests.
Home use tests will not be discussed in this paper.
0
10
20
30
40
50
60
70
In
t
ere
s
ted*
W
a
rm
*
Energe
ti
c
**
Adventurous**
G
o
od
*
*
En
th
u
s
i
a
s
ti
c
Eage
r
Happy*
*
Satisfied**
Active*
Dari
n
g
*
*
Ple
a
sa
n
t
*
*
Aggressive**
Ple
a
s
ed
**
Goo
d
-n
a
tu
red
**
Pol
i
t
e*
*
Fri
e
nd
l
y**
Ca
lm*
*
Gla
d
*
*
Wil
d
**
F
re
e
Qui
e
t**
U
n
derstand
i
ng**
Se
c
u
re
*
*
Pe
ac
e
fu
l
**
Stead
y
**
W
hol
e**
Mil
d
*
*
Frequency (%)
Flavor 1
Flavor 2 Flavor 3
Flavor 4
*, ** Indicate a significant difference at p≤ 0.05, 0.01
Fig. 3. Emotion profiles comparing four products in the same food category (flavored crackers). Study was completed via CLT using a checklist approach.
How much you LIKE or DISLIKE (
product)
?
Dislike
extremely
Dislike
very much
Dislike
moderately
Dislike
slightly
Neither
like
nor dislike
Like
slightly
Like
moderately
Like
very much
Like
extremely
Please select the words which describe how you FEEL RIGHT NOW.
Select all that apply.
Active Glad Pleasant
Adventurous Good
Polite
Affectionate Good-natured Quiet
Aggressive Guilty Satisfied
Bored
Happy
Secure
Calm Interested Steady
Daring
Joyful Tame
Disgusted
Loving Tender
Eager Merry Understanding
Energetic Mild Warm
Enthusiastic
Nostalgic
Whole
Free
Peaceful
Wild
Friendly
Pleased Worried
Please taste (
product name
) # xxx now.
Fig. 2. Finalized consumer ballot including overall acceptability and emotion check list.
172 S.C. King, H.L. Meiselman / Food Quality and Preference 21 (2010) 168–177