Direct, automated and sensitive determination of glyphosate and related anionic pesticides in environmental water samples using solid-phase extraction on-line combined with liquid
Bạn đang xem bản rút gọn của tài liệu. Xem và tải ngay bản đầy đủ của tài liệu tại đây (1.96 MB, 9 trang )
Journal of Chromatography A 1687 (2022) 463697
Contents lists available at ScienceDirect
Journal of Chromatography A
journal homepage: www.elsevier.com/locate/chroma
Direct, automated and sensitive determination of glyphosate and
related anionic pesticides in environmental water samples using
solid-phase extraction on-line combined with liquid chromatography
tandem mass spectrometry
J. López-Vázquez, L. Pérez-Mayán, V. Fernández-Fernández, R. Cela, I. Rodríguez∗
Department of Analytical Chemistry, Nutrition and Food Sciences. Research Institute on Chemical and Biological Analysis (IAQBUS). Universidade de
Santiago de Compostela, 15782-Santiago de Compostela, Spain
a r t i c l e
i n f o
Article history:
Received 10 October 2022
Revised 29 November 2022
Accepted 30 November 2022
Available online 5 December 2022
Keywords:
Glyphosate
Zwitterionic pesticides
On-line solid-phase extraction
Liquid chromatography mass spectrometry
a b s t r a c t
An automated procedure for the simultaneous determination of six anionic pesticides, including
glyphosate (GLY) and its transformation product aminomethylphosphonic acid (AMPA), was developed
and applied to the analysis of environmental water samples. The proposed method combines on-line
concentration of water samples (0.160 mL), with compounds separation in an anion-exchange liquid
chromatography (LC) column, followed by their selective determination by tandem mass spectrometry
(MS/MS). The global procedure was completed in 25 min, providing limits of quantification (LOQs) between 5 ng L−1 and 20 ng L−1 , with reduced effect of the surface water matrix in the efficiency of process (SPE and ionization yields). The method was applied to the analysis of grab samples obtained from
three watersheds, in two rural and one residential area, in Galicia (Northwest Spain). Out of six investigated compounds, Fosetyl, AMPA and GLY were noticed in the set of processed samples. Their detection
frequencies increased from 12% (Fosetyl) to 88% (AMPA). Median concentrations followed the same trend
varying from 9 ng L−1 (Fosetyl) to 44 ng L−1 (AMPA). The higher levels and the large seasonal variations in the residues of the latter species were noticed in small rivers affected by discharges of municipal
sewage treatment plants (STPs).
© 2022 The Author(s). Published by Elsevier B.V.
This is an open access article under the CC BY-NC-ND license
( />
1. Introduction
Glyphosate (GLY) is a non-selective herbicide impairing the synthesis of aromatic aminoacids by plants. It is widely employed to
control the development of weeds in permanent and transgenic
crops and to homogenize the harvest of GLY sensitive plants. Additionally to agriculture uses, GLY is also applied to destroy vegetation growing in the limits of roads, as well as in forestry, to control
the development of water and nutrients competing plants [1].
After application, GLY is assumed to remain bonded to cations
existing in soil, particularly to iron, copper and aluminum containing minerals. This behavior, combined with an estimated soil
half-life of a few days [2], turns in a low groundwater ubiquity
score (GUS index 0.21) [3], pointing out to a reduced risk of leaching to groundwater and/or surface water. Aminomethylphosphonic
∗
Corresponding author.
E-mail address: (I. Rodríguez).
acid (AMPA) is the main transformation product of GLY in soils.
AMPA is also a Zwitterionic species, with a slightly higher half-life
in soil than the parent herbicide. Despite direct migration of both
compounds to the aquatic media is unlikely, the misuse of the parent herbicide, runoff transport associated to soil particles during
heavy rain events, wind erosion and atmospheric drift might result in the contamination of surface waters with GLY and/or AMPA
[4]. Furthermore, phosphate fertilizers increase the release of GLY,
and AMPA, from soil to the water phase, due to displacement of
both compounds from their metallic quelates [5]. In line with these
comments, several studies have reported the presence of GLY and
AMPA in surface water from agriculture impacted basins [6] and,
particularly, in streams draining transgenic crops [7–9]. A national
scale survey carried out in USA (more than 30 0 0 samples were
taken from 70 rivers and streams for two years) has reported detection frequencies and median concentrations of 74% and 50 ng
L−1 for GLY, with even higher figures for AMPA [9]. Residues of
these pesticides are not limited to intensive agriculture areas. In
fact, in Germany, the occurrence and the average concentrations of
/>0021-9673/© 2022 The Author(s). Published by Elsevier B.V. This is an open access article under the CC BY-NC-ND license
( />
J. López-Vázquez, L. Pérez-Mayán, V. Fernández-Fernández et al.
Journal of Chromatography A 1687 (2022) 463697
GLY and AMPA were higher for water samples obtained in the surrounding of urban areas than in rural environments [6].
The most often employed methodology to determine GLY and
AMPA in aqueous matrices involves compounds derivatization using 9-fluorenylmethylchloroformate (FMOC–Cl) before extraction
and liquid chromatography (LC) determination [10–12]. FMOC
derivatization decreases the polarity of both compounds allowing their effective extraction and concentration using reversedphase sorbents (or liquid-liquid extraction) and their further analysis by LC under the same separation mode. However, the reaction of these compounds with FMOC–Cl shows a slow kinetics,
it requires removing the excess of derivatization reagent and/or
the reaction by-products before LC analysis. Thus, other analytical methods have been proposed. Although some of them have
explored alternative derivatization reactions, in some cases combined with gas chromatography-based techniques [13,14], the major stream considers direct analysis of native compounds, exploring different LC stationary phases. Among them, hydrophilic interaction, mixed-mode and anionic exchange columns have been already tested for the separation of both species, and other anionic
and/or Zwitterion pesticides, either in food or in water samples
[15–22]. Other compounds with similar features (anionic character and high polarity) to GLY include the fungicide Fosetyl-Al [23],
the herbicide glufosinate (GLU) and the environmental transformation products of the latter compound N-acetyl glufosinate (NAG)
and 3-(methylphosphinic) propionic acid (MPPA) [24]. It is worth
noting that neither Fosetyl, nor MPPA can be determined using the
FMOC–Cl derivatization approach. Advances in the determination
of these anionic, metal complexing compounds are not only related with evaluation of new stationary phases, but also with the
testing of different additives (i.e. medronic acid) [25] and/or PEEK
lined columns preventing non-reversible interactions between analytes and metal cations, either coming from samples, column walls
and/or the LC instrument itself [17].
Another limitation for direct analysis of Zwitterionic species is
the difficulty to extract and concentrate these compounds from
water samples. Direct injection of large sample volumes, use of
anion-exchange solid-phase extraction (SPE) sorbents, or selective
concentration of pre-defined compounds (i.e. GLY) with molecularly imprinted polymers (MIP), are some of the solutions reported
in the literature [18,21,26]. To the best of our knowledge, neither
these extraction procedures have been on-line combined with LC
and tandem mass spectrometry (MS/MS) detection, nor they have
reached similar LOQs to those reported for the FMOC–Cl protocol
[11,12].
This manuscript pursuits two aims. The first was assessing the
performance of an automated, direct LC-MS/MS methodology for
the simultaneous determination of GLY, AMPA and two additional
anionic pesticides (Fosetyl-aluminum; GLU) and also the environmental transformation products of the later: NAG and MPPA in environmental water samples. The second aim was to evaluate their
occurrence and possible seasonal variations, in samples obtained
from three different watersheds in Galicia (Northwest Spain).
Research Chemicals (North York, Canada). Individual solutions of
each compound were prepared in ultrapure water, containing 0.1%
of formic acid. Further dilutions were made in ultrapure water. Calibration standards containing increasing concentrations of native
compounds (from 5 ng L−1 to 50 0 0 ng L−1 ), and a constant level of
labelled species (500 ng L−1 ), were also prepared in ultrapure water. All the standard solutions were stored in polypropylene tubes
to prevent sorption of analytes on the surface of glass vials.
Acetonitrile (ACN) and methanol (MeOH), both LC-MS grade,
were purchased from Merck (Darmstadt, Germany). Ultrapure water was obtained from a Genie U system (Rephile, Shanghai, China).
Ammonium bicarbonate and formic acid, both LC-MS purity, were
supplied by Honeywell Fluka (Seelz, Germany) and Fisher scientific
(Portsmouth, NH, USA), respectively.
2.2. Samples
Samples employed during method development and validation
include ultrapure water, surface water obtained from streams and
rivers, mineral water (commercially available bottled water), tap
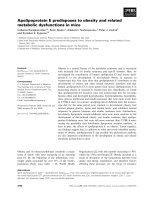
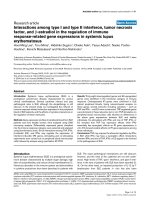
water and well water. Regarding environmental studies, 17 sampling points were selected from three areas in Galicia (Norwest
Spain), Fig. 1A. Points S1 to S13 correspond to a hilly rural area,
with a low population density distributed in tiny villages and dispersed farms, devoted to vineyard production. In this region, samples were obtained from the two main rivers draining vineyards:
Avia (S2, S3, S4) and Miño (S5, S6, S9 and S11), as well as some
tributary streams and groundwater springs, Fig. 1B. Points S14 and
S15 correspond to a small river (Tinto), flowing through a residential, peri–urban area, with a low impact of agriculture activities.
Sampling sites were placed upstream (S14) and downstream (S15)
the discharge point of a STP serving a population of 13,0 0 0 inhabitants, Fig. 1C. In both areas, four sampling campaigns were carried
out from the beginning of spring to summer.
Points S16 and S17 were placed in a medium size river (Limia)
flowing through a rural flat area of arable fields, devoted to production of cereals (maize and wheat) and potatoes, Fig. 1D. The
river also receives the discharge of treated water from a STP serving a population of 12,0 0 0 inhabitants. In this area, both sampling
points were placed after the municipal STP. Three sampling campaigns were carried out to detect potential agriculture uses of herbicides before tillage of agriculture fields (spring), and as driers of
wheat and potato crops, in the middle of summer and the beginning of autumn, respectively.
Table S1 summarizes the exact position of each point and the
sampling dates. With the exception of the surface water reservoir
in Miño river, significant variations in the flow of the rest of rivers
and streams were noticed during the sampling period. Particularly,
low flows were observed in the latter campaign in the three considered areas. Available data for major rivers, obtained from regional water management authorities, are compiled in Table S2.
Samples were taken in polypropylene flasks and transported to
the laboratory at room temperature, within 4 h. Thereafter, they
were either analyzed in the next 24 h, or stored at −20 ºC until
analysis. Tap water was collected in the laboratory when needed
and mineral water was purchased in local markets.
2. Material and methods
2.1. Standards, solvents and sorbents
The standards of GLY, AMPA, Fosetyl-aluminum, GLU and MPPA
were acquired from Sigma-Aldrich (St. Louis, MO, USA). NAG was
provided by LGC standards (London, UK). Native parent pesticides and their transformation products were analytical grade quality, with a purity above 98%. Their chemical structures are given
as supplementary information, Fig. S1. Isotopically labelled analogues of GLY (1,2–13 C2 , 15 N; 99%), AMPA (13 C,15 N, 97%), Fosetylaluminum-d15 (95%) and GLU-d3 (98%) were provided by Toronto
2.3. Sample preparation
Sample preparation involved filtration (case of environmental
water samples), using 0.22 μm hydrophilic polytetrafluoroethylene (PTFE) syringe filters acquired from Phenomenex (Torrance,
CA, USA), addition of the mixture of surrogate standards (SSs) at
500 ng L−1 , and analysis by SPE on-line connected with the LCMS/MS system under conditions reported in the next section.
2
J. López-Vázquez, L. Pérez-Mayán, V. Fernández-Fernández et al.
Journal of Chromatography A 1687 (2022) 463697
Fig. 1. Map of sampling points (S1-S17) in the three different areas in Galicia (Northwest Spain).
2.4. LC-MS/MS equipment and determination conditions
and the SPE sorbent was conditioned using MeOH (15–18 min,
1 mL min−1 ) followed by ultrapure water (18.1–25 min, 0.5 mL
min−1 ).
Nitrogen was employed as drying (11 L min−1 , 150 ºC), sheath
(12 L min−1 , 400 ºC) and nebulizing gas (55 psi) in the ESI source.
The needle voltages were 30 0 0 V and 150 0 V for ESI (+) and ESI
(-) modes, respectively. The fragmentor voltage was 166 V. Table 1
gathers the m/z values for precursor and product ions for native
pesticides and SSs. Retention times and ratios between qualification (Q2 and Q3) and quantification (Q1) transitions of each compound are also given in Table 1.
The LC-MS/MS system was an Agilent 1290 Infinity II liquid
chromatograph connected to an Agilent 6495, triple quadrupole
(QqQ) mass spectrometer, equipped with a jet stream ESI ionization source. In addition to the binary analytical pump, the LC-MS
platform included an auxiliary pump to deliver calibration standards and samples through the SPE cartridge, on-line coupled to
the analytical column. Both, cartridge and column, were connected
using a 10-port, 2-possition valve. Fig. S2 shows a scheme of the
valve during on-line SPE concentration and desorption steps. The
LC instrument included an autosampler, with a 100 μL needle loop,
and an extended injector seat permitting to accommodate up to
0.5 mL samples before being transferred to the SPE cartridge.
Compounds were separated using a Metrosep A Supp 6, strong
anionic exchange column (150 mm x 2 mm, 5 μm), acquired from
Metrohm (Herisau, Switzerland). The mobile phase used in the analytical column consisted of a mixture of ACN:ultrapure water (1:1)
with a 45 mM concentration of bicarbonate ammonium (phase
A); and ultrapure water, 50 mM in bicarbonate ammonium (phase
B). Its composition was programmed as follows: 0–3 min, 0% B;
7.5 min, 35% B; 10 min, 60% B; 11–18 min, 100% B; 18.1–25 min,
0% B. The flowrate of mobile phase and the column temperature
were 0.3 mL min−1 and 30 ºC, respectively. In the auxiliary pump,
ultrapure water (phase C) and MeOH (phase D) were used. As SPE
sorbent, we employed an anionic exchange pre-column (5 mm x
4 mm, 5 μm) from Metrohm, with the same stationary phase as
the analytical column, and a larger internal diameter.
Under final working conditions, 0.160 mL samples were loaded
in the pre-column using ultrapure water (phase C), as carrier at
0.5 mL min−1 for 1 min, then the flowrate of ultrapure was increased to 1 mL min−1 , and maintained until 2.5 min. In this step,
anionic species were retained in the on-line connected pre-column,
whilst other components flowed to waste. After 2.5 min, the 10port valve switched to elution position, with compounds being
transferred from the pre-column to the analytical column. The
valve returned to its initial position (loading mode) after 15 min,
2.5. Extraction efficiency and samples quantification
The efficiency of the SPE on-line process was assessed comparing the slope of calibration curves obtained for spiked aliquots of
river and mineral water (50 ng L−1 to 20 0 0 ng L−1 , n = 6 different concentration levels) with those corresponding to standards in
ultrapure water with same concentration levels. Responses (peak
areas) obtained for the Q1 transition of each compound, without
any correction with SSs, were plotted against added concentrations. Slope ratios above the unit correspond to increased apparent extraction efficiencies for real samples compared to standards
in ultrapure water, while values below the unit have the opposite
meaning. Changes in the slopes of calibration curves can be related
to variations in the efficiency of the SPE process itself, and/or to
variable yields of ESI ionization depending on the sample matrix.
The accuracy of the method was estimated as the difference
between concentrations measured for spiked and non-spiked fractions of different water samples divided by the added value and
multiplied by 100. Experimental concentrations were determined
against calibration standards prepared in ultrapure water (5 ng L−1
to 50 0 0 ng L−1 ), containing same level of SSs as water samples.
Peak areas for each compound were corrected with that measured
for the corresponding SS, Table 1.
With each set of environmental water samples (15 to 20 samples, plus calibration standards were analyzed in duplicate per
3
J. López-Vázquez, L. Pérez-Mayán, V. Fernández-Fernández et al.
Journal of Chromatography A 1687 (2022) 463697
Table 1
Summary of retention times, precursor and product ions for each compound using SPE on-line connected to LC-QqQ-MS.
Compound
Retention time (min)
ESI mode
Precursor ion (m/z)
Q1 (CE, eV)
Q2 (CE, eV)
Q3 (CE, eV)
Q2/Q1 ratio
Q3/Q1 ratio
a
5.14
5.64
5.95
8.23
8.21
8.61
5.13
5.52
5.94
8.22
–
–
+
+
+
+
–
–
+
+
109
110
182
170
224
153
114
112
185
173
81 (12)
63 (20)
56 (28)
88 (8)
56 (44)
135 (8)
83 (12)
63 (20)
56 (28)
91 (8)
79 (28)
79 (36)
136 (12)
60 (18)
164 (10)
79 (24)
81 (28)
79 (36)
63 (36)
0.33
1.09
0.91
0.33
0.29
0.79
0.70
Fosetyl
b
AMPA
c
GLU
d
GLY
d
NAG
d
MPPA
a
Fosetyl-d5
b
AMPA-13 C,15 N
c
GLU-d3
d
GLY-13 C2 ,15 N
42 (32)
136 (20)
0.60
0.51
63 (36)
62 (17)
a to d, denote the surrogate standard assigned to each pesticide.
CE, collision energy (eV).
batch), one procedural blank and one spiked sample (addition level
100 ng L−1 ) were processed. Acceptable data correspond to concentration levels below method LOQs (from 5 to 20 ng L−1 , depending on the compound) in procedural blanks, and recoveries in
the range from 80% to 120%. LOQs were calculated as the concentration of each compound providing a signal to noise (S/N) ratio of
10 for the Q1 transition while ratios between qualification transitions (Q2 and Q3 when available) and Q1 remain with ± 30% of
average values obtained within the calibration range of the procedure, Table 1. Compounds identification in non-spiked samples was
based on retention time match with calibration standards (maximum variation ± 0.1 min) and qualification (Q2, and Q3 when
available) to quantification (Q1) ions response ratios showing differences lower than ± 30% compared to those obtained for calibration standards, Table 1.
the anionic-exchange sorbent, whilst neutrals and cationic species
flow through to waste. The above flowrates led to pressure values
of 30 and 60 PSI in the on-line cartridge.
For standards prepared in ultrapure water, responses of all the
compounds (peak areas without SS corrections) increased steady
for volumes of sample from 0.05 mL to 0.45 mL (data not shown);
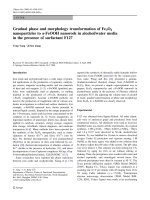
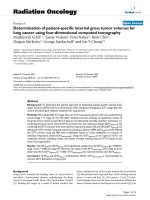
however, a different behavior was noticed for environmental samples. Fig. 2 shows the slopes of calibration curves obtained for
spiked aliquots of river and a commercial, bottled mineral water normalized to those measured for ultrapure water. These two
matrices were selected as representative of soft (river water, Ca2+
5 mg L−1 , Mg2+ 3 mg L−1 ) and hard (mineral water, Ca2+ 86 mg
L−1 , Mg2+ 30 mg L−1 ) waters. For sample volumes of 0.080 and
0.160 mL, determination coefficients (R2 ) above 0.999 were obtained for the plots of response versus concentration, with similar
slopes for the 3 types of water. However, when 0.240 mL of sample are loaded in the on-line cartridge, significant reductions in the
normalized slopes of several compounds, except NAG and MPPA,
were found, Fig. 2. Direct injection (0.05 mL volume aliquots) of
same spiked samples in the anionic exchange column, avoiding the
SPE step, reflected important variations in the slopes of calibration
curves corresponding to the river and the mineral water matrix
compared to those obtained for ultrapure water. Particularly, the
responses of GLU were enhanced significantly in both water matrices compared to ultrapure water; moreover, GLY could not be
detected in hard mineral water and the efficiencies of MPPA and
AMPA detection were reduced in more than 90%, Fig. S3. This information, in combination with data shown in Fig. 2, supports the
fact that the on-line SPE step, contributes to reduce the complexity of the sample and to improve the performance of compounds
determination, avoiding the entrance of neutrals and basic species
in the chromatographic column.
3. Results and discussion
3.1. Optimization of SPE on-line connected to LC-QqQ-MS
Table 1 summarizes retention times, ionization mode, and m/z
values for precursor and product ions of target compounds and SSs.
Although both ionization modes were evaluated, ESI (+) produced
higher signal to noise (S/N) response ratios for all compounds except in case of Fosetyl and AMPA.
At least two MRM transitions were selected per compound. The
dwell time per transition was set at 100 ms for AMPA and GLY
(to enhance the detectability of both pesticides) and 20 ms for
the rest of compounds. The gradient of mobile phase was adapted
from our previous study dealing with the determination of AMPA,
GLY and Fosetyl in vegetal origin samples [17], considering the
delay of retention times induced by the on-line SPE extractiondesorption steps. Although alternative gradients to that reported
in Section 2.4 can be considered, baseline separation between the
peaks of AMPA and Fosetyl is mandatory since both compounds
share several product ions and the m/z of their precursors ([M-H]−
ions) differ only in 1 unit, Table 1. So, the cluster of signals associated to the [M-H]− ion of Fosetyl (m/z values 109 and 110, the
latter due to the natural abundance of 13 C) might lead to false positives for AMPA, whose precursor ion ([M-H]− ) has a m/z ratio of
110, unless both compounds are baseline separated.
As regards the on-line SPE concentration step, the flowrate of
water (phase C, from 0.5 to 2 mL min−1 , during 2.5 min) employed
to load standards and/or samples (up to 0.45 mL aliquots) in the
on-line connected SPE sorbent showed a little effect in their MRM
responses. Values below 0.5 mL min−1 turned in a poor repeatability; whilst compound losses can occur at loading flowrates above
2 mL min−1 as a result of too low equilibration times. Eventually,
flowrates of 0.5 mL min−1 (0–1 min) and 1 mL min−1 (1–2.5 min)
were employed. During this step, target compounds are retained by
3.2. Performance of SPE on-line combined with LC-MS/MS
The linearity of the method was assessed with calibration standards prepared in the range from 5 ng L−1 to 50 0 0 ng L−1 , at nine
different concentration levels (5, 10, 20, 50, 100, 250, 500, 2000
and 50 0 0 ng L−1 , injected in duplicate). After correction of MRM
responses with those of isotopically labelled standards, R2 values
above 0.998 were obtained, Table 2. Despite NAG and MPPA are
structurally related to GLU, their retention times were closer to
that of GLY; thus, the labelled analogue of GLY was used as SS
of these two compounds. The reproducibility of responses (peak
area without SSs correction) for a 40 ng L−1 standard in ultrapure
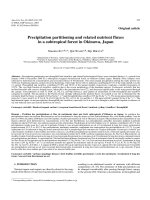
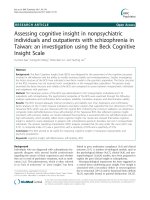
water varied from 2% for NAG to 8% for AMPA (n = 9 extractiondetermination cycles within a 24-h sequence). Fig. 3 shows the
chromatogram for a low-level calibration standard (20 ng L−1 per
compound).
4
J. López-Vázquez, L. Pérez-Mayán, V. Fernández-Fernández et al.
Journal of Chromatography A 1687 (2022) 463697
Fig. 2. Slopes of calibration curves obtained for spiked aliquots of two different water samples normalized to those corresponding to ultrapure water. Calibration range:
50 ng L-1 to 20 0 0 ng L-1 . Error bars reflect standard deviations for the slope of calibration curves corresponding to each matrix.
Table 2
Linearity, accuracy (recoveries for spiked samples, 80, 200 and 500 ng L−1 , with SD,%) and LOQs of the SPE on-line LC-QqQ-MS direct analysis method.
Recovery (average with SD, n = 3 replicates)
Compound
2
R (5–50 0 0 ng L
−1
)
Ground water
80 ng L
Fosetyl
AMPA
GLU
GLY
NAG
MPPA
0.9994
0.9993
0.9997
0.9999
0.998
0.999
71 (4)
102 (2)
99 (3)
93 (1)
87 (3)
90 (2)
−1
200 ng L
77 (7)
88 (5)
85 (3)
85 (4)
99 (6)
102 (6)
River water
−1
500 ng L
122
112
111
106
101
102
(6)
(3)
(1)
(2)
(27)
(14)
−1
80 ng L
−1
115 (2)
83 (3)
98 (1)
103 (4)
79 (1)
88 (3)
LOQs (ng L−1 )
Tap water
200 ng L
91
80
84
87
92
97
(5)
(3)
(5)
(4)
(4)
(5)
−1
500 ng L
95 (7)
86 (6)
95 (8)
88 (9)
97 (8)
101 (9)
−1
80 ng L
118 (2)
101 (2)
104 (3)
101 (4)
83 (3)
91 (2)
−1
200 ng L
92
89
87
86
93
99
−1
(3)
(4)
(1)
(3)
(4)
(4)
500 ng L
126
106
105
114
141
111
−1
(1)
(8)
(5)
(4)
(3)
(2)
5
5
20
10
5
5
Table 3
Summary of concentrations (ng L−1 ) for compounds above method
LOQs in the set of 66 water samples.
The accuracy of the method was investigated considering three
water matrices and three addition levels (80 ng L−1 , 200 ng L−1
and 500 ng L−1 ). Obtained data are summarized in Table 2. In
general, recoveries varied in the range from 80% to 105%, with
associated standard deviations (SDs) below 8%. In the particular
case of Fosetyl, recoveries for the different matrices showed average percentages between 71% and 126%, with similar SDs to those
reported for the rest of compounds, Table 2. Finally, a recovery
around 140% was observed for NAG in one of the samples spiked
at 500 ng L−1 . The LOQs of the procedure, calculated as described
in Section 2.5, varied between 5 and 20 ng L−1 . GLY and GLU were
the species displaying the higher LOQs (10 and 20 ng L−1 , respectively), due to the relatively low intensity of the qualification transitions (Q2 and Q3) for the first pesticide (Fig. 3D), and the presence of an interfering peak in the Q2 transition of GLU (Fig. 3C). In
order to get these values, the LC instrument was daily conditioned
using a solution of citric acid (5 mM) at a flow of 1 mL min−1 , for
20 min, before installing the anionic exchange column. No modifications were made in the hardware of the LC-QqQ-MS system
apart from (1) using an extended injector seat (0.5 mL volume,
made of PEEK) to accommodate the sample before being loaded
in the SPE cartridge and (2) connecting the outlet of the column
directly to the ESI source (avoiding the six-port valve of the MS
spectrometer). The analytical column was used for more than 10 0 0
injections without losses of performance, and the on-line cartridge
was replaced when increased pressure values were noticed (c.a. every 300 extraction-desorption cycles).
The previous application of anionic exchange chromatography,
considering similar LC-MS/MS conditions to those applied in the
current research, achieved LOQs of 100 ng L−1 for AMPA, GLY and
GLU for direct injection of 0.05 mL samples [18]. Thus, the online SPE step shows a significant impact in the sensitivity of the
analytical procedure, maintaining the simplicity of the direct injection method, at the expense of a little increase in the duration of the concentration-determination step. LOQs attained in this
research are also lower than those attained for GLY and AMPA
considering SPE on-line connected to cationic exchange LC, postcolumn derivatization and fluorescence detection [21]. To the best
Value
AMPA
GLY
Fosetyl
Maximum
Median
Average
Positive samples (%)
Samples above 100 ng L−1 (%)
1505.6
44.2
110.7
88
20
3027.5
26.9
204.7
38
6
141.1
8.8
26.3
12
2
of our knowledge, the lowest LOQs achieved for GLY, AMPA and
GLU in surface water corresponded to the combination of FMOC–Cl
compounds derivatization followed by concentration of samples in
reversed-phase type sorbents, either in the off-line [11], or on-line
modes [10,12]. The above approaches reported LOQs in the range
between 0.7 to 5 ng L−1 . On the other hand, compounds derivatization was time-consuming and these methods do not cover the
determination of Fosetyl and MPPA, since they do not react with
FMOC–Cl.
3.3. Occurrence of pesticides in surface water samples
Levels of target compounds in processed samples are given
as supplementary information, Table S3. Out of six investigated
species, only AMPA, GLY and Fosetyl were noticed. Table 3 summarizes their maximum, median and average concentrations, together with the percentage of positive samples and those above
the environmental threshold of 100 ng L−1 . Fig. S4 shows the chromatograms corresponding to quantification and qualification transitions of Fosetyl, AMPA and GLY for a non-spiked sample (sampling point S9, 2nd campaign, Table S2) containing concentrations
of these compounds in the range from 8.6 ng L−1 (Fosetyl) to
61.1 ng L−1 (AMPA). AMPA was the compound showing the highest
prevalence, with a detection frequency of 88% and a median concentration of 44.2 ng L−1 . Although relatively low, this value is similar to those affecting the embryogenic development of amphibians [27]. GLY showed the highest maximum concentration, with a
5
J. López-Vázquez, L. Pérez-Mayán, V. Fernández-Fernández et al.
Journal of Chromatography A 1687 (2022) 463697
Fig. 3. MRM chromatograms for quantification (Q1, left) and qualification transitions (Q2 to Q3, center to right) of target compounds for a 20 ng L-1 standard prepared in
ultrapure water. A. Fosetyl. B. AMPA. C. GLU. D. GLY. E. NAG. F. MPPA.
6
J. López-Vázquez, L. Pérez-Mayán, V. Fernández-Fernández et al.
Journal of Chromatography A 1687 (2022) 463697
Fig. 4. Seasonal variations in the concentrations of AMPA in sampling points affected (S1, S15) and not affected (S14 and average of S5, S6, S9 and S11) by municipal STPs
discharges of treated wastewater.
level above 30 0 0 ng L−1 in one of the streams draining the hilly
vineyard area; however, the median value (26.9 ng L−1 ) and the
percentage of positive samples for this compound (38%) remained
below those obtained for AMPA. This trend is coherent with the
higher environmental stability of the later species versus the parent herbicide [7], and potential formation of AMPA from additional precursor molecules. Finally, Fosetyl was the pesticide showing the lowest median concentration (8.8 ng L−1 ) as well as the
smaller percentage of samples above methods´ LOQs (12%). Globally, residues of AMPA and GLY found in the set of processed samples stay 1–2 orders of magnitude below those reported in geographic areas, such as USA and South America, where GLY resistant
crops are authorized [8,9]. On the other hand, the detection frequencies and average concentrations of both compounds are higher
than those corresponding to time-average samples of surface water
from agriculture and residential areas in Germany [6].
As regards their geographic distribution, AMPA and GLY were
ubiquitous in samples obtained from Limia river (sampling points
S16 and S17), whereas Fosetyl remained below method LOQs in
this area. Concentrations of the parent pesticide and its degradation product decreased from points S16 to S17 (Table S3), likely
due to dilution with the tributary channel joining the main river
downstream point S16, Fig. 1. AMPA was also noticed in most samples from the two other investigated areas, except in those obtained from a ground water spring (S10), where all compounds remained undetected. GLY was measured in some surface water samples from the vineyard and the residential areas, with the higher
concentrations found in small streams.
The residues of AMPA quantified in sampling points affected by
discharges of treated wastewater (codes S1 and S15) were higher
than in the rest of surface and spring water from the vineyard
and the residential areas, Table S2. Moreover, they increased from
spring (1st sampling campaign) to summer (4th campaign), as the
flow of streams receiving the discharges from STP decreased significantly, Fig. 4. On the other hand, the average residues of AMPA at
sampling points S5, S6, S9 and S11, placed in a large dam containing a practically constant volume of 52 cubic hectometers of water,
remained constant during the four sampling campaigns, Fig. 4. This
temporal profile of concentrations is coherent with the formation
of AMPA not only from GLY, but also from phosphate compounds
used in the formulation of detergents during treatment of munic-
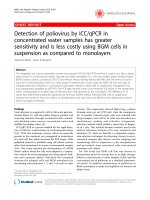
Fig. 5. A, mass flows (g day-1 ) of GLY and AMPA in sampling point S17 (Limia river).
B, mass flow of AMPA (g day-1 ) in sampling points S2 and S4 (Avia river).
ipal wastewater, as it has been already pointed out by other authors [11]. Comparison of AMPA levels in samples from the same
river (Tinto river), downstream and upstream the discharge of the
municipal STP (sampling points S15 and S14), in a residential area,
point out again to the contribution of these facilities to the release
of AMPA in the aquatic environment, Fig. 4.
Fig. 5A shows the mass flow (g day−1 ) of AMPA and GLY at
point S17, during the three sampling campaigns. Those for AMPA in
points S2 and S4, during four campaigns, are presented in Fig. 5B.
7
J. López-Vázquez, L. Pérez-Mayán, V. Fernández-Fernández et al.
Journal of Chromatography A 1687 (2022) 463697
Depicted data reflect the total release of compounds in the aquatic
environment, independently of the flow of water courses. In Limia
river (point S17), draining the flat, intensive agriculture production
area, the release of GLY and AMPA clearly decreased from spring
to autumn. On the other hand, the mass flows of AMPA in Avia
river (sampling points S2 and S4) were more homogeneous, with
the highest value observed in June.
References
[1] F. Veiga, J.M. Zapata, M.L. Fernandez Marcos, E. Alvarez, Dynamics of
glyphosate and aminomethylphosphonic acid in a forest soil in Galicia,
north-west Spain, Sci. Total Environ. 271 (2001) 135–144, doi:10.1016/
S0 048-9697(0 0)0 0839-1.
[2] O. Delhomme, A. Rodrigues, A. Hernandez, S. Chimjarn, C. Bertrand,
M. Bourdat-Deschamps, C. Fritsch, C. Pelosi, S. Nélieu, M. Millet, A method
to assess glyphosate, glufosinate and aminomethylphosphonic acid in soil and
earthworms, J. Chromatogr. A. 1651 (2021) 462339, doi:10.1016/j.chroma.2021.
462339.
[3] PPDB: pesticide properties DataBase, (n.d.). />ppdb/en/Reports/373.htm (accessed October 9, 2022).
[4] O.K. Borggaard, A.L. Gimsing, Fate of glyphosate in soil and the possibility
of leaching to ground and surface waters : a review, Pestic. Manag. Sci. 456
(2008) 441–456, doi:10.1002/ps.1512.
[5] L. Simonsen, I.S. Fomsgaard, B. Svensmark, N.H. Spliid, Fate and availability of
glyphosate and AMPA in agricultural soil, J. Environ. Sci. Heal. Part B. 43 (2008)
365–375, doi:10.1080/036012308020620 0 0.
[6] N. Tauchnitz, F. Kurzius, H. Rupp, G. Schmidt, B. Hauser, M. Schrödter, R. Meissner, Assessment of pesticide inputs into surface water by agriculture and urban sources- a case study in the Querne/Weida catchment, central Germany,
Environ. Pollut. 267 (2020) 115186, doi:10.1016/j.envpol.2020.115186.
[7] V.C. Aparicio, E. De Gerónimo, D. Marino, J. Primost, P. Carriquiriborde,
J.L. Costa, Environmental fate of glyphosate and aminomethylphosphonic acid
in surface waters and soil of agricultural basins, Chemosphere 93 (2013) 1866–
1873, doi:10.1016/j.chemosphere.2013.06.041.
[8] D.J. Pérez, F.G. Iturbure, G. Calderon, L.A.E. Oyesqui, E. De Gerónimo, V.C. Aparicio, Ecological risk assessment of current-use pesticides and biocides in soils,
sediments and surface water of a mixed land-use basin of the Pampas region,
Argentina, Chemosphere 263 (2021) 128061, doi:10.1016/j.chemosphere.2020.
128061.
[9] L. Medalie, N.T. Baker, M.E. Shoda, W.W. Stone, M.T. Meyer, E.G. Stets, M. Wilson, Influence of land use and region on glyphosate and aminomethylphosphonic acid in streams in the USA, Sci. Total Environ. 707 (2020) 136008,
doi:10.1016/j.scitotenv.2019.136008.
[10] M. Ibáđez, Ĩ.J. Pozo, J.V. Sancho, F.J. López, F. Hernández, Residue determination of glyphosate, glufosinate and aminomethylphosphonic acid in water and
soil samples by liquid chromatography coupled to electrospray tandem mass
spectrometry, J. Chromatogr. A. 1081 (2005) 145–155, doi:10.1016/j.chroma.
2005.05.041.
[11] I. Hanke, H. Singer, J. Hollender, Ultratrace-level determination of glyphosate,
aminomethylphosphonic acid and glufosinate in natural waters by solid-phase
extraction followed by liquid chromatography-tandem mass spectrometry: performance tuning of derivatization, enrichment and detection, Anal. Bioanal.
Chem. 391 (2008) 2265–2276, doi:10.1007/s00216- 008- 2134- 5.
[12] T. Poiger, I.J. Buerge, A. Bächli, M.D. Müller, M.E. Balmer, Occurrence of the
herbicide glyphosate and its metabolite AMPA in surface waters in Switzerland
determined with on-line solid phase extraction LC-MS/MS, Environ. Sci. Pollut.
Res. 24 (2017) 1588–1596, doi:10.1007/s11356- 016- 7835- 2.
[13] T. Arkan, I. Molnár-Perl, Advances in the alkylsilyl derivatization of
glyphosate and aminomethylphosphonic acid: a critical comeback to the Ntert.-butyldimethylsilyl-N-methyltrifluoroacetamide reagent, Microchem. J. 132
(2017) 262–267, doi:10.1016/j.microc.2017.02.004.
[14] A. Connolly, S. Koslitz, D. Bury, T. Brüning, A. Conrad, M. Kolossa-Gehring,
M.A. Coggins, H.M. Koch, Sensitive and selective quantification of glyphosate
and aminomethylphosphonic acid (AMPA) in urine of the general population
by gas chromatography-tandem mass spectrometry, J. Chromatogr. B Anal.
Technol. Biomed. Life Sci. 1158 (2020) 122348, doi:10.1016/j.jchromb.2020.
122348.
[15] H. Guo, L.S. Riter, C.E. Wujcik, D.W. Armstrong, Direct and sensitive determination of glyphosate and aminomethylphosphonic acid in environmental
water samples by high performance liquid chromatography coupled to electrospray tandem mass spectrometry, J. Chromatogr. A. 1443 (2016) 93–100,
doi:10.1016/j.chroma.2016.03.020.
[16] E. Okada, T. Coggan, T. Anumol, B. Clarke, G. Allinson, A simple and rapid direct
injection method for the determination of glyphosate and AMPA in environmental water samples, Anal. Bioanal. Chem. 411 (2019) 715–724, doi:10.1007/
s00216- 018- 1490- z.
[17] L. Pérez-Mayán, G. Castro, M. Ramil, R. Cela, I. Rodríguez, Approaches to
liquid chromatography tandem mass spectrometry assessment of glyphosate
residues in wine, Anal. Bioanal. Chem. 414 (2021) 1445–1455, doi:10.1007/
s00216-021-03775-w.
[18] Y. Geng, L. Jiang, D. Zhang, B. Liu, J. Zhang, H. Cheng, L. Wang, Y. Peng,
Y. Wang, Y. Zhao, Y. Xu, X. Liu, Glyphosate, aminomethylphosphonic acid,
and glufosinate ammonium in agricultural groundwater and surface water in
China from 2017 to 2018: occurrence, main driver, and environmental risk assessment, Sci. Total Environ. 769 (2021) 144396, doi:10.1016/j.scitotenv.2020.
144396.
[19] U. Jost, F. Habedank, Two-dimensional hydrophilic interaction and reversed
phase liquid chromatography easily extracted pesticides and polar pesticides
multi-residue method––a concept, J. Chromatogr. A. 1621 (2020) 461040,
doi:10.1016/j.chroma.2020.461040.
[20] S. Dovidauskas, I.A. Okada, F.R. dos Santos, Validation of a simple ion
chromatography method for simultaneous determination of glyphosate,
aminomethylphosphonic acid and ions of Public Health concern in water in-
4. Conclusions
The on-line combination of SPE, using a PEEK-lined strong anionic exchange cartridge, with an analytical column containing
same stationary phase permitted the sensitive, automated determination of six Zwitterionic pesticides in environmental water samples, without any previous sample pretreatment, except filtration.
The procedure achieved LOQs between 5 and 20 ng L−1 , with acceptable accuracy values (calculated recoveries from 71% to 126%
in all samples, but one), and limited effect of the sample matrix in
the responses of target compounds. Thus, it represents a significant
improvement compared to direct injection methods using same LC
separation mechanism, and a much faster option than FMOC–Cl
based derivatization approaches. Analysis of surface water samples, obtained in a residential area and two agriculture basins with
different types of crops, showed the presence of AMPA, GLY and,
less often, Fosetyl in this environmental compartment. The lower
levels of AMPA and GLY were noticed in springs of groundwater,
whilst the higher concentrations of AMPA were associated to STPs
affected streams and rivers. Further studies should assess the origin of AMPA noticed in this kind of water courses, including the
search of additional precursors to GLY.
Declaration of Competing Interest
The authors declare that they have no known competing financial interests or personal relationships that could have appeared to
influence the work reported in this paper.
CRediT authorship contribution statement
J. López-Vázquez: Investigation, Methodology, Writing – review
& editing. L. Pérez-Mayán: Investigation, Methodology, Writing –
review & editing. V. Fernández-Fernández: Formal analysis, Writing – review & editing. R. Cela: Conceptualization, Funding acquisition. I. Rodríguez: Conceptualization, Supervision, Funding acquisition, Writing – original draft.
Data availability
Data will be made available on request.
Acknowledgments
L.P.M thanks a FPU grant to the Spanish Ministry of Science.
This study was supported by Spanish Government and Xunta de
Galicia through grants PGC2018–094613-B-I00 and ED431C 2021/06,
respectively. Both projects are co-funded by the EU FEDER program. We acknowledge Agilent for providing access to LC-ESIMS/MS instrumentation and technical assistance with anionic exchange LC separations.
Supplementary materials
Supplementary material associated with this article can be
found, in the online version, at doi:10.1016/j.chroma.2022.463697.
8
J. López-Vázquez, L. Pérez-Mayán, V. Fernández-Fernández et al.
Journal of Chromatography A 1687 (2022) 463697
tended for human consumption, J. Chromatogr. A. 1632 (2020) 461603, doi:10.
1016/j.chroma.2020.461603.
[21] J. Patsias, A. Papadopoulou, E. Papadopoulou-Mourkidou, Automated trace level
determination of glyphosate and aminomethyl phosphonic acid in water by
on-line anion-exchange solid-phase extraction followed by cation-exchange
liquid chromatography and post-column derivatization, J. Chromatogr. A. 932
(2001) 83–90, doi:10.1016/S0021- 9673(01)01253- 5.
[22] C. Hao, D. Morse, F. Morra, X. Zhao, P. Yang, B. Nunn, Direct aqueous
determination of glyphosate and related compounds by liquid chromatography/tandem mass spectrometry using reversed-phase and weak anionexchange mixed-mode column, J. Chromatogr. A. 1218 (2011) 5638–5643,
doi:10.1016/j.chroma.2011.06.070.
[23] J.L. Hidalgo-Ruiz, R. Romero-González, J.L. Martínez Vidal, A. Garrido Frenich,
Monitoring of polar pesticides and contaminants in edible oils and nuts by
liquid chromatography-tandem mass spectrometry, Food Chem 343 (2021),
doi:10.1016/j.foodchem.2020.128495.
[24] G. Jia, J. Xu, X. Long, S. Ge, L. Chen, D. Hu, Y. Zhang, Enantioselective
degradation and chiral stability of Glufosinate in soil and water samples
and formation of 3-Methylphosphinicopropionic acid and N-Acetyl-glufosinate
metabolites, J. Agric. Food Chem. 67 (2019) 11312–11321, doi:10.1021/acs.jafc.
9b01028.
[25] J.J. Hsiao, O.G. Potter, T. Chu, H. Yin, Improved LC/MS Methods for the Analysis
of Metal-Sensitive Analytes Using Medronic Acid as a Mobile Phase Additive,
(2018). doi:10.1021/acs.analchem.8b02100.
[26] B. Claude, C. Berho, S. Bayoudh, L. Amalric, E. Coisy, R. Nehmé, P. Morin,
Preliminary recovery study of a commercial molecularly imprinted polymer
for the extraction of glyphosate and AMPA in different environmental waters using MS, Environ. Sci. Pollut. Res. 24 (2017) 12293–12300, doi:10.1007/
s11356- 017- 8844- 5.
[27] M. Cheron, F. Brischoux, Aminomethylphosphonic acid alters amphibian embryonic development at environmental concentrations, Environ. Res. 190
(2020) 109944, doi:10.1016/j.envres.2020.109944.
9