Báo cáo Y học: Apolipoprotein E predisposes to obesity and related metabolic dysfunctions in mice pdf
Bạn đang xem bản rút gọn của tài liệu. Xem và tải ngay bản đầy đủ của tài liệu tại đây (367.95 KB, 14 trang )
Apolipoprotein E predisposes to obesity and related
metabolic dysfunctions in mice
Iordanes Karagiannides
1,2
, Rami Abdou
1
, Aikaterini Tzortzopoulou
1
, Peter J. Voshol
3
and Kyriakos E. Kypreos
1,4
1 Whitaker Cardiovascular Institute, Boston University School of Medicine, MA, USA
2 Beth Israel Deaconess Medical Center, Gastrointestinal Neuropeptide Center, Division of Gastroenterology, Harvard Medical School,
Boston, MA, USA
3 Department of Endocrinology, Leiden University Medical Center, The Netherlands
4 Department of Medicine, Pharmacology Unit, University of Patras Medical School, Rio, Greece
Obesity and its related pathologies constitute a major
cause of death, with rates increasing at an alarming
pace [1]. By the beginning of the millennium, over-
weight adults accounted for over 15% of the world’s
population (body mass index > 30, World Health
Organization) [2], with this number increasing to 50%
within the USA and Europe [3]. Obesity develops as a
result of disruption of the homeostasis between food
intake and energy expenditure, and therefore factors
affecting these processes are the focus of extensive
Keywords
ApoE3
knock-in
mice; apolipoprotein E;
glucose intolerance; insulin resistance;
obesity
Correspondence
K. E. Kypreos, Department of Medicine,
Pharmacology Unit, University of Patras
Medical School, Panepistimioupolis, Rio,
TK 26500, Greece
Fax: +30 2610996103
Tel: +30 2610969120
E-mail:
(Received 23 February 2008, revised 25 July
2008, accepted 30 July 2008)
doi:10.1111/j.1742-4658.2008.06619.x
Obesity is a central feature of the metabolic syndrome and is associated
with increased risk for insulin resistance and type II diabetes. Here, we
investigated the contribution of human apoliprotein E3 and mouse apoli-
protein E to the development of diet-induced obesity in response to
western-type diet. Our data show that apolipoprotein E contributes to the
development of obesity and other related metabolic disorders, and that
human apolipoprotein E3 is more potent than mouse apolipoprotein E in
promoting obesity in response to western-type diet. Specifically, we found
that apolipoprotein E3 knock-in mice fed western-type diet for 24 weeks
became obese and developed hyperglycemia, hyperinsulinemia, hyperleptin-
emia, glucose intolerance and insulin resistance that were more severe than
in C57BL/6 mice. In contrast, apolipoprotein E-deficient mice fed western-
type diet for the same period were resistant to diet-induced obesity, had
normal plasma glucose, leptin and insulin levels, and exhibited normal
responses to glucose tolerance and insulin resistance tests. Furthermore,
low-density lipoprotein receptor-deficient mice were more sensitive to the
development of diet-induced obesity and insulin resistance than apolipo-
protein E-deficient mice, but were still more resistant than C57BL/6 mice,
raising the possibility that low-density lipoprotein receptor mediates, at
least in part, the effects of apolipoprotein E on obesity. Taken together,
our findings suggest that, in addition to other previously identified mecha-
nisms of obesity, apolipoprotein E and possibly the chylomicron pathway
are also important contributors to the development of obesity and related
metabolic dysfunctions in mice.
Abbreviations
ApoE, apolipoprotein E; ApoE
)/),
ApoE-deficient; ApoE3
knock-in
mice, mice containing a targeted replacement of the mouse ApoE gene for
the human ApoE3 gene; GTT, glucose tolerance test; IST, insulin sensitivity test; LDLr, low-density lipoprotein receptor; LDLr
)/)
, LDLr-
deficient; LpL, lipoprotein lipase; VLDL, very low-density lipoprotein.
4796 FEBS Journal 275 (2008) 4796–4809 ª 2008 The Authors Journal compilation ª 2008 FEBS
research for the development of effective antiobesity
drugs, with only limited success being achieved thus
far [4]. Aging, hormonal imbalance and genetic predis-
position may also contribute to obesity [5–16]. How-
ever, very few cases of human obesity are reported to
be caused by genetic factors [17], leaving western-type
diet and sedentary lifestyle, physical inactivity and
imbalance in caloric load as the most common contrib-
utors to the development of central obesity and the
metabolic syndrome [2,18].
The risk of developing all other components of the
metabolic syndrome increases with obesity, supporting
the hypothesis that obesity is the central feature of the
syndrome [19]. It is well established that abdominal
obesity may result in insulin resistance and hyperinsu-
linemia [19,20]. Epidemiological and population studies
have established a direct correlation between obesity
and the development of cardiovascular disease [21,22].
Despite the pivotal role of obesity and dyslipidemia in
the development of the metabolic syndrome and heart
disease, the functional interactions between adipose
tissue and the lipid and lipoprotein transport system
have not yet been investigated thoroughly.
Apolipoprotein E (ApoE) is a 34.2 kDa glycoprotein
synthesized by the liver and other peripheral tissues. In
humans, there are three major natural isoforms, ApoE2,
ApoE3, and ApoE4 [23], with ApoE3 being the most
common [23–29]. ApoE is a major protein component
of chylomicron remnants and very low-density lipopro-
tein (VLDL) [23]. The importance of this protein in the
maintenance of plasma lipid homeostasis and athero-
protection was first established with the generation of
the ApoE-deficient mouse [30,31], which develops
hypercholesterolemia and spontaneous atherosclerosis
[30,31]. Lipid-bound ApoE is the natural ligand of the
low-density lipoprotein receptor (LDLr) [32–34], a cell
surface receptor that is responsible for the catabolism of
atherogenic lipoproteins [32,35–37].
In this study, we sought to determine the role of
ApoE in the development of diet-induced obesity, glu-
cose intolerance and insulin resistance in vivo. To
address this question, female ApoE3
knock-in
, wild-type
C57BL/6, LDLr-deficient (LDLr
)/)
) and ApoE-defi-
cient (ApoE
)/)
) mice were fed western-type diet for a
period of 15 or 24 weeks, during which time their
plasma lipid and glucose levels, body weight, body com-
position, glucose tolerance and insulin sensitivity were
monitored. We chose to study ApoE3 because it is the
most common ApoE isoform in humans [24–29]. Our
data establish that expression of ApoE predisposes mice
to diet-induced obesity, hyperglycemia and insulin resis-
tance, whereas deficiency in ApoE renders mice resistant
to these conditions. Human ApoE3 appeared to be more
potent than mouse ApoE in promoting obesity in
response to western-type diet. Furthermore, LDLr
)/)
mice were more sensitive to the development of diet-
induced obesity and insulin resistance than ApoE
)/)
mice, but still more resistant than wild-type C57BL/6
mice in response to western-type diet. Gavage adminis-
tration of olive oil containing the nonhydrolyzable
[
3
H]cholesteryl-hexadecyl-ether to mice suggested that
deficiency in LDLr and ApoE reduces the direct delivery
of postprandial nonhydrolyzed lipids to the liver, one of
the major tissues involved in glucose uptake from the
circulation. A similar trend was also observed in the
delivery of nonhydrolyzed dietary lipids to adipose
tissue. Taken together, our data establish that ApoE is
a key mediator of diet-induced obesity in response to
western-type diet.
Results
ApoE promotes diet-induced weight gain in mice,
whereas ApoE deficiency prevents it
To test the effects of ApoE on weight gain in mice,
groups of 4–6 weeks old female ApoE3
knock-in
, ApoE
)/)
and wild-type C57BL/6 mice were placed on western-
type or normal chow diet for a total period of
24 weeks. Mice in each group were weighed immedi-
ately before the initiation of the experiment (week 0)
and every 6 weeks thereafter up to week 24, using a
Mettler precision microscale.
It became apparent that as early as 6 weeks on high-
fat diet, ApoE3-expressing mice gained weight and
were significantly heavier than the wild-type C57BL/6
mice on the same diet (Fig. 1A). The weight of the
ApoE3
knock–in
mice was 31.37 ± 3.98 g (115 ± 34%
higher than their initial weight of 17.03 ± 0.94 g,
P < 0.05) (Fig. 1A). During the same period, C57BL/
6 mice on a high-fat diet had an average body weight
of 26.08 ± 1.89 g (66 ± 8% higher than their initial
weight of 16.26 ± 0.61 g, P < 0.05) (Fig. 1A). There
were no statistical differences between the weights of
the ApoE3
knock-in
and C57BL/6 control groups fed
chow diet for 6 weeks (data not shown).
At week 24 on high-fat diet, ApoE3-expressing mice
showed a dramatic increase in body weight, with an
average value of 50.23 ± 2.22 g (235 ± 32% higher
than their starting weight at week 0, P < 0.05)
(Fig. 1A). The body weight of the C57BL/6 mice was
43.10 ± 0.94 g (164 ± 9% higher than their starting
weight at week 0, P < 0.05) (Fig. 1A). The control
ApoE3
knock-in
and C57BL/6 mouse groups on chow diet
showed a much smaller increase in body weight, ranging
between 22 and 24 g (29 ± 6% increase as compared to
I. Karagiannides et al. ApoE and obesity
FEBS Journal 275 (2008) 4796–4809 ª 2008 The Authors Journal compilation ª 2008 FEBS 4797
their starting weight at week 0, P < 0.05) (data not
shown). In contrast to the ApoE3
knock-in
and the
C57BL/6 mice, ApoE
)/)
mice that were fed western-type
diet showed only a modest increase in body weight dur-
ing the course of the experiment (Fig. 1A). At week 6 of
the experiment, the ApoE
)/)
mouse group had an aver-
age body weight of 20.36 ± 1.37 g (32 ± 6% increase
as compared to their starting weight of 16.26 ± 0.61 g
at week 0, P < 0.05). At week 24, their body weight
was 24.58 ± 1.07 g (41 ± 4% increase as compared to
their starting weight at week 0, P < 0.05) (Fig. 1A).
Similar increases in body weight were observed in the
control ApoE
)/)
mice fed chow diet (data not shown).
To compare the steady-state plasma ApoE levels
between ApoE3
knock-in
and C57BL/6 mice, at week 0
of the experiment plasma samples were isolated from
three mice from each group and 5 lL of plasma was
analyzed by western blotting using a polyclonal
antibody that recognizes both human and mouse
ApoE (Santa-Cruz Biotech, Santa Cruz, CA, USA;
cat. no. sc-31821). This analysis showed that C57BL/6
mice had approximately four-fold higher steady-state
plasma ApoE levels than ApoE3
knock-in
mice, suggest-
ing that the increased sensitivity of ApoE3
knock-in
mice
to obesity is not due to higher plasma ApoE levels in
these mice compared to C57BL/6 mice (Fig. 1B).
To determine whether body weight differences
among groups fed western-type diet could be explained
by differences in their average daily food consumption,
at week 12 of the experiment we determined the
average daily food consumption for each mouse group.
It was found that ApoE3
knock-in
mice consumed
0 6
12 18
24
0
250
500
750
1000
1250
1500
Cholesterol (mg·dL
–1
)
A
C
B
0
6121824
0
25
50
75
Triglycerides (mg·dL
–1
)
0
6121824
0
400
300
200
100
ApoE3
knock in
ApoE
Ponseau S
ApoE3
knock in
ApoE3
knock in
ApoE3
knock in
C57BL/6
C57BL/6
apoE
–/–
ApoE3
knock in
C57BL/6
apoE
–/–
C57BL/6
C57BL/6
ApoE
–/–
apoE
–/–
ApoE3
knock in
C57BL/6
ApoE
–/–
% of initial
body-weight
Weeks Weeks
Weeks
*
*
*
*
*
**
*
0
10
20
30
40
50
**
*
*
*
% body TG content
D
E
0
25
50
75
100
125
150
175
week 0
week 24
**
**
**
**
**
Fasting plasma
glucose (mg·dL
–1
)
F
3213
2
1
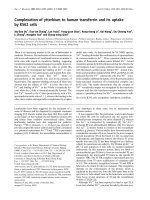
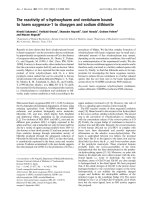
Fig. 1. Percentage of initial body weight (A), plasma ApoE levels (B), plasma cholesterol levels (C) and plasma triglyceride levels (D) of
C57BL/6, ApoE3
knock-in
and ApoE
)/)
mice fed western-type diet for a period of 24 weeks. (E) Percentage body fat content of ApoE3
knock-in
,
ApoE
)/)
and C57BL/6 mice at week 24. (F) Fasting plasma glucose levels of ApoE3
knock-in
, ApoE
)/)
and C57BL/6 mice at weeks 0 and 24.
Each point on the graphs represents the mean value of the group, and error bars indicate the SEM. The statistical significance of the
observed differences among groups at each time-point is as indicated (*P < 0.05; **P < 0.005). In (B), plasma ApoE levels in ApoE3
knock-in
and ApoE
)/)
mice were determined by western blot analysis using an antibody that recognizes equally mouse ApoE and human ApoE.
Ponceau S staining of the nitrocellulose membrane was used to confirm equal loading and efficient transfer of proteins to the membrane.
ApoE and obesity I. Karagiannides et al.
4798 FEBS Journal 275 (2008) 4796–4809 ª 2008 The Authors Journal compilation ª 2008 FEBS
3.04 ± 0.13 g per mouse per day, C57BL/6 mice con-
sumed 3.31 ± 0.15 g per mouse per day, and ApoE
)/)
mice consumed 3.19 ± 0.17 g per mouse per day, and
there was no statistical difference among groups
(P > 0.05).
Plasma lipid levels of the mice fed western-type
diet for 24 weeks
During the 24-week period of feeding mice with
western-type diet, fasting plasma samples were taken
every 6 weeks, and cholesterol, triglyceride and free
fatty acid levels were measured as described in
Experimental procedures. As shown in Fig. 1C, at
week 24 both ApoE3
knock in
and C57BL/6 mice on
high-fat diet had slightly elevated fasting cholesterol
levels (138 ± 10 mgÆdL
)1
and 188 ± 14 mgÆdL
)1
respectively) as compared to their starting cholesterol
levels at week 0 (50 ± 3 mgÆdL
)1
and 54 ±
6mgÆdL
)1
, respectively), whereas their plasma triglyc-
eride levels remained normal (24 ± 7 mgÆdL
)1
and
24 ± 5 mgÆdL
)1
, respectively) (Fig. 1D). FPLC anal-
ysis of plasma from these mice showed that the
small increases in the cholesterol levels of these mice
at week 24 were due to a minor accumulation of
chylomicron and VLDL remnants (Fig. 2A,B). In
contrast, ApoE
)/)
mice showed a dramatic increase
in their plasma cholesterol levels during the course
of the experiment (Fig. 1C). At week 24 of the
experiment, plasma cholesterol levels of the ApoE
)/)
mice were 1064 ± 198 mgÆdL
)1
(Fig. 1C), whereas
their plasma triglyceride levels remained normal
(52 ± 28 mgÆdL
)1
at week 24) (Fig. 1D). FPLC
analysis showed that the hypercholesterolemia of
these mice was due to increased accumulation of
triglyceride-containing cholesterol-rich chylomicron
remnants (Fig. 2A,B). No significant difference in the
plasma free fatty acid levels among groups was
observed during the course of the experiment. At
week 24, plasma free fatty acid levels of the
ApoE3
knock-in
, C57BL/6 and ApoE
)/)
mice were
0.89 ± 0.08 mmol equiv., 0.81 ± 0.05 mmol equiv.,
and 0.99 ± 0.08 mmol equiv., respectively.
Body composition analysis of the mice fed
western-type diet for 24 weeks
At the end of the 24-week period on western-type diet,
at least six mice from each group (ApoE3
knock-in
,
ApoE
)/)
and C57BL/6 mice) were killed. The total
weight, dry weight, water content, lipid content and
lean body mass of the mice were determined as
described in Experimental procedures. As shown in
Fig. 1E, this analysis established that ApoE3
knock-in
mice had a total body lipid content of 39 ± 4%. The
wild-type C57BL/6 mice had a significantly lower total
body lipid content of 32 ± 3% (P < 0.05). Thus, the
increased body weight of the ApoE3
knock-in
and
C57BL/6 mice reflects excess accumulation of adipose
tissue in these mice. In contrast, ApoE
)/)
mice
remained lean during the course of the experiment,
with a total body fat content of 11 ± 1% (Fig. 1E,
P < 0.005). The complete body composition analysis
of the mice fed western-type diet for 24 weeks is sum-
marized in Table 1.
Diet-induced obesity in ApoE3
knock-in
and C57BL/6
mice is associated with elevated plasma glucose,
insulin and leptin levels
Epidemiological and animal studies have established
that central obesity is associated with glucose intoler-
ance and insulin resistance [20]. In addition, obesity is
accompanied by increased levels of leptin [38], a hor-
mone that reduces appetite and may function as the
link between obesity and hypertension in individuals
with the metabolic syndrome [39,40].
To determine whether the obesity observed in
ApoE3
knock-in
and C57BL/6 mice is associated with
0
100
200
300
400
Cholesterol (mg·dL
–1
)
0 2 4
6
810
FPLC fractions
12 14 16 18 20 22 24
0246810
FPLC fractions
12 14 16 18 20 22 24
ApoE3
knock-in
C57BL/6
ApoE
–/–
ApoE3
knock-in
C57BL/6
ApoE
–/–
0
10
20
30
Week 24
Week 24
Triglycerides (mg·dL
–1
)
A
B
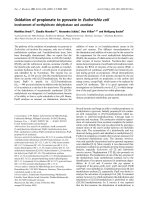
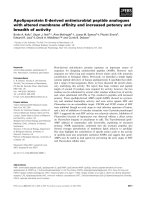
Fig. 2. Representative FPLC cholesterol (A) and triglyceride (B) pro-
files of C57BL/6, ApoE3
knock-in
and ApoE
)/)
mice fed western-type
diet for a period of 24 weeks.
I. Karagiannides et al. ApoE and obesity
FEBS Journal 275 (2008) 4796–4809 ª 2008 The Authors Journal compilation ª 2008 FEBS 4799
hyperglycemia, at weeks 0 and 24 of the experiment
mice were fasted for 16 h and plasma glucose levels
were then measured. Immediately prior to switching
mice to western-type diet (week 0), the fasting plasma
glucose levels of the ApoE3
knock-in
, ApoE
)/)
and
C57BL/6 mice were 84.2 ± 3.7 mgÆdL
)1
,
60.7 ± 2.8 mgÆdL
)1
, and 75.2 ± 3.5 mgÆdL
)1
, respec-
tively (Fig. 1F, P < 0.05). After 24 weeks on
western-type diet, ApoE3
knock-in
and control C57BL/6
mice developed hyperglycemia with fasting
glucose levels of 146.5 ± 9.1 mgÆdL
)1
(P < 0.05) and
135.4 ± 7.9 mgÆdL
)1
(P < 0.05) respectively
(Fig. 1F). In contrast, ApoE
)/)
mice, which remained
lean during the course of the experiment, had only
slightly elevated fasting glucose levels that were within
the physiological range (94.3 ± 3.22 mgÆdL
)1
,
P < 0.005). To determine plasma insulin and leptin
levels in these mice, serum samples were isolated at
weeks 0 and 24 of the experiment and analyzed for
insulin and leptin. At week 0, all three mouse groups
had similar plasma insulin levels (0.17 ± 0.05
ngÆmL
)1
for ApoE3
knock-in
mice, 0.12 ± 0.05 ngÆmL
)1
for ApoE
)/)
mice, and 0.16 ± 0.01 ngÆmL
)1
for
C57BL/6 mice). At week 24, ApoE3
knock-in
and
C57BL/6 mice had elevated plasma insulin levels, with
concentrations in the range of 4.73 ± 1.03 ngÆmL
)1
(P < 0.05) and 1.28 ± 0.32 ngÆmL
)1
(P < 0.05),
respectively. In contrast, ApoE
)/)
mice fed western-
type diet for 24 weeks had insulin levels of
0.23 ± 0.07 ngÆmL
)1
, which were similar to the levels
of ApoE
)/)
mice (0.317 ± 0.17 ngÆmL
)1
) on chow
diet for the same period of time.
Analysis of plasma leptin levels showed that at
week 0, mice had similar leptin levels: 5.90 ± 0.40
ngÆmL
)1
for ApoE3
knock-in
mice, 4.51 ± 0.32 ngÆmL
)1
for ApoE
)/)
mice, and 9.2 ± 0.30 ngÆmL
)1
for
C57BL/6 mice. At week 24, the plasma leptin levels
of the ApoE
)/)
mice were reduced to 2.1 ± 0.4
ngÆmL
)1
. In contrast, in ApoE3
knock-in
mice fed
western-type diet for 24 weeks, leptin levels increased
dramatically to 41.14 ± 1.20 ngÆmL
)1
(P < 0.005). A
similar but lower increase was also observed in
the plasma leptin levels of C57BL/6 mice fed
western-type diet for 24 weeks (34.70 ± 1.50 ngÆmL
)1
,
P < 0.005).
Diet-induced obesity in ApoE3
knock-in
and
C57BL/6 mice is associated with reduced glucose
tolerance and insulin sensitivity
To determine the role of ApoE in the development of
obesity-associated insulin resistance and glucose intol-
erance, we performed the standard glucose tolerance
test (GTT) and insulin sensitivity test (IST). The GTT
established that at week 0 all three mouse groups
(ApoE3
knock-in
, ApoE
)/)
and C57BL/6 mice) had simi-
lar normal responses to intraperitoneal administration
of glucose (Fig. 3A). However, at week 24 of the
experiment, ApoE3
knock-in
mice showed a significant
deterioration in their ability to clear plasma glucose, as
compared to C57BL/6 and ApoE
)/)
mice (Fig. 3B;
P < 0.05). A similar but less severe effect was also
observed in the C57BL/6 mice (Fig. 3A,B; P < 0.05).
Remarkably, however, ApoE
)/)
mice (which are resis-
tant to diet-induced obesity) fed western-type diet for
24 weeks cleared glucose from the circulation more
efficiently than the two other groups, and there was no
significant difference in their response to intraperito-
neal glucose load between weeks 0 and 24 on western-
type diet (compare Fig. 3A,B, P > 0.05).
In a similar fashion, when an IST was performed at
week 0, all three mouse groups exhibited a similar
response to intraperitoneal administration of insulin
(Fig. 3C). However, at week 24, ApoE3
knock-in
mice
fed western-type diet for 24 weeks displayed the poor-
est response to insulin administration as compared to
C57BL/6 and ApoE
)/)
mice (Fig. 3D; P < 0.05).
C57BL/6 mice also exhibited reduced insulin sensitivity
at week 24 that was less severe than in ApoE3
knock-in
mice (Fig. 3D; P < 0.05). In contrast, ApoE
)/)
mice
fed western-type diet for 24 weeks exhibited the highest
sensitivity to insulin of all three mouse groups
(P < 0.05). In addition, there was no significant differ-
ence in their insulin sensitivity curves between weeks 0
and 24 of the experiment (compare Fig. 3C,D;
P > 0.05).
Table 1. Body composition of ApoE3
knock-in
, C57BL/6 and ApoE
)/)
mice fed western-type diet for 24 weeks. Values are in grams expressed
as mean ± SEM.
Mouse strain Wet body weight Dry body weight Lean body mass Body fat Water
ApoE3
knock-in
50.2 ± 2.2 33.2 ± 2.0 28.9 ± 3.3 21.3 ± 1.5 17.0 ± 3.9
C57BL/6 43.1 ± 0.9 34.8 ± 1.7 28.1 ± 1.9 15.0 ± 1.6 8.3 ± 2.6
ApoE
)/)
24.6 ± 1.1 9.2 ± 0.7 22.0 ± 0.8 2.5 ± 0.3 14.4 ± 0.4
ApoE and obesity I. Karagiannides et al.
4800 FEBS Journal 275 (2008) 4796–4809 ª 2008 The Authors Journal compilation ª 2008 FEBS
LDLr
)
/
)
mice are more sensitive to diet-induced
obesity and hyperglycemia than ApoE
)
/
)
mice
but less sensitive than C57BL/6 mice
Low-density lipoprotein receptor is the major receptor
involved in the clearance of ApoE-containing lipopro-
teins from the circulation [41]. Therefore, one mecha-
nistic explanation for the role of ApoE in the
development of obesity would be that LDLr-mediated
uptake of ApoE-containing chylomicron remnants
promotes the direct deposition of dietary fat into the
adipose tissue. If this was the case, deficiency in LDLr
would prevent obesity and hyperglycemia. To address
this possibility, groups of 8–10 female LDLr
)/)
or
C57BL/6 or ApoE
)/)
mice were placed on western-
type diet for a period of 15 weeks, and their body
weight and composition, and plasma cholesterol, tri-
glyceride and glucose levels were determined during
the course of the experiment. At week 5 of the experi-
ment, the average weight of the LDLr
)/)
mice was
22.28 ± 1.32 g (29.7 ± 4.1% higher than their initial
weight of 17.13 ± 0.65 g, P < 0.05) (Fig. 4A). This
increase was comparable to the 27.4 ± 3.8% increase
observed in the ApoE
)/)
mice (from 16.83 ± 0.24 g to
21.43 ± 0.56 g, P < 0.05), but lower than the 55.4 ±
3.8% increase in the C57BL/6 mice (from
16.26 ± 0.28 g to 25.25 ± 0.50 g, P < 0.005)
(Fig. 4A). At week 15 of the experiment, however,
LDLr
)/)
mice showed an 84.5 ± 8.7% increase in
body weight (with an average final weight of
31.63 ± 2.10 g, P < 0.05) (Fig. 4A). This increase
was higher than the 51.4 ± 4.5% increase (P < 0.05)
observed in the weight of the ApoE
)/)
mice (with an
average final weight of 25.46 ± 0.55 g). However, it was
still significantly lower than the 119.8 ± 7.6% increase
observed in the weight of C57BL/6 mice (with an aver-
age final weight of 37.28 ± 0.72 g) fed western-type
diet for the same period of time (Fig. 4A; P < 0.05).
Body composition analysis at the end of the experi-
ment revealed that at week 15, LDLr
)/)
mice had a
body fat content of 19.9 ± 1.2%, which was much
higher than the body fat content of the ApoE
)/)
mice
(13 ± 1.9%, P < 0.05) but still lower than the body
fat content of the C57BL/6 mice (28.06 ± 3.92%,
P < 0.05) fed western-type diet for the same period of
time (Fig. 4D). The complete body composition analy-
sis of the mice fed western-type diet for 15 weeks is
summarized in Table 2.
Plasma lipid and glucose analysis showed that
during the 15-week period, LDLr
)/)
mice developed
severe hypercholesterolemia (1338 ± 135 mgÆdL
)1
)
that was accompanied by moderate hypertriglyceride-
mia (242.6 ± 14.9 mgÆdL
)1
) (Fig. 4B,C). Plasma
glucose levels were increased moderately (from
71.3 ± 6.7 mgÆdL
)1
to 101 ± 4.9 mgÆdL
)1
, P < 0.05)
but were still lower than the levels of C57BL/6 mice
(131 ± 5.3 mgÆdL
)1
) at week 15 of the experiment
(Fig. 4E; P < 0.005).
The GTT and IST revealed that the LDLr
)/)
mice
fed western-type diet for 15 weeks had similar toler-
ance to glucose and sensitivity to insulin as in their
starting state (week 0) (Fig. 5; P > 0.05). In addition,
there was no significant difference in the response to
intraperitoneal administration of glucose or insulin
015
30
45
60
75
apoE3
knock-in
C57BL/6
apoE
–/–
apoE3
knock-in
C57BL/6
apoE
–/–
apoE3
knock-in
C57BL/6
apoE
–/–
apoE3
knock-in
C57BL/6
apoE
–/–
90
105
120
0
100
200
300
400
0
100
200
300
400
0
50
100
150
200
0
50
100
150
200
Week 0
Week 24
Week 0
Week 24
Glucose levels (mg·dL
–1
)
Time (min)
015
30
45
60
75 90
105 120
Time (min)
015
30
45
60
75 90
105 120
Time (min)
0 153045607590105120
Time (min)
Glucose levels (mg·dL
–1
)
*
*
*
*
A
B
C
D
Glucose levels (mg·dL
–1
)
Glucose levels (mg·dL
–1
)
*
*
*
*
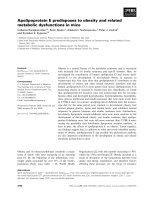
Fig. 3. Glucose tolerance curves (A, B)
and insulin sensitivity curves (C, D) of
ApoE3
knock-in
, C57BL/6 and ApoE
)/)
mice
at weeks 0 and 24. Values indicate the
average plasma glucose levels expressed as
mean ± SEM. The statistical significance of
the observed differences among groups at
each time-point is as indicated (*P < 0.05).
I. Karagiannides et al. ApoE and obesity
FEBS Journal 275 (2008) 4796–4809 ª 2008 The Authors Journal compilation ª 2008 FEBS 4801
0 5
0
500
1000
1500
2000
Cholesterol (mg·dL
–1
)
A
C
B
0 5
0
50
100
150
200
250
300
Triglycerides (mg·dL
–1
)
0
5
10
15
10 15
10
15
0
300
C57BL/6
LDLr
–/–
ApoE
–/–
C57BL/6
LDLr
–/–
ApoE
–/–
C57BL/6LDLr
–/–
ApoE
–/–
C57BL/6
LDLr
–/–
ApoE
–/–
C57BL/6
LDLr
–/–
ApoE
–/–
200
100
*
*
Weeks
Weeks
Weeks
% of initial
body-weight
*
*
*
0
25
50
75
100
125
150
175
Week 0
Week 15
Fasting plasma
glucose (mg·dL
–1
)
*
*
**
ns (P > 0.05)
*
*
**
**
E
0
10
20
30
40
50
% body TG content
*
*
*
D
Fig. 4. Percentage of initial body weight (A),
plasma cholesterol levels (B) and plasma tri-
glyceride levels (C) of C57BL/6, LDLr
)/)
and
ApoE
)/)
mice fed western-type diet for a
period of 15 weeks. (D) Percentage body fat
content of ApoE3
knock-in
, ApoE
)/)
and
C57BL/6 mice at week 15. (E) Fasting
plasma glucose levels of ApoE3
knock-in
,
ApoE
)/)
and C57BL/6 mice at weeks 0
and 15. Each point on the graphs
represents the mean value of the group,
and error bars indicate the SEM. The
statistical significance of the observed
differences among groups at each
time-point is indicated (*P < 0.05;
**P < 0.005).
Table 2. Body composition of LDLr
)/)
, ApoE
)/)
and C57BL/6 mice fed western-type diet for 15 weeks. Values are in grams expressed as
mean ± SEM.
Mouse strain Wet body weight Dry body weight Lean body mass Body fat Water
LDLr
)/)
31.6 ± 2.1 14.5 ± 2.3 25.7 ± 2.5 5.3 ± 0.7 16.4 ± 1.0
ApoE
)/)
25.5 ± 0.6 15.3 ± 1.5 19.9 ± 1.4 3.4 ± 0.6 8.0 ± 2.3
C57BL/6 37.3 ± 0.7 23.9 ± 1.2 26.9 ± 1.8 10.4 ± 1.3 13.4 ± 1.5
0 15304560759010512051
0
100
200
300
400
0
100
200
300
400
0
50
100
150
Glucose levels (mg·dL
–1
)
Time (min)
0 153045607590105120
Time (min)
0 153045607590105120
Time (min)
015
30
45
60
75 90 105
120
Time (min)
Week 0 Week 0
Week 15
Week 15
A
B
C
D
Glucose levels (mg·dL
–1
)
*
*
0
25
50
75
100
125
150
LDLr
–/–
C57BL/6
LDLr
–/–
C57BL/6
LDLr
–/–
C57BL/6
LDLr
–/–
C57BL/6
Glucose levels (mg·dL
–1
)
*
Glucose levels (mg·dL
–1
)
*
Fig. 5. Glucose tolerance curves (A, B) and
insulin sensitivity curves (C, D) of LDLr
)/)
and C57BL/6 mice at weeks 0 and 15.
Values indicate the average plasma glucose
levels expressed as mean ± SEM. The
statistical significance of the observed
differences among groups at each
time-point is as indicated (*P < 0.05).
ApoE and obesity I. Karagiannides et al.
4802 FEBS Journal 275 (2008) 4796–4809 ª 2008 The Authors Journal compilation ª 2008 FEBS
between LDLr
)/)
and C57BL/6 mice fed western-type
diet for 15 weeks (Fig. 5). Interestingly, in our studies,
feeding western-type diet to C57BL/6 for 15 weeks did
not result in insulin resistance or glucose intolerance
(Fig. 5B,D).
Taken together, these data indicate that female
LDLr
)/)
mice fed western-type diet for 15 weeks
appear to be more sensitive than female ApoE
)/)
mice
but still more resistant than female C57BL/6 mice in
the development of diet-induced obesity and its related
disorders.
ApoE promotes diet-induced accumulation of
excess triglycerides in the liver while ApoE or
LDLr deficiency does not
If ApoE and LDLr are involved in the direct delivery
of dietary lipids to tissues, one would expect that feed-
ing ApoE3
knock-in
and C57BL/6 mice western-type diet
would result in excess accumulation of triglycerides in
the liver, whereas ApoE
)/)
and LDLr
)/)
mice would
be resistant to excess hepatic triglyceride accumulation.
To test this hypothesis, we isolated liver samples from
mice fed western-type diet for 15 weeks and deter-
mined their triglyceride content (Fig. 6A).
Liver samples from ApoE
)/)
and LDLr
)/)
mice fed
western-type diet for 15 weeks had similar triglycer-
ide contents of 60.67 ± 4.12 mgÆg
)1
and 58.40 ±
5.11 mgÆg
)1
of hepatic tissue, respectively (Fig. 6A,
P > 0.05). In contrast, ApoE3
knock-in
and C57BL/6
mice had a much higher hepatic triglyceride content
(215.00 ± 33.56 mgÆg
)1
and 213.72 ± 11.89 mgÆg
)1
respectively, P < 0.05), confirming that human ApoE3,
murine ApoE, and the LDLr contribute to the accu-
mulation of excess lipids in the liver in response to
western-type diet (Fig. 6A).
Effects of ApoE and LDLr deficiency on the direct
delivery of dietary lipids to adipose tissue
As ApoE and LDLr play pivotal roles in the catabo-
lism of chylomicron remnants, we attempted to evalu-
ate the contribution of the direct delivery of
nonhydrolyzed postprandial lipids to the development
of obesity. To address this question, groups of ApoE3-
knock-in
, ApoE
)/)
, LDLr
)/)
and C57BL/6 mice that
were maintained on western-type diet for 15 weeks
were gavaged with 0.5 mL of olive oil containing
15 lCi of the nonhydrolyzable [
3
H]cholesteryl-hexade-
cyl-ether [cholesteryl-1,2-
3
H(N)]. Twenty-four hours
later, mice were killed, and visceral fat and liver sam-
ples were isolated, weighed, and homogenized. Then,
the amount of
3
H radioactivity present in the homoge-
nized tissues was determined using a liquid scintillation
counter.
ApoE3
knock-in
mice showed a higher average accu-
mulation of dietary [
3
H]cholesteryl-hexadecyl-ether in
adipose tissue (1718 ± 492 c.p.m. per gram of tissue)
than C57BL/6 mice (1010 ± 202 c.p.m. per gram of
tissue) (Fig. 6B), but this difference between the two
groups did not reach statistical significance
(P > 0.05). The hepatic accumulation of
3
H-label was
similar between these two animal groups (3181
± 585 c.p.m. per gram of tissue for the ApoE3
knock-in
mice and 3281 ± 578 c.p.m. per gram of tissue for the
C57BL/6 mice) (Fig. 6C). ApoE
)/)
and LDLr
)/)
mice
showed lower average accumulation of
3
H-label in
their fat (618 ± 41 c.p.m. per gram of tissue and
664 ± 65 c.p.m. per gram of tissue, respectively) and
hepatic tissues (1624 ± 209 c.p.m. per gram of tissue
0
cpms per gram of
hepatic tissue
B
A
0
cpms per gram of
adipose tissue
0
50
100
2500
2000
1500
1000
500
4000
3500
3000
2500
2000
1500
1000
500
150
200
250
300
apoE3
knock-in
apoE
–/–
LDLr
–/–
C57BL/6
*
**
**
*
*
mg of TG per gram of
hepatic tissue
C
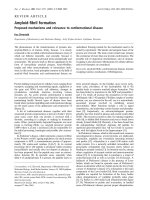
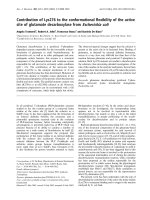
Fig. 6. (A) Hepatic triglyceride content of ApoE3
knock-in
, ApoE
)/)
,
LDLr
)/)
and C57BL/6 mice fed western-type diet for 15 weeks.
The statistical significance of the observed differences is indicated
(*P < 0.05; **P < 0.005). (B, C) Total accumulation of tritiated label
expressed as counts per minute per gram of adipose (B) or hepatic
(C) tissue, 24 h after gavage administration of 0.5 mL of olive oil
containing 15 lCi of [
3
H]hexadecyl-cholesteryl-ether, per mouse.
I. Karagiannides et al. ApoE and obesity
FEBS Journal 275 (2008) 4796–4809 ª 2008 The Authors Journal compilation ª 2008 FEBS 4803
and 1759 ± 752 c.p.m. per gram of tissue, respec-
tively) (Fig. 6B,C). No measurable radioactivity was
found in the blood of the tested mice at the time of
killing (not shown).
Discussion
ApoE is a major protein involved in the metabolism
of dietary lipids and the removal of atherogenic lipo-
proteins from the circulation. Following a lipid-rich
meal, lipids are packaged into chylomicrons which,
following partial lipolysis by lipoprotein lipase (LpL),
are converted into chylomicron remnants and acquire
ApoE [23]. Then, lipid-bound ApoE interacts with
LDLr, which mediates the removal of ApoE-contain-
ing lipoproteins from the circulation. In the present
study, we show that ApoE3
knock-in
mice are more sen-
sitive to diet-induced obesity and related metabolic
dysfunctions than wild-type C57BL/6 mice, whereas
ApoE
)/)
mice are resistant to the development of
these conditions. Furthermore, deficiency in LDLr
results in reduced sensitivity to obesity in response to
western-type diet, raising the possibility that the
effects of ApoE may be mediated, at least in part,
via its interactions with LDLr.
Interestingly, there were no significant differences in
plasma free fatty acid levels among mouse groups
(ApoE3
knock-in
versus C57BL/6 versus LDLr
)/)
versus
ApoE
)/)
), although previous studies suggested that
increased plasma levels of free fatty acids are closely
associated with obesity-induced insulin resistance
[42,43]. Moreover, daily food consumption of the
ApoE3
knock-in
, C57BL/6 and ApoE
)/)
mice was similar
among groups, suggesting that different responses to
western-type diet cannot be attributed to differences in
appetite.
One possible explanation for the increased sensitivity
of the ApoE3
knock-in
mice to diet-induced obesity
would be that higher plasma ApoE levels in these mice
than in C57BL/6 mice are responsible for the enhanced
deposition of dietary lipids in adipose tissue. To
address this possibility, we compared the ApoE levels
in plasma samples isolated from ApoE3
knock-in
and
C57BL/6 mice at week 0 of the experiment, using
western blotting. This analysis showed that steady-
state plasma ApoE levels in the ApoE3
knock-in
mice
used in our study are approximately four times lower
than those in wild-type C57BL/6 mice. Thus, the
increased sensitivity of ApoE3
knock-in
mice to diet-
induced obesity is not the result of elevated plasma
ApoE levels in these mice as compared to C57BL/6
mice, and the difference in the ability of human
ApoE3 and murine ApoE to promote obesity in
response to high-fat diet may be due to intrinsic differ-
ences between these two peptides. The data presented
in Fig. 6B raise the possibility that chylomicron and
VLDL remnants containing the human ApoE3 isoform
are taken up more avidly by adipose tissue than the
lipoproteins containing mouse ApoE.
In a previous study, Sullivan et al. [44] reported that
ApoE3
knock-in
mice and C57BL/6 mice have similar
plasma ApoE levels. Furthermore, using northern blot
analysis, they also showed that ApoE mRNA levels
were indistinguishable between ApoE3
knock-in
mice and
C57BL/6 mice, in all tissues tested except for the small
intestine, where human ApoE3 mRNA expression was
lower than mouse ApoE mRNA expression [44]. How-
ever, the ApoE3
knock-in
mice studied by these investiga-
tors are different from the ApoE3
knock-in
mice tested in
our experiments, because our ApoE3
knock-in
mice have
been bred for nine generations to the C57BL/6 back-
ground. It is possible that back-crossing ApoE3
knock-in
mice to C57BL/6 mice for nine generations resulted in
the reduced plasma human ApoE3 levels that we
observed.
Human ApoE has three natural isoforms in humans:
ApoE2, ApoE3 and ApoE4. In vitro receptor binding
studies established that lipid-bound ApoE3 and ApoE4
have a similar affinity for LDLr, whereas lipid-bound
ApoE2 has a much lower affinity [45,46]. In this study,
we focused on ApoE3, mainly because it is the most
common ApoE genetic polymorphism in humans [24–
29]. If the effects of ApoE3 on obesity are mediated by
its lipid-lowering potential via LDLr, then we expect
that both ApoE3 and ApoE4 will predispose to a simi-
lar extent to diet-induced obesity and insulin resistance
in mice, whereas ApoE2 may have a much lower
potential to promote these conditions. Further studies
are needed in order to address this point, and other
mechanisms of ApoE-promoted diet-induced obesity
should not be excluded.
It is quite interesting that in all our experiments,
plasma cholesterol levels correlated inversely with body
weight gain and body fat accumulation (Figs 1 and 4).
In the ApoE
)/)
mice, failure to clear chylomicron rem-
nants due to deficiency in ApoE resulted in a steady
increase in plasma cholester ol levels and rendered these
mice resistant to diet-induced obesity. In contrast, in
the ApoE3
knock-in
mice, the efficient catabolism of
chylomicron remnants resulted in only slightly elevated
plasma cholesterol levels, but promoted obesity, insulin
resistance and glucose intolerance. Similar to the
ApoE3
knock-in
mice, C57BL/6 mice, which express the
mouse ApoE, developed only mild hypercholesterol-
emia but became obese and insulin resistant following
western-type diet for 24 weeks.
ApoE and obesity I. Karagiannides et al.
4804 FEBS Journal 275 (2008) 4796–4809 ª 2008 The Authors Journal compilation ª 2008 FEBS
Plasma triglyceride levels of the LDLr
)/)
mice were
moderately elevated at week 0, and remained elevated
during the 15 weeks on high-fat diet, whereas plasma
triglyceride levels of the other animal groups remained
normal for the duration of the experiment. This is not
surprising, because in the absence of the LDLr,
reduced clearance of ApoE-containing lipoproteins
from the circulation results in elevated steady-state
plasma ApoE levels. Since ApoE is a known inhibitor
of LpL [47], and plasma triglyceride levels correlate
with plasma ApoE levels [48], accumulation of ApoE
in the blood of LDLr
)/)
mice results in reduced LpL-
mediated lipolysis of plasma triglycerides and hyper-
triglyceridemia.
In our studies, LDLr
)/)
mice became more obese
than ApoE
)/)
mice but less obese than C57BL/6
mice, raising the possibility that, in addition to
LDLr, other ApoE-recognizing receptors may also
promote the deposition of postprandial lipids in adi-
pose tissue, thus contributing to diet-induced obesity
and related metabolic dysfunctions. Indeed, a recent
study showed that adipose-tissue-specific deletion of
the LDLr-related protein makes mice less sensitive to
obesity [49]. In the case of the LDLr
)/)
mice, LDLr-
related protein and possibly other ApoE-recognizing
‘scavenger’ receptors may promote, to some extent,
delivery of ApoE-containing chylomicron remnants to
adipose tissue. However, in the case of the ApoE
)/)
mice, which lack the endogenous ApoE, all of these
ApoE-mediated receptor processes are blocked, and
ApoE
)/)
mice are more resistant to body fat gain
than LDLr
)/)
mice. Even though the expression of
LDLr in adipose tissue is much lower than in liver,
our data support a functional role for this receptor
in the ApoE-mediated mechanism of diet-induced
obesity.
In a previous study by Schreyer et al. [50], it was
suggested that LDLr
)/)
mice fed a diabetogenic diet
for 16 weeks were more susceptible to diet-induced
obesity and hyperglycemia than C57BL/6 mice,
whereas ApoE
)/)
mice appeared to be as susceptible
to the development of these conditions as C57BL/6
mice. Furthermore, in that study, LDLr
)/)
mice
developed severe hypertriglyceridemia during the
course of the experiment. The diabetogenic diet used
in that study contained a very high fat content of
35.5% (derived mainly from lard) (Bioserve, French-
town, NJ, USA; cat. no. F1850). In all our experi-
ments, mice were fed the standard western-type diet
containing 21.1% fat (Harlan Teklad; cat. no.
TD88137). It is possible that the high fat content of
the diabetogenic diet predisposed ApoE
)/)
, LDLr
)/)
and C57BL6 mice to the development of diet-induced
obesity, and resulted in saturation of the metabolic
pathways that control body fat deposition and
plasma lipid and glucose homeostasis. Under such
conditions, ApoE or LDLr deficiency may not be
sufficient to prevent obesity, as other mechanisms
contributing to obesity may override the protective
effect of ApoE or LDLr deletion that we observed in
our experiments. Our data on LDLr
)/)
mice are in
agreement with the data of MacDonald et al. [51],
showing that female LDLr
)/)
mice do not become
excessively obese, and do not develop hyperglycemia
and glucose intolerance in response to western-type
diet.
In our experiments, we studied the role of ApoE in
the development of obesity in response to dietary
consumption of fat, one of the major causes of
human obesity [2,18]. Our findings are supported by
previous observations by Gao et al. [52] and Chiba
et al. [53] showing that deficiency in ApoE renders
genetically predisposed obese mice less sensitive to
spontaneous development of obesity. Furthermore,
in vitro studies suggested that ApoE promotes triglyc-
eride uptake and deposition in in vitro differentiated
adipocytes and in freshly isolated adipose tissue
explants [54], whereas VLDL induces adipocyte differ-
entiation in an ApoE-dependent manner [53]. In the
present study, we report for the first time that human
ApoE3 increases susceptibility to diet-induced obesity
as compared to mouse ApoE. The functional role of
ApoE-containing chylomicron and VLDL remnants
in the development of diet-induced obesity is further
supported by the observation that ApoE
)/)
mice
remain lean when fed western-type diet for 15 or
24 weeks.
One of the hallmarks of obesity-associated insulin
resistance is the increase in the circulating levels of
insulin [55]. Such a change is also evident in our stud-
ies, further supporting the hypothesis that the benefi-
cial effects of ApoE deletion on weight loss extend to
increased insulin sensitivity. Furthermore, our data
demonstrate a significant increase in plasma leptin
levels in ApoE3
knock-in
and, to a lesser extent, in
C57BL/6 mice, an observation that is also consistent
with their increased adiposity [56].
ApoE has long been known to be atheroprotective,
mainly because of its ability to clear plasma lipids.
However, our data show that if excess dietary lipids
are present in the circulation, this atheroprotective
property of ApoE may be counteracted by the
enhanced deposition of lipids in adipose tissue. Over-
all, our findings identify ApoE expression as a key
peripheral contributor to the development of obesity
and related metabolic dysfunctions in mice.
I. Karagiannides et al. ApoE and obesity
FEBS Journal 275 (2008) 4796–4809 ª 2008 The Authors Journal compilation ª 2008 FEBS 4805
Experimental procedures
Animal studies
All mice tested in our studies were female. ApoE
)/)
[31],
LDLr
)/)
[57] and C57BL/6 mice were purchased from Jack-
son Labs (Bar Harbor, ME, USA; ).
ApoE3
knock-in
mice [44] were purchased from Taconic
Farms (Hudson River Valley, NY, USA; onic.
com). All animal models were bred on the C57BL/6 back-
ground for at least nine generations to ensure a similar
genetic background. Female mice, 4–6 weeks old, were used
in these studies, and four to five mice were housed per cage.
To ensure similar average cholesterol triglyceride and
glucose levels and starting body weights, groups of 8–10
mice were formed after determining the fasting cholesterol
triglyceride and glucose levels and body weights of the
individual mice. Mice were fed the standard western-type
diet (Harlan-Teklad, Madison, WI, USA; cat. no.
TD88137) for the indicated period, and body weight and
fasting plasma cholesterol and triglyceride levels were deter-
mined at the indicated time-points after diet initiation. At
the end of each experiment, mice were killed, and plasma
and liver samples were collected and stored at 4 °C and
)20 °C respectively. Carcasses were stored at )80 °C and
later subjected to body composition analysis as described
below. All animal studies were governed by the EU guide-
lines of the Protocol for the Protection and Welfare of Ani-
mals. In our experiments we took into consideration the
‘three Rs’ (reduce, refine, replace) and we kept the number
of animal experiments to the absolute minimum. To this
date there is no in vitro system to mimic satisfactorily the
lipid and lipoprotein transport system and the in vivo
mechanisms leading to obesity and diabetes, making the
use of experimental animals mandatory. All procedures
used in our studies cause only minimal distress to the mice
tested. The work was authorized by the appropriate com-
mittees of the Laboratory Animal Science Centers of Bos-
ton University and The University of Patras.
Plasma lipid determination
Following a 16 h fasting period, plasma samples were
isolated from the experimental mice. Plasma cholesterol,
triglyceride and free fatty acid levels were measured using
the Cholesterol Kit (Thermo Fisher Scientific, Waltham,
MA, USA), Triglyceride Determination Kit (Sigma,
St Louis, MO, USA) and NEFA C kit (Wako Diagnostics,
Richmond, VA, USA) respectively, according to the manu-
facturer’s instructions and as described previously [58].
Western blot analysis
To compare the steady-state plasma ApoE levels between
ApoE3
knock-in
and C57BL/6 mice, at week 0 of the experi-
ment plasma samples were isolated from three mice from
each group. Then, 5 lL of plasma was analyzed by 15%
SDS/PAGE and proteins were transferred to a nitrocellu-
lose membrane. Western blotting was performed using a
polyclonal antibody that recognizes both human and mouse
ApoE (Santa-Cruz Biotech, Santa Cruz, CA, USA; cat. no.
sc-31821). ApoE levels were determined by chemilumines-
cence followed by autoradiography as described previously
[58]. Prior to western blot analysis, Ponceau S staining of
the nitrocellulose membrane was used to confirm equal
loading of samples and efficient transfer of proteins to the
membrane.
FPLC analysis and lipid determination
For FPLC analysis of serum samples, 12 lL of serum was
diluted 1 : 5 with NaCl/P
i
, loaded onto a Superose 6
column in a SMART micro-FPLC system (GE-Pharmacia,
Piscataway, NJ, USA), and eluted with NaCl/P
i
. Twenty-
five fractions of 50 lL were collected for further analysis.
Triglycerides and total cholesterol in each fraction were
determined as described previously [58].
Density gradient ultracentrifugation
To separate plasma lipoproteins on the basis of their density,
serum was isolated from mice and fractionated by density
gradient ultracentrifugation, as described previously [59].
Determination of daily food consumption
Food intake was assessed by determining the difference in
food weight over a 7-day period to ensure reliable measure-
ments, as described previously [60]. Specifically, two groups
of four mice each for each mouse strain were tested. Each
day, the daily average food consumption of each group was
determined, and the average daily food consumption per
mouse was calculated for each mouse strain. Results were
then expressed as average food consumption per mouse per
strain over the 7-day period ± SEM.
Body weight determination and body mass
composition analysis
At the indicated time-points during the course of the
experiments, mice in each group were briefly anesthetized
using isofluorane, and their body weight was determined
with a Mettler precision microscale (Mettler-Toledo,
Columbus, OH, USA). At the end of each experiment, at
least six mice from each group were killed. Mouse car-
casses were weighed to determine wet weight, and then
they were dehydrated at 65 °C until a constant mass was
achieved (dry weight). The dried carcasses were then dis-
solved completely in 200 mL of ethanolic potassium
ApoE and obesity I. Karagiannides et al.
4806 FEBS Journal 275 (2008) 4796–4809 ª 2008 The Authors Journal compilation ª 2008 FEBS
hydroxide solution (5 m KOH in 50% ethanol), the pH of
the solution was adjusted to 7, and the final volume was
recorded. An aliquot of this solution was used for enzy-
matic determination of glycerol as a measure of triglycer-
ide content [58] and for total protein determination [61].
Total water content was calculated as wet weight minus
dry weight, and lean body mass was calculated as wet
weight minus total lipid weight. For hepatic triglyceride
determination, a liver sample was collected, weighed and
then dissolved in 0.5 mL of 5 m KOH in 50% ethanol
solution by overnight incubation at 65 °C. The total
amount of triglycerides was determined in the resulting
mixture as described above. Results are expressed as milli-
gram of triglycerides per gram of tissue ± SEM.
Gavage administration of olive oil containing
[
3
H]cholesteryl-hexadecyl-ether to mice
Groups of ApoE3
knock-in
, ApoE
)/)
, LDLr
)/)
and C57BL/6
mice containing 8–10 mice each were fed western-type diet
for 15 weeks. Prior to the experiment, mice were fasted
overnight for 16 h. On the next day, animals were weighed
and then anesthetized by intraperitoneal injection of sodium
pentobarbital. Anesthetized mice were gavaged with 0.5 mL
of olive oil containing 15 lCi of [
3
H]cholesteryl-hexadecyl-
ether [Cholesteryl-1,2-
3
H(N)] (Perkin Elmer, Waltham, MA,
USA; cat. no. NET859-250UC), and placed back in their
cages, where they were allowed to recover from anesthesia.
Following an additional 24 h of fasting, mice were killed,
and serum, visceral fat and liver samples were collected and
stored in liquid nitrogen. Approximately 100 mg of tissue
was then homogenized in an ethanolic solution of potassium
hydroxide (5 m KOH in 50% ethanol), the pH of the result-
ing solution was adjusted to 7, and radioactivity was mea-
sured in a liquid scintillation counter. Results are expressed
as counts per minute per gram of tissue ± SEM.
Fasting glucose determination, GTT and IST
For fasting plasma glucose determination, mice were fasted
for 16 h, and blood was then drawn from the tail vein.
Glucose was determined using the ACCU-CHEK advantage
glucometer (Roche, Nutley, NJ, USA) and comfort curve
test strips. For the GTT and IST, mice were fasted over-
night (16 h). Then, dextrose (for GTT, 1 g/kg) or insulin
(for IST, 2 UÆkg
)1
humulin; Eli-Lilly, Indianapolis, IN,
USA) were injected intraperitoneally, serum samples were
collected at 0, 15, 30, 60 and 120 min postinjection through
the tail vein, and glucose levels were measured.
Determination of plasma insulin and leptin levels
Insulin and leptin levels in the plasma of mice were deter-
mined spectrophotometrically by ELISA (Linco/Millipore,
Billerica, MA, USA; cat. no. EZRMI-13K for insulin, and
cat. no. EZML-82K for leptin).
Statistical analysis
Comparison of data from two groups of mice was per-
formed using Student’s t-test. Where more than a two-
group comparison was required, the results were analyzed
using ANOVA. Data are reported as mean ± SEM.
Acknowledgements
This work was supported by the European Commu-
nity’s Seventh Framework Programme (FP7/
2007-2013) under grant agreement PIRG02-GA-
2007-219129, and a scientist development grant (SDG
0535443T) from the American Heart Association. We
would like to thank mathematician E. Kypreos for his
advice on the statistical analysis of our results.
References
1 Mokdad AH, Marks JS, Stroup DF & Gerberding JL
(2004) Actual causes of death in the United States,
2000. JAMA 291, 1238–1245.
2 Kopelman PG (2000) Obesity as a medical problem.
Nature 404, 635–643.
3 Badman MK & Flier JS (2005) The gut and energy bal-
ance: visceral allies in the obesity wars. Science 307,
1909–1914.
4 Bray GA & Tartaglia LA (2000) Medicinal strategies in
the treatment of obesity. Nature 404, 672–677.
5 Student AK, Hsu RY & Lane MD (1980) Induction of
fatty acid synthetase synthesis in differentiating 3T3-L1
preadipocytes. J Biol Chem 255, 4745–4750.
6 Negrel R, Gaillard D & Ailhaud G (1989) Prostacyclin
as a potent effector of adipose-cell differentiation. Bio-
chem J 257, 399–405.
7 Gaillard D, Wabitsch M, Pipy B & Negrel R (1991)
Control of terminal differentiation of adipose precursor
cells by glucocorticoids. J Lipid Res 32 , 569–579.
8 Green S & Wahli W (1994) Peroxisome proliferator-
activated receptors: finding the orphan a home. Mol
Cell Endocrinol 100, 149–153.
9 Forman BM, Tontonoz P, Chen J, Brun RP, Spiegel-
man BM & Evans RM (1995) 15-Deoxy-delta-12,14-
prostaglandin J2 is a ligand for the adipocyte determi-
nation factor PPAR gamma. Cell 83, 803–812.
10 Kliewer SA, Lenhard JM, Willson TM, Patel I, Morris
DC & Lehmann JM (1995) A prostaglandin J2 metabo-
lite binds peroxisome proliferator-activated receptor
gamma and promotes adipocyte differentiation. Cell 83,
813–819.
I. Karagiannides et al. ApoE and obesity
FEBS Journal 275 (2008) 4796–4809 ª 2008 The Authors Journal compilation ª 2008 FEBS 4807
11 Nagy L, Tontonoz P, Alvarez JG, Chen H & Evans
RM (1998) Oxidized LDL regulates macrophage gene
expression through ligand activation of PPARgamma.
Cell 93, 229–240.
12 Lehmann JM, Moore LB, Smith-Oliver TA, Wilkison
WO, Willson TM & Kliewer SA (1995) An antidiabetic
thiazolidinedione is a high affinity ligand for peroxi-
some proliferator-activated receptor gamma (PPAR
gamma). J Biol Chem 270, 12953–12956.
13 Hube F, Birgel M, Lee YM & Hauner H (1999) Expres-
sion pattern of tumour necrosis factor receptors in sub-
cutaneous and omental human adipose tissue: role of
obesity and non-insulin-dependent diabetes mellitus.
Eur J Clin Invest 29, 672–678.
14 Arias J, Vara E, Gomez M, Garcia C, Moreno A &
Balibrea JL (1992) Effect of cytokines on ‘de novo’ lipid
synthesis and hormone secretion by isolated human
islets. Transplant Proc 24, 2909–2912.
15 Hotamisligil GS & Spiegelman BM (1994) Tumor
necrosis factor alpha: a key component of the obesity–
diabetes link. Diabetes 43 , 1271–1278.
16 Hotamisligil GS, Murray DL, Choy LN & Spiegelman
BM (1994) Tumor necrosis factor alpha inhibits signal-
ing from the insulin receptor. Proc Natl Acad Sci USA
91, 4854–4858.
17 Barsh GS, Farooqi IS & O’Rahilly S (2000) Genetics of
body-weight regulation. Nature 404, 644–651.
18 Friedman JM (2000) Obesity in the new millennium.
Nature 404, 632–634.
19 Maison P, Byrne CD, Hales CN, Day NE & Wareham
NJ (2001) Do different dimensions of the metabolic syn-
drome change together over time? Evidence supporting
obesity as the central feature. Diabetes Care 24, 1758–
1763.
20 Gumbiner B, Polonsky KS, Beltz WF, Griver K,
Wallace P, Brechtel G & Henry RR (1990) Effects of
weight loss and reduced hyperglycemia on the kinetics of
insulin secretion in obese non-insulin dependent diabetes
mellitus. J Clin Endocrinol Metab 70, 1594–1602.
21 Grundy SM (2007) Metabolic syndrome: a multiplex
cardiovascular risk factor. J Clin Endocrinol Metab 92,
399–404.
22 Lazar MA (2005) How obesity causes diabetes: not a
tall tale. Science 307, 373–375.
23 Zannis VI, Kypreos KE, Chroni A, Kardassis D &
Zanni EE (2004) Lipoproteins and atherogenesis. In
Molecular Mechanisms of Atherosclerosis (Loscalzo J,
ed.), pp. 111–174. Taylor & Francis, New York, NY.
24 Zannis VI & Breslow JL (1981) Human very low density
lipoprotein apolipoprotein E isoprotein polymorphism is
explained by genetic variation and posttranslational
modification. Biochemistry 20, 1033–1041.
25 Zannis VI, Just PW & Breslow JL (1981) Human
apolipoprotein E isoprotein subclasses are genetically
determined. Am J Hum Genet 33, 11–24.
26 Breslow JL, McPherson J, Nussbaum AL, Williams
HW, Lofquist-Kahl F, Karathanasis SK & Zannis VI
(1982) Identification and DNA sequence of a human
apolipoprotein E cDNA clone. J Biol Chem 257,
14639–14641.
27 Breslow JL, Zannis VI, SanGiacomo TR, Third JL,
Tracy T & Glueck CJ (1982) Studies of familial type III
hyperlipoproteinemia using as a genetic marker the
apoE phenotype E2/2. J Lipid Res 23 , 1224–1235.
28 Zannis VI, Breslow JL, Utermann G, Mahley RW,
Weisgraber KH, Havel RJ, Goldstein JL, Brown MS,
Schonfeld G, Hazzard WR et al. (1982) Proposed
nomenclature of apoE isoproteins, apoE genotypes, and
phenotypes. J Lipid Res 23, 911–914.
29 Zannis VI & Breslow JL (1982) Apolipoprotein E. Mol
Cell Biochem 42
, 3–20.
30 Plump AS, Smith JD, Hayek T, Aalto-Setala K, Walsh
A, Verstuyft JG, Rubin EM & Breslow JL (1992)
Severe hypercholesterolemia and atherosclerosis in
apolipoprotein E-deficient mice created by homologous
recombination in ES cells. Cell 71, 343–353.
31 Zhang SH, Reddick RL, Piedrahita JA & Maeda N
(1992) Spontaneous hypercholesterolemia and arterial
lesions in mice lacking apolipoprotein E. Science 258,
468–471.
32 Goldstein JL, Hobbs HH & Brown MS (2001) Familial
hypercholesterolemia. In The Metabolic & Molecular
Bases of Inherited Disease (Scriver CR, Beaudet AL,
Valle D & Sly WS, eds), pp. 2863–2913. McGraw Hill,
New York.
33 Bersot TP, Mahley RW, Brown MS & Goldstein JL
(1976) Interaction of swine lipoproteins with the low
density lipoprotein receptor in human fibroblasts. J Biol
Chem 251, 2395–2398.
34 Pitas RE, Innerarity TL & Mahley RW (1980) Cell
surface receptor binding of phospholipid: protein
complexes containing different ratios of receptor-active
and -inactive E apoprotein. J Biol Chem 255,
5454–5460.
35 Pullinger CR, Hennessy LK, Chatterton JE, Liu W,
Love JA, Mendel CM, Frost PH, Malloy MJ, Schu-
maker VN & Kane JP (1995) Familial ligand-defective
apolipoprotein B. Identification of a new mutation that
decreases LDL receptor binding affinity. J Clin Invest
95, 1225–1234.
36 Zannis VI, Kardassis D & Zanni EE (1993) Genetic
mutations affecting human lipoproteins, their receptors,
and their enzymes. Adv Hum Genet 21, 145–319.
37 Brown MS & Goldstein JL (1986) A receptor-mediated
pathway for cholesterol homeostasis. Science 232,
34–47.
38 Frederich RC, Hamann A, Anderson S, Lollmann B,
Lowell BB & Flier JS (1995) Leptin levels reflect body
lipid content in mice: evidence for diet-induced resis-
tance to leptin action. Nat Med 1, 1311–1314.
ApoE and obesity I. Karagiannides et al.
4808 FEBS Journal 275 (2008) 4796–4809 ª 2008 The Authors Journal compilation ª 2008 FEBS
39 Hall JE, Hildebrandt DA & Kuo J (2001) Obesity
hypertension: role of leptin and sympathetic nervous
system. Am J Hypertens 14, 103S–115S.
40 Bravo PE, Morse S, Borne DM, Aguilar EA & Reisin
E (2006) Leptin and hypertension in obesity. Vasc
Health Risk Manag. 2, 163–169.
41 Kypreos KE & Zannis VI (2006) LDL receptor defi-
ciency or apoE mutations prevent remnant clearance
and induce hypertriglyceridemia in mice. J Lipid Res 47,
521–529.
42 Boden G (1997) Role of fatty acids in the pathogenesis
of insulin resistance and NIDDM. Diabetes 46, 3–10.
43 Roden M, Price TB, Perseghin G, Petersen KF,
Rothman DL, Cline GW & Shulman GI (1996)
Mechanism of free fatty acid-induced insulin resistance
in humans. J Clin Invest 97, 2859–2865.
44 Sullivan PM, Mezdour H, Aratani Y, Knouff C, Najib
J, Reddick RL, Quarfordt SH & Maeda N (1997)
Targeted replacement of the mouse apolipoprotein E
gene with the common human APOE3 allele enhances
diet-induced hypercholesterolemia and atherosclerosis.
J Biol Chem 272, 17972–17980.
45 Kypreos KE, Li X, Van Dijk KW, Havekes LM &
Zannis VI (2003) Molecular mechanisms of type III
hyperlipoproteinemia: the contribution of the
carboxy-terminal domain of ApoE can account for the
dyslipidemia that is associated with the E2/E2
phenotype. Biochemistry 42, 9841–9853.
46 Weisgraber KH, Innerarity TL & Mahley RW (1982)
Abnormal lipoprotein receptor-binding activity of the
human E apoprotein due to cysteine–arginine inter-
change at a single site. J Biol Chem 257, 2518–2521.
47 Rensen PC & van Berkel TJ (1996) Apolipoprotein E
effectively inhibits lipoprotein lipase-mediated lipolysis
of chylomicron-like triglyceride-rich lipid emulsions
in vitro and in vivo. J Biol Chem 271, 14791–14799.
48 Havel RJ, Kotite L, Vigne JL, Kane JP, Tun P,
Phillips N & Chen GC (1980) Radioimmunoassay of
human arginine-rich apolipoprotein, apoprotein
E. Concentration in blood plasma and lipoproteins as
affected by apoprotein E-3 deficiency. J Clin Invest
66, 1351–1362.
49 Hofmann SM, Zhou L, Perez-Tilve D, Greer T,
Grant E, Wancata L, Thomas A, Pfluger PT, Basford JE,
Gilham D et al. (2007) Adipocyte LDL receptor-
related protein-1 expression modulates postprandial
lipid transport and glucose homeostasis in mice. J Clin
Invest 117, 3271–3282.
50 Schreyer SA, Lystig TC, Vick CM & LeBoeuf RC
(2003) Mice deficient in apolipoprotein E but not LDL
receptors are resistant to accelerated atherosclerosis
associated with obesity. Atherosclerosis 171, 49–55.
51 MacDonald ML, Singaraja RR, Bissada N, Ruddle P,
Watts R, Karasinska JM, Gibson WT, Fievet C, Vance
JE, Staels B et al. (2008) Absence of stearoyl-CoA
desaturase-1 ameliorates features of the metabolic syn-
drome in LDLR-deficient mice. J Lipid Res 49, 217–229.
52 Gao J, Katagiri H, Ishigaki Y, Yamada T, Ogihara T,
Imai J, Uno K, Hasegawa Y, Kanzaki M, Yamamoto
TT et al. (2007) Involvement of apolipoprotein E in
excess fat accumulation and insulin resistance. Diabetes
56, 24–33.
53 Chiba T, Nakazawa T, Yui K, Kaneko E & Shimokado
K (2003) VLDL induces adipocyte differentiation in
ApoE-dependent manner. Arterioscler Thromb Vasc Biol
23, 1423–1429.
54 Huang ZH, Reardon CA & Mazzone T (2006) Endoge-
nous ApoE expression modulates adipocyte triglyceride
content and turnover. Diabetes 55, 3394–3402.
55 Polonsky KS, Given BD & Van Cauter E (1988)
Twenty-four-hour profiles and pulsatile patterns of insu-
lin secretion in normal and obese subjects. J Clin Invest
81, 442–448.
56 Badman MK & Flier JS (2007) The adipocyte as an
active participant in energy balance and metabolism.
Gastroenterology 132, 2103–2115.
57 Ishibashi S, Brown MS, Goldstein JL, Gerard RD,
Hammer RE & Herz J (1993) Hypercholesterolemia in
low density lipoprotein receptor knockout mice and its
reversal by adenovirus-mediated gene delivery. J Clin
Invest 92, 883–893.
58 Kypreos KE, Van Dijk KW, van Der ZA, Havekes LM
& Zannis VI (2001) Domains of apolipoprotein E con-
tributing to triglyceride and cholesterol homeostasis
in vivo. Carboxyl-terminal region 203–299 promotes
hepatic very low density lipoprotein-triglyceride secre-
tion. J Biol Chem 276, 19778–19786.
59 Kypreos KE, Van Dijk KW, Havekes LM & Zannis VI
(2005) Generation of a recombinant apolipoprotein E
variant with improved biological functions: hydrophobic
residues (LEU-261, TRP-264, PHE-265, LEU-268,
VAL-269) of apoE can account for the apoE-induced
hypertriglyceridemia. J Biol Chem 280, 6276–6284.
60 Duivenvoorden I, Teusink B, Rensen PC, Romijn JA,
Havekes LM & Voshol PJ (2005) Apolipoprotein C3
deficiency results in diet-induced obesity and aggravated
insulin resistance in mice. Diabetes 54, 664–671.
61 Lowry OH, Rosebrough NJ, Farr AL & Randall RJ
(1951) Protein measurement with the Folin phenol
reagent. J Biol Chem 193, 265–275.
I. Karagiannides et al. ApoE and obesity
FEBS Journal 275 (2008) 4796–4809 ª 2008 The Authors Journal compilation ª 2008 FEBS 4809