A simplified multiple aliquot regenerative dose protocol to extend the dating limit of K-feldspar pIRIR signal
Bạn đang xem bản rút gọn của tài liệu. Xem và tải ngay bản đầy đủ của tài liệu tại đây (6.2 MB, 10 trang )
Radiation Measurements 157 (2022) 106827
Contents lists available at ScienceDirect
Radiation Measurements
journal homepage: www.elsevier.com/locate/radmeas
A simplified multiple aliquot regenerative dose protocol to extend the
dating limit of K-feldspar pIRIR signal
Junjie Zhang *, Sumiko Tsukamoto
Leibniz Institute for Applied Geophysics, Stilleweg 2, 30655 Hannover, Germany
A R T I C L E I N F O
A B S T R A C T
Keywords:
Dating limit
K-feldspar
Post-IR IRSL
MAR
TL normalisation
Fading correction
The post-infrared infrared stimulated luminescence signal (pIRIR) from K-feldspar shows significantly less
athermal fading than the conventional IRSL signal, thus it has been widely used for dating Quaternary deposits.
With the single aliquot regenerative dose (SAR) protocol, the test dose signal is influenced by the preceding
regenerative dose, and the characteristic saturation dose (D0) of the pIRIR signal is mostly in the range of
200–600 Gy, depending on the size of the test dose. According to the D0 value, the dating range of pIRIR is
restricted to <300 ka with the SAR protocol. Here we present a multiple aliquot regenerative dose (MAR)
protocol using low-temperature thermoluminescence (TL) signal for inter-aliquot normalisation. The multipleelevated-temperature (MET) pIRIR signals up to 290 ◦ C are investigated. The D0 increases to 850–1300 Gy
with this protocol, which should represent the intrinsic D0 of IR or pIRIR signals of K-feldspar. Based on the
higher D0, this protocol has the potential to date samples with equivalent doses (Des) up to 2000 Gy, i.e. up to
~600 ka considering a dose rate of ~3.5 Gy⋅ka− 1. Applications of this MAR protocol on two loess samples from
the Chinese Loess Plateau provide ages consistent with expected ages up to 350 ka, with the MET-pIRIR signal at
290 ◦ C. However, tests on three fluvial and alluvial samples show age overestimation with the new MAR protocol
as well as SAR protocol, which may result from the hard-to-bleach property of the high-temperature pIRIR
signals. Simulations of fading correction indicate that the age will be over-corrected when the laboratory dose
response curve has a D0 smaller than the true D0 of the signal. Caution should be taken in fading corrected ages
measured with the conventional SAR protocol, as the D0 values are always underestimated in this case.
1. Introduction
Optically stimulated luminescence (OSL) is being widely applied to
date sediment’s burial event (Aitken, 1998; Rhodes, 2011; Murray et al.,
2021). The growth of the luminescence signal with irradiation dose
generally follows a saturating exponential function: I=Imax*(1-exp-D/D0),
where I is the luminescence intensity, Imax is the luminescence intensity
at saturation, D is the dose the sample received during burial and D0
represents the characteristic saturation dose. The upper limit of OSL
dating is determined by the saturation behaviour of the luminescence
signal and usually 2*D0 is proposed to be the dating limit beyond which
measurements of equivalent dose (De) may not be reliable (Wintle and
Murray, 2006). For quartz, the D0 is smaller than 200 Gy in most cases,
making quartz OSL dating only applicable to samples with De values
smaller than 400 Gy, though underestimation of quartz OSL ages at
lower dose ranges (e.g. ~150 Gy) has also been widely reported (Buy
laert et al., 2007; Lai, 2010; Lowick et al., 2010; Timar-Gabor et al.,
2011; Chapot et al., 2012; Qin and Zhou, 2018; Peri´c et al., 2019).
Compared to quartz, the infrared stimulated luminescence (IRSL) signal
from K-feldspar saturates at much higher dose, which has the higher
dating limit. Though application of IRSL dating with K-feldspar was
hampered by anomalous fading (Spooner, 1992), later studies showed
that the post-infrared IRSL (pIRIR) signal stimulated at a higher tem
perature exhibited less fading (Thomsen et al., 2008) and various pIRIR
dating protocols have been proposed (Buylaert et al., 2009, 2012; Li and
Li, 2011; Reimann et al., 2011; Thiel et al., 2011; Reimann and Tsuka
moto, 2012; Fu and Li, 2013).
Normalisation of multiple aliquot data was an essential development
in luminescence dating in 1980’s. For thermoluminescence (TL) dating,
the multiple aliquot additive dose (MAAD) protocol was mostly used
(Aitken, 1985). Although mass normalisation was a straightforward way
to reduce the inter-aliquot variation, it was not always effective, e.g. it
cannot account for the different proportions of ‘bright’ grains between
the aliquots (Aitken, 1985). The second glow-glow was an alternative for
* Corresponding author.
E-mail address: (J. Zhang).
/>Received 28 November 2021; Received in revised form 30 June 2022; Accepted 1 July 2022
Available online 5 July 2022
1350-4487/© 2022 Elsevier Ltd. All rights reserved.
J. Zhang and S. Tsukamoto
Radiation Measurements 157 (2022) 106827
normalisation; however there might be dose dependent sensitivity
changes triggered by additive dosing and heating, and an ‘equal predose’
technique could be used to circumvent this problem (Aitken, 1985). The
zero-glow monitoring (ZGM) technique which applied the response of a
low-temperature (<200 ◦ C) TL peak to a small dose to normalise the
aliquots, was much more effective (Aitken et al., 1979; Debenham and
Aitken, 1984; Aitken, 1985). Since OSL dating was developed, different
normalisation methods have been proposed. With the MAAD protocol,
the OSL response to a test dose can be applied to normalise the aliquots –
the ‘dose normalisation’ (Rhodes, 1990; Smith et al., 1991; Stokes and
Gaylord, 1993). The natural signals of aliquots can also be measured
with ‘short shine’ to normalise the aliquots in MAAD protocol – ‘natural
normalisation’ (Rhodes, 1990; Li, 1992; Duller, 1994). With the ‘short
shine’ signal, a single aliquot additive dose (SAAD) protocol has also
been proposed (Duller, 1991). The additive-dose protocol applies
extrapolation of the dose response curve to estimate the De, and thus is
not applicable for relatively old samples. A single aliquot regenerative
dose protocol (SAR) was developed to apply the 110 ◦ C TL peak, and
subsequently the OSL signal of a test dose to monitor the sensitivity
change of quartz OSL signal (Murray and Roberts, 1998; Aitken, 1998;
Murray and Wintle, 2000). The SAR protocol has also been proposed for
feldspar by applying the IRSL of a test dose to correct for sensitivity
change (Wallinga et al., 2000b).
With the SAR protocol, many studies reported that the D0 of the
pIRIR signals of K-feldspar increased with the size of test dose (Qin and
Zhou, 2012; Liu et al., 2016; Colarossi et al., 2018; Qin et al., 2018;
Zhang and Li, 2019). Changing the measurement parameters within the
SAR, such as removing a greater proportion of the IRSL signal by adding
prolonged IR bleaching after regenerative dose signal and test dose
signal measurements (Colarossi et al., 2018), or changing the order in
which different-sized regenerative doses are given (Liu et al., 2016),
could also change the D0 value. Several hypotheses have been proposed
for these observations, such as charge carry-over (Colarossi et al., 2018),
thermal transferred signal (Nian et al., 2012; Qin and Zhou, 2012), and
dose-dependent sensitivity change (Li et al., 2013). Generally, the D0
values of the pIRIR signals are in the range of 200–600 Gy, depending on
the test dose size (Zhang and Li, 2020 and references therein). Applying
a D0 of 500 Gy, the dating limit is restricted to ~300 ka for K-feldspar
with a dose rate of ~3.5 Gy⋅ka− 1.
To extend the maximum age limit of pIRIR dating, previous studies
proposed a modified multiple aliquot regenerative dose (MAR) protocol,
in which a second test dose was administered after heating the aliquots
to 600 ◦ C or 500 ◦ C to remove the ‘pre-dose memory’ (Li et al., 2013;
Chen et al., 2015). Using the signal of the second test dose for normal
isation, the D0 increased to ~750 Gy (Li et al., 2013; Chen et al., 2015).
In this study, we propose a simplified MAR protocol, with the normal
isation method similar to the ZGM technique. Instead of using a test dose
signal for normalisation, the low-temperature TL response to a small
dose (e.g. 5 Gy) is used to normalise the aliquots to remove the
inter-aliquot variation. The D0 and De values obtained with the new
MAR protocol and the conventional SAR protocol are compared.
2. Materials and methods
2.1. Sample details and preparation
Five coarse-grain K-feldspar samples were used in this study. Details
of the samples are listed in Table 1. LUM3706 and LUM3710 (63–100
μm) are loess deposits from the Chinese Loess Plateau, from units L2 and
L4 in Luochuan section (Li et al., 2018b). The reference ages of
LUM3706 and LUM3710 are 131 ± 13 ka and 346 ± 35 ka respectively,
estimated from the astronomically tuned chronology (Ding et al., 2002).
LUM1504 (150–250 μm) and LUM1506 (150–200 μm) are fluvial de
posits from the Upper Rhine Graben, which have been dated by the
quartz OSL signal and/or K-feldspar pIRIR signal at 225 ◦ C (pIRIR225) in
Li et al. (2018a). For LUM1504, the quartz OSL age is 67 ± 7 ka and
fading corrected pIRIR225 age is 75 ± 9 ka (Li et al., 2018a). The quartz
OSL age is applied here to calculate the expected De of K-feldspar. For
LUM1506, the fading corrected pIRIR225 age is 394 ± 54 ka (Li et al.,
2018a), and this age is applied to calculate the expected De of K-feldspar.
LUM4239 (150–200 μm) is alluvial deposit adjacent to the Kalabagh
Fault in Pakistan, and the fading corrected pIRIR225 age of 212 ± 11 ka
(Abbas et al., 2022) is applied to calculate the expected De of K-feldspar.
Samples were sieved to the selected grain size, treated with 10% HCl
acid and 30% H2O2 solution to remove the carbonates and organic
matter respectively, and then sieved again. K-feldspar grains (ρ < 2.58 g
cm− 3) were separated by heavy liquid. No HF etching was performed.
The compositions of separated grains of LUM1504, LUM4239 were
analysed by an X-ray fluorescence (XRF) attachment mounted inside a
Risø TL/OSL DA-20 reader. The loess samples LUM3706 and LUM3710
have not enough material for XRF analysis, thus the loess sample from
the L6 unit (LUM3712) in Li et al. (2018b) was used as a representative
to perform the XRF analysis. Grains were spread on 3 molybdenum cups
for each sample. The XRF instrument had been calibrated using stan
dards which represent the end members of the feldspar series and
quartz, and the intensity of the Na, K and Ca X-ray peaks were converted
into relative feldspar contributions, and the excess Si counts could be
attributed to quartz (Stevens et al., 2018). Table S1 presents the pro
portions of the three end members of feldspar in the samples with or
without the existence of quartz. Fig. S1 shows the composition of the
samples in the ternary graph of feldspar series. K-rich feldspar is the
dominant mineral in all the samples, and the internal K contents are
12.2–12.5% (Table S1). Aliquots for D0 and De measurements were
prepared by mounting K-feldspar grains on stainless steel discs with
silicone oil as adhesive. Aliquots had the size of 6-mm in diameter except
for LUM3706 which was 2.5-mm in diameter because of the limited
amount of sample.
Table 1
Details of the samples used in this study.
Sample ID
Grain size (μm)
Sample description
Dose rate (Gy⋅ka− 1)
Expected age (ka)
Expected De (Gy)
Reference
LUM1504
LUM1506
LUM3706
LUM3710
LUM4239
150–250
150–200
63–100
63–100
150–200
Fluvial deposits in Rhine Graben
Fluvial deposits in Rhine Graben
Chinese loess
Chinese loess
Alluvial deposits in Pakistan
3.01 ±
2.46 ±
2.94 ±
3.41 ±
4.22 ±
67 ± 7a
394 ± 54b
131 ± 13c
346 ± 35c
212 ± 11b
202 ± 26
967 ± 145
416 ± 51d
1179 ± 133
895 ± 56
Li et al. (2018a)
Li et al. (2018a)
Li et al. (2018b)
Li et al. (2018b)
Abbas et al. (2022)
0.24
0.15
0.15
0.17
0.15
a
quartz OSL age.
fading corrected pIRIR225 age.
c
age from astronomical chronology.
d
the average dose rate (3.17 ± 0.23 Gy/ka) of LUM3706 and LUM3710 is used to calculate the expected De of LUM3706. Please note that the dose rates of LUM3706
and 3710 are smaller than those reported in Li et al. (2018b), because of two reasons: 1) no 222Rn loss was not considered in Li et al. (2018b), so the dose rates will be
~0.1 Gy/ka higher than the dose rates with 20% 222Rn loss, and 2) the internal dose rates in Li et al. (2018b) were calculated based on a grain size of 150–200 μm which
were overestimated by ~0.37 Gy ka-1.
b
2
J. Zhang and S. Tsukamoto
Radiation Measurements 157 (2022) 106827
2.2. Facilities and luminescence measurements
a small dose of 5 Gy versus the natural pIRIR signals can be fitted with a
linear function passing through origin (Fig. S2), indicating that TL
normalisation for pIRIR signals is theoretically applicable.
Luminescence measurements were performed on the Risø TL/OSL
DA-20 reader. The reader was attached with a90Sr/90Y beta source,
which had a dose rate of ~0.12 Gy s− 1 for coarse grains on steel discs.
Aliquots of K-feldspar grains were stimulated by IR LEDs (870 ± 40 nm)
with 90% of the maximum power (145 mW cm− 2), and the IRSL signal
was detected by a photomultiplier tube (EMI 9235QB) through a Schott
BG-39 and Corning 7–59 filter package, with a transmitting band in
violet-blue region (320–480 nm) (Bøtter-Jensen et al., 2003).
Multiple-elevated-temperature (MET) pIRIR signals were measured.
Aliquots were preheated at 320 ◦ C for 60 s, and IR stimulations were
performed at 50 ◦ C, 100 ◦ C, 150 ◦ C, 200 ◦ C, 250 ◦ C, 290 ◦ C for 100 s
successively. In order to reduce the thermally stimulated signal in the
elevated temperature IRSL signal and to make sure the temperature
reach a steady state, the aliquots were hold for 10, 20, 20, 30, 50, 50 s at
the stimulation temperatures of 50, 100, 150, 200, 250, 290 ◦ C
respectively before the IR stimulations started. The signal from the first
10 s of the decay curve with subtraction of the last 10 s signal was used
to build the dose response curve (DRC) and calculate the De.
The sequence of the tested MAR protocol is listed in Table 2. The
ănle SOL2 solar simulator.
bleaching in Step 1 was performed by the Ho
For sample LUM3706, two groups of aliquots were bleached for 4 h and
48 h respectively, to study the effect of bleaching time on MAR De
estimation. The other samples were bleached for 48 h, except for
LUM4239 which was bleached for 120 h as it was harder to bleach.
Residual doses were measured by the SAR protocol (sequence in
Table S2) and the results were presented in Table S3. The residual doses
were added on top of the regenerative doses when plotting the DRC. The
maximum regenerative dose was 2500–3500 Gy for different samples.
The low-temperature TL signal (up to 180 ◦ C) in response to a small dose
(5 Gy) was measured several times within the sequence (Table 2). These
TL signals were used to normalise the IR and pIRIR signals of the mul
tiple aliquots to reduce the inter-aliquot variation. These small doses (5
Gy) were also added on the regenerative doses when building the DRC,
and subtracted from the measured De. A test dose signal (Tx) was also
measured and Tx normalisation was performed for comparison. The test
doses were 120 Gy for LUM1504, 180 Gy for LUM3706 and LUM4239,
and 360 Gy for LUM3710 and LUM1506, which were 20–60% of the
expected De values. The SAR protocol was also applied to build the DRCs
and to estimate the De values (Table S2). For each sample, the same
regenerative doses and the same test dose were used for both SAR and
MAR protocols. Each aliquot was weighed with precision of 0.01 mg
before and after mounting the grains on the disc and the mass of sample
on each aliquot was calculated and mass normalisation was also carried
out for the MAR protocol. In order to examine whether the lowtemperature TL signal is proportional to IR and pIRIR signals, 10–20
aliquots for LUM1504 and LUM4239 were prepared with different sizes
in diameter ranging from 1 mm to 6 mm. The TL response (to 180 ◦ C) to
2.3. Dose rate estimation
U, Th, K concentrations of all samples were measured by gamma
spectrometry to calculate the environmental dose rates. For LUM3706
and LUM3710, U, Th, K concentrations were also measured by neutron
activation analysis (NAA), and the mean concentrations of the two an
alyses were used to calculate the dose rate, same as in Li et al. (2018b). A
20% 222Rn loss was assumed (Olley et al., 1997). The conversion factors
from Liritzis et al. (2013) were applied. As the K-feldspar grains were not
etched, alpha dose rate was also calculated based on an a-value of 0.09
± 0.02 (Kreutzer et al., 2014; Schmidt et al., 2018). The alpha attenu
ation factor is estimated from Brennan et al. (1991). Generally, the alpha
dose rate contributes less than 3% to the total dose rate. Beta absorption
factor was obtained from Gu´erin et al. (2012). The internal dose rate was
calculated based on a K concentration of 12.5 ± 1.0% (Huntley and
Baril, 1997; Zhao and Li, 2005) and Rb of 400 ± 100 ppm (Huntley and
Hancock, 2001). Absorbed dose fraction of 87Rb inside the grains was
estimated following Readhead (2002). Cosmic ray dose rate was calcu
lated following Prescott and Hutton (1994). Water concentrations were
the same as used in previous studies, which were 15 ± 5% for LUM3707
and LUM3710, 20 ± 10% for LUM1504 and LUM1506, 1.7 ± 1.7% for
LUM4239. As we calculated the dose rates with more updated factors (e.
g. the conversion factor, beta absorption factor), the dose rates in this
study are not always identical to the dose rates reported in previous
studies.
Please note that the mean dose rate of LUM3706 and LUM3710 was
used to calculate the expected De value for LUM3706. LUM3706 was
located in the top of the L2 layer which has high carbonate content,
resulting in a low dose rate. However, a previous dating study by Zhang
et al. (2018) on Luochuan section indicated that the carbonate accu
mulation at this level (top of L2) happened quite late after the dust
deposition and the currently measured dose rate did not represent the
dose rate over the whole burial period. Here, we assume the initial dose
rate of LUM3706 before carbonate accumulation is close to that of
LUM3710, and use the average of initial dose rate and current dose rate
to represent the dose rate over the whole burial history.
3. Results and discussion
3.1. D0 comparison
The low-temperature TL signals were measured by heating the ali
quots to 180 ◦ C with a heating rate of 5 ◦ C⋅s− 1. Such a low-temperature
treatment would not change the luminescence sensitivity (Kars et al.,
2014b; Wallinga et al., 2000a; Zhang, 2018). K-feldspar shows a broad
TL peak centred at ~120 ◦ C (Fig. 1). The TL signal between 80 and
160 ◦ C was integrated to normalise the IRSL or pIRIR signals of the
regenerative dose (Lx) and the natural signal (Ln).
DRCs were built for the MAR protocols using the low-temperature TL
peak normalisation (TL normalisation), mass normalisation and test
dose signal (Tx) normalisation, and for the SAR protocol with Tx
correction. Comparison between the MAR DRCs shows that mass nor
malisation reduced the scatter of the data and TL normalisation worked
better than mass normalisation, while Tx normalisation worked best
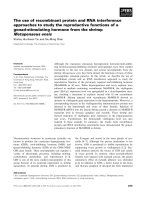
(Fig. S3). Fig. 2 shows the DRCs of the MET-pIRIR290 signal built with
different protocols for samples LUM1506 and LUM3710. All the DRCs
were fitted with a single saturating exponential (SSE) function and the
D0 values of IR and pIRIR signals at different temperatures for different
protocols were shown in Fig. 3 and listed in Table S4. Please note that
the D0 values of LUM3706 (Fig. 3) were calculated using the aliquots of
the 4h bleaching, with a maximum regenerative dose of 2460 Gy. The
aliquots bleached for 48 h of LUM3706 had a maximum regenerative
Table 2
The sequence used to test the MAR protocol with TL normalisation. The lowtemperature TL peak of a small dose (5 Gy) was recorded several times within
the sequence.
Step
Treatments
Signal
1
2
3
4
5
6
7
8
9
Give 5 Gy, heat to 180 C
Solar bleaching (not for natural aliquots)
Give 5 Gy, heat to 180 ◦ C
Regenerative dose (not for natural aliquots)
Preheat at 320 ◦ C, MET-pIRIR to 290 ◦ C
Give 5 Gy, heat to 180 ◦ C
Test dose
Preheat at 320 ◦ C, MET-pIRIR to 290 ◦ C
Give 5 Gy, heat to 180 ◦ C
◦
a
TL_0
TL_1
Ln or Lx
TL_2
Tn or Tx
TL_3
a
We chose “Run one at a time” in the Sequence Editor, to make sure the time
delay between irradiation and measurement is a constant for different aliquots.
3
J. Zhang and S. Tsukamoto
Radiation Measurements 157 (2022) 106827
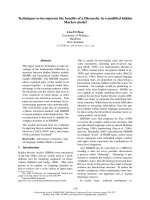
Fig. 1. The low-temperature TL signals (TL_1, TL_2) of 24 aliquots from sample
LUM3710. Dashed lines indicate the TL signals of 5 aliquots used for natural
signal measurements. Solid lines indicate the TL signals of 19 aliquots for
regenerative dose signal measurements. The signal interval of 80–160 ◦ C was
used for normalisation. Note that the in TL_1, the 19 aliquots have lower TL
sensitivity due to solar simulator bleaching, compared to the other 5 natural
aliquots. However, in TL_2 the sensitivity becomes close to each other.
Fig. 2. DRCs of sample LUM1506 and LUM3710 with different protocols, for
the MET-pIRIR290 signal. DRCs were fitted with a single saturating exponential
function. The D0 values were labelled beside each DRC. For Tx normalisation,
same test dose was used for MAR and SAR protocols. Note that the signals of the
Lx/TL_0 (LUM1506) or Lx/TL_2 (LUM3710) were re-normalised to make the
average signal equals to the average MAR Lx/Tx signal at the first non-zero
regenerative dose.
dose of only 1180 Gy, and thus was not used for D0 estimation. Among
all the protocols, the SAR protocol with Tx correction always has the
smallest D0 values (300–700 Gy). The D0 values of the MAR protocol
with Tx normalisation are larger than that of the SAR protocol, but still
smaller than the D0 values with TL normalisation. The smaller D0 values
for the SAR and MAR protocols with Tx correction/normalisation can be
explained by the effects of charge carry-over (Colarossi et al., 2018), the
thermal transferred signal (Qin and Zhou, 2012), or the dose-dependent
sensitivity change (Li et al., 2013). From these hypotheses, the preced
ing regenerative dose may have an effect on Tx. With a larger regener
ative dose, the Tx is overestimated in a higher degree and Lx/Tx is
underestimated more significantly. Consequently, the DRC is distorted
and D0 is underestimated. In MAR protocol with the Tx normalisation,
the Tx is only influenced by one regenerative dose rather than repeated
cycles, thus the effect is relatively smaller and the D0 is higher than that
in the SAR protocol.
Compared to the Tx normalisation, the DRCs built with TL
normalisation have much higher D0 values at 850–1300 Gy. TL_0 is the
low-temperature TL signal before any treatments, thus it is the most
reliable signal for normalisation as all the aliquots are fresh and have not
received different treatments. TL_1 is the low-temperature TL signal
after solar simulator bleaching. For the aliquots used for natural signal
measurements, TL_1 is a repeat measurement of TL_0. TL_2 and TL_3 are
the low-temperature TL signal after measuring IR and pIRIR signals of
the regenerative dose (or natural dose) and test dose respectively.
However, for all samples, the DRCs with TL_0, TL_1, TL_2 and TL_3
normalisations almost have identical D0 values (Fig. 3), which is evi
dence that the low-temperature TL signal is not affected by the size of
preceding regenerative dose. DRCs with mass normalisation (Lx/mass)
have similar D0 values as the DRCs with TL normalisation, also indi
cating the reliability of TL normalisation. However, compared to TL
4
J. Zhang and S. Tsukamoto
Radiation Measurements 157 (2022) 106827
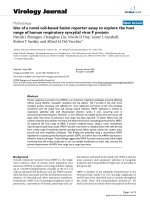
Fig. 3. D0 values of IR50 and pIRIR signals measured with different protocols. Note that the D0 values of MAR protocol with TL normalisation and mass normalisation
are close to each other, and are higher than the MAR protocol with Tx correction. The SAR protocol with Tx correction has the lowest D0 values.
normalisation, mass normalisation has higher scatter as it cannot ac
count for the different proportions of ‘bright’ grains inside the aliquots,
and mass normalisation cannot correct for the sensitivity change of the
equipment, such as the photomultiplier tube.
We suggest that the D0 values of DRCs with TL or mass normalisation
are the intrinsic D0 values of the IRSL and pIRIR signals of K-feldspar.
The intrinsic D0 values are 850–1300 Gy, centred at 1000 Gy (Table S4),
which is about two times of the D0 values obtained by the SAR protocol.
Fig. 4. De values of IR50 and pIRIR signals measured with different protocols. The shadowed area indicates the expected De. Note that TL_1 normalisation of all
samples always generate systematically lower De values. For loess sample LUM3706 (a) and LUM3710 (b), MAR protocols with TL_2, TL_3 normalisations and mass
normalisation generated MET-pIRIR290 De values close to expected De. For fluvial or alluvial samples LUM1504 (c) and LUM1506 (d) and LUM4239 (e), hightemperature pIRIR signals generated overestimated De values, which is a result of partial bleaching.
5
J. Zhang and S. Tsukamoto
Radiation Measurements 157 (2022) 106827
Applying 2*D0 as the upper limit (Wintle and Murray, 2006), K-feldspar
has the potential to date samples with De up to 2000 Gy. With an
environmental dose rate of ~3.5 Gy/ka, the maximum age limit would
be ~600 ka. However, it should be noted that this upper dating limit is
solely based on the DRC. In practice, other factors such as signal insta
bility, discrepancy between natural and laboratory DRCs, will also affect
the upper dating limit.
De beyond the 2*D0 limit is challenging. It is worthy to be noted that for
the younger sample LUM3706, the ‘mean Ln/Tn’ method and ‘mean De’
method generated almost identical SAR De results.
Samples LUM1504, LUM1506, LUM4239 are fluvial or alluvial
samples. The De values of these samples (Fig. 4c, d, e) are generally
overestimated with the high-temperature MET-pIRIR signals. LUM1504
has a quartz OSL age of 67 ± 7 ka and a fading corrected K-feldspar
pIRIR225 age of 75 ± 9 ka, which are consistent between each other (Li
et al., 2018a), indicating that both OSL and pIRIR225 signals were well
bleached before deposition. With the MET-pIRIR procedure, the
measured De values of both SAR and MAR protocols are close to each
other (except TL_1 normalisation), but significantly larger than the ex
pected De value. It has been reported that the high-temperature pIRIR
signals (accompanied with high preheat temperature) are more difficult
to be bleached compared to the pIRIR225 signal (e.g. Buylaert et al.,
2011; Chen et al., 2013; Kars et al., 2014a), which is very likely to be the
reason of the De overestimation here. Though LUM1504 is a
well-bleached sample regarding the pIRIR225 signal, it is a
partially-bleached sample when it comes to the high-temperature pIRIR
signals. Another evidence of the partial-bleaching of LUM1504 is that
3.2. De comparison
The De values estimated by the SAR protocol with Tx correction and
the MAR protocol with mass normalisation, TL normalisation and Tx
normalisation were presented in Fig. 4 and listed in Table S5. Please note
that the SSE function was used when fitting the DRC to get the D0, but
double saturating exponential function (DSE) was used when estimating
the De, as it can better fit the data, especially for the SAR protocol. The
De values were plotted against the temperatures at which the IR or pIRIR
signals were measured. The advantage of MET-pIRIR protocol is that if
the De values are close to each other between pIRIR signals stimulated at
high temperatures (i.e. the De plateau), it would indicate that these hightemperature pIRIR signals are sufficiently stable and fading correction is
not needed (Li and Li, 2011, 2012). To make it directly comparable to
the MAR De values, SAR De values were also calculated by projecting the
mean Ln/Tn values on the SAR DRCs, which is the same approach used
for all MAR protocols.
Sample LUM3706 and LUM3710 are loess samples from the Chinese
Loess Plateau. Previous studies indicate the high-temperature pIRIR
signal (e.g. pIRIR50, 290) can be well bleached in aeolian sediments
(Buylaert et al., 2012; Murray et al., 2014; Yi et al., 2016; Li et al., 2020).
The measured residual doses of the MET-pIRIR290 signal after SOL2
bleaching for 48 h are 11.5 and 17.0 Gy for LUM3706 and LUM3710
respectively (Table S3).The true residual doses in nature should be even
smaller (Buylaert et al., 2012; Yi et al., 2016). These true residual doses
are negligible and thus not subtracted from De, regarding the large De
values of samples in this study. Note that for LUM3706, the MAR De
values in Fig. 4a are obtained from DRCs built by aliquots that had been
bleached for 4 h by SOL2. They are consistent with the MAR De values
obtained from DRCs with aliquots bleached for 48 h (Fig. S4), which
indicates the bleaching time has negligible effect on the MAR De esti
mation with the MET-pIRIR290 protocol. As the ‘SOL2 for 4 h’ group of
LUM3706 was the first try of MAR protocol, TL_0 and mass were not
measured by then. For LUM3706 which has an expected De of 416 ± 51
Gy, the SAR with Tx correction and MAR protocol with Tx, TL_2, TL_3
normalisations all provide MET-pIRIR290 De results consistent with the
expected De (Fig. 4a). For the MAR protocol, the De values are close to
each other between pIRIR signals at 250 ◦ C and 290 ◦ C, which indicates
these signals are sufficiently stable for this sample. For low-temperature
IR50 or pIRIR signals (e.g. at 100 ◦ C, 150 ◦ C), the SAR De are smaller than
the MAR De, mainly due to the failure of the sensitivity correction in the
first cycle of SAR in relative to the following cycles, when a
high-temperature preheat is performed (Wallinga et al., 2000a; Kars
et al., 2014b; Li et al., 2017; Qin et al., 2018; Zhang, 2018). For
LUM3710 which has an expected De of 1179 ± 133 Gy, the MAR pro
tocol with mass, TL_2 and TL_3 normalisations provide MET-pIRIR290 De
results generally consistent with the expected De (Fig. 4b). However, the
SAR and MAR protocols with Tx correction/normalisation provide
underestimated De values. The De vs IR temperature plateau cannot be
identified for LUM3710. We assume that for samples with ages similar to
or older than LUM3710, anomalous fading of 200 ◦ C and 250 ◦ C pIRIR
signals may not be negligible. Please note that for SAR protocol, 4 ali
quots of LUM3710 were used to build the full DRC, and 11 aliquots were
used to measure the natural signal (Ln/Tn). Among them, the Ln/Tn
values (MET-pIRIR290 signal) of two aliquots were abnormally high (two
outliers shown in Fig. 2b), and one aliquot gave the largest De of 2679 ±
991 Gy. If applying the mean of individual Des of different aliquots, the
SAR De will be increased to 1356 ± 271 Gy. It shows that estimating the
Fig. 5. Sensitivity change of the low-temperature TL peaks of LUM1506
measured at different stages. a) mass normalised TL signals. b) TL signals
normalised by the TL_0. The sharp decrease of TL_1 in the solar simulator
bleached aliquots is the reason of De underestimation with TL_1 normalisation.
6
J. Zhang and S. Tsukamoto
Radiation Measurements 157 (2022) 106827
the De increases monotonously with higher IR stimulation temperature,
with no De plateau reached between 250 ◦ C and 290 ◦ C, even though
LUM1504 is younger than LUM3706. The absence of De plateau in
LUM1504 implies the limitation of MET-pIRIR dating on
partially-bleached samples, due to the different bleachability of the
signals. On the other hand, the different bleaching rates of the
MET-pIRIR signals have shown the potential to evaluate the degree of
signal resetting, and to track the sediment transport history before
deposition (McGuire and Rhodes, 2015a, b; Reimann et al., 2015;
Rhodes and Leathard, 2022). Similarly, for LUM1506 and LUM4239, the
MAR De values of high-temperature MET-pIRIR signals are also over
estimated due to the partial-bleaching nature of the samples. According
to section 3.3 below, the expected De values of the two samples should
also be overestimated, as they were calculated based on fading corrected
pIRIR225 age. The SAR De values of the MET-pIRIR signals at 250 ◦ C and
290 ◦ C are higher than the MAR De values. This kind of overestimation
can be explained by the comparison between the SAR and MAR DRCs
with Tx correction/normalisation. As the test dose signal in SAR protocol
has received more influence from multiple preceding cycles, the SAR
DRC is lower than the MAR DRC (Fig. 2). With the similar natural signals
(Ln/Tn) projected onto these two growth curves, the SAR DRC will
generate a larger De than the MAR DRC.
MAR De values with TL_1 normalisation are always systematically
smaller than De values of other protocols. In order to study the reason
behind the De underestimation, mass normalised TL signals of LUM1506
are compared in Fig. 5. It shows that the sensitivity of TL_0 is close to
each other for all the aliquots (Fig. 5a). Sensitivity of TL_2, TL_3 is
overall smaller than TL_0 (Fig. 5a), but the degree of the sensitivity
decrease remains the same between the aliquots, although the aliquots
have been administered different regenerative doses (Fig. 5b). This is
another evidence that the low-temperature TL signal has no ‘pre-dose
memory’. However, the sensitivity of TL_1 in natural aliquots is signif
icantly higher than that in the bleached aliquots that are used to build
the DRC (Figs. 1a and 5). Applying the TL_1 for normalisation, the
normalised signal of the natural aliquots (Ln/TL_1) will be overcorrected compared to the bleached aliquots used to build the DRC,
thus resulting in De underestimation. The decrease of TL sensitivity in
TL_1, TL_2, TL_3 compared to TL_0 may be related to the trapping
competition between the shallow traps and deep traps corresponding to
low-temperature TL peaks and high-temperature TL peaks respectively.
After solar simulator bleaching or pIRIR stimulation, the deep traps were
also emptied. During the irradiation, a smaller proportion of electrons
will be captured by the shallow traps in the bleached/stimulated ali
quots compared to natural aliquots whose deep traps were still occupied.
It highlights the importance of the timing when the low-temperature TL
signal should be measured. The TL signal should be measured either
before any treatments (such as TL_0) or after all the aliquots have been
stimulated (such as TL_2). The proposed simplified MAR protocols for
routine dating are listed in Table 3.
Compared to Lx normalisation, the TL normalisation resulted in more
scattered data in DRC, and larger error in De. That should be a result of
the imperfect correlation between the TL peak and the IRSL signals,
although they generally have a proportional relationship (Fig. S2).
However, with TL normalisation, the DRC will not be distorted and the
De will not be biased, which is the advantage over Tx normalisation. The
MAR De error can also be reduced by increasing the number of aliquots.
When applying the MAR protocol, the assumption behind is that the
solar simulator bleaching does not change the sensitivity of the pIRIR
signals. For the two relatively young samples LUM1504 and LUM3706,
the MAR De values of MET-pIRIR290 are consistent with SAR De values,
indicating the validity of the assumption. However, this assumption may
not be always true if different signals are used. Previous studies showed
that the sensitivity of IRSL signal can change after laboratory bleaching,
and the change is supposed to be related to the degree of priordepositional sunlight exposure (e.g. Li and Wintle, 1991, 1992). Our
preliminary tests on pIRIR225 signal of two samples also indicated
decreased sensitivity due to solar simulator or natural sunlight bleach
ing, which resulted in overestimated MAR De values (Fig. S5). It is
necessary to use samples with independent age control to test the MAR
protocol first, when a different pIRIR signal is used for dating.
3.3. Effect of D0 on fading correction
Although low-temperature IRSL or pIRIR signals (such as IR50,
pIRIR225) are not as stable as pIRIR290 or MET-pIRIR250 signals, they are
more bleachable and thus more suitable for dating samples which have
poor bleaching before deposition (Buylaert et al., 2011; Chen et al.,
2013; Kars et al., 2014a). For young samples with signals in the linear
part of the DRC, the fading correction method of Huntley and Lamothe
(2001) can be applied. For older samples, the correction method of Kars
et al. (2008) is preferred as it applied the physical model of Huntley
(2006) which is more precise to describe the fading process with time or
dose. In the method of Kars et al. (2008), a simulated natural DRC is built
according to the laboratory DRC and the fading corrected age is obtained
by plotting the natural signal onto the simulated natural DRC. As stated
in Kars et al. (2008), the model results rely strongly on the accuracy of
the fading rate and the laboratory DRC. Previous studies reported age
overestimation after fading correction with this model (Ito et al., 2017;
King et al., 2018; Lomax et al., 2022). It has been shown that the
measured fading rates (g-value) generally increase with larger labora
tory irradiation doses used for g-value measurements (e.g. Huntley and
Lian, 2006; Li and Li, 2008; Lomax et al., 2022). When applying the Kars
et al. (2008) fading correction model, the g-value should be measured
with a small given dose, to get the initial fading rate of the mineral (i.e.,
the initial probability distribution of the distances between electron
traps and the nearest luminescence centres), because this model has
considered the fading rate changes with the amount of irradiation.
Here, assuming that the model of Kars et al. (2008) is perfect and the
g-value is properly and accurately measured, we investigate the effect of
the laboratory DRC on the fading correction results following Kars et al.
(2008). Assuming that a sample is measured by a pIRIR signal and it has
an apparent De of 400 ± 20 Gy and an environmental dose rate of 4.0 ±
0.1 Gy⋅ka− 1, which results in apparent age of 100 ± 6 ka. A fading rate
(g2d value) of 1.56 ± 0.36%/decade is estimated for this pIRIR signal
(the g-value from pIRIR225 of a K-feldspar sample LUM4231, which is
adjacent to LUM4239). Beta dose rate of the reader is 0.1 Gy s− 1. We can
simulate ‘laboratory’ DRCs with different D0 values by the SSE function
y = 1-exp(-x/D0), and generate the natural signal which always corre
sponds to an apparent De of 400 Gy. A relative error of 3% is assumed for
all the natural signal and regenerative dose signals. The fading correc
tion is performed based on these laboratory DRCs with different D0
values by the function ‘calc_Huntley2006()’ in ‘Luminescence’ R pack
age (Kreutzer et al., 2012). Fig. 6a and b shows the fading correction
with D0 values of 1000 Gy and 500 Gy, respectively. When the
Table 3
Simplified MAR protocols for routine dating. The TL signal should be measured
either before any treatments (Protocol a, TL_0 in this study) or after all the ali
quots have been measured (Protocol b, TL_2 in this study).
Protocol (a)
Step
Treatments
Signal
1
2
3
4
Give 5 Gy, heat to 180 ◦ C
Solar bleachinga
Give regenerative dosea
MET-pIRIR measurements
TL
Protocol (b)
Step
1
2
3
4
Treatments
Solar bleachinga
Give regenerative dosea
MET-pIRIR measurements
Give 5 Gy, heat to 180 ◦ C
a
L n, L x
Signal
L n, L x
TL
not for the natural aliquots.
7
J. Zhang and S. Tsukamoto
Radiation Measurements 157 (2022) 106827
Fig. 6. Simulated fading correction with the method of Kars et al. (2008). A fading rate (g2d value) of 1.56 ± 0.36%/decade is used for a-d, and a fading rate (g2d
value) of 3.64 ± 0.43%/decade is used for e-f. a) assuming a measured De of 400 Gy and the laboratory DRC has a D0 of 1000 Gy. b) assuming a measured De of 400
Gy and laboratory DRC has a D0 of 500 Gy. c) assuming a measured De of 400 Gy, the fading corrected ages plotted with different D0 values of the laboratory DRC. d)
assuming a measured De of 400 Gy, the fading corrected ages plotted with different D0 values of the laboratory DRC. It shows that the ages will be over-corrected if
the laboratory DRC has a D0 smaller than the true D0 (~1000 Gy), and the over-correction will be more significant for older samples. e) same as (a) but with a higher
g2d value of 3.64 ± 0.43%/decade. f) same as (b) but with a higher g2d value of 3.64 ± 0.43%/decade.
laboratory DRC has a D0 of 1000 Gy which is close to the true D0, the
fading corrected age is 128 ± 6 ka. When the laboratory DRC has a D0 of
500 Gy, the fading corrected age is 137 ± 8 ka, overestimated by 7%. It
is interesting to note that the simulated natural DRCs still have D0 values
almost identical to the laboratory DRCs. A series of fading corrected ages
are obtained with different D0 values (200–2000 Gy) of the laboratory
DRCs (Fig. 6c). It shows that the age will be over-corrected when the D0
is smaller than the true D0 (~1000 Gy), and the degree of
over-correction is higher with lower D0. Similarly, assuming the sample
has a measured De of 800 ± 40 Gy and apparent age of 200 ± 11 ka, the
fading corrected ages are plotted against the D0 values in Fig. 6d. When
the laboratory DRC has a D0 of 500 Gy, the fading corrected age is 415 ±
94 ka, which is over-corrected by ~50% compared to the fading cor
rected age of 279 ± 17 ka with the ‘true’ D0 of 1000 Gy. It indicates that
for older samples the over-correction will also be more significant. When
the D0 reduces to 400 Gy, the fading corrected age becomes infinitely
old. This may explain the observation in Kars et al. (2008) that the
natural signal of a sample in field saturation was much higher than the
saturation level of the simulated natural DRC. Fading correction has also
been simulated with a higher g2d of 3.64 ± 0.43%/decade (the g-value
from IR50 signal of LUM4239). For the sample with an apparent age of
100 ± 6 ka, the fading corrected age is 180 ± 10 ka when the D0 of
laboratory DRC is 1000 Gy (Fig. 6e), but it increases to 239 ± 24 ka
when the D0 is 500 Gy (Fig. 6f), which is overestimated by 25%. It shows
that the over-correction is also more significant when the fading rate is
higher.
As the dose response curve is also involved in the fading correction
method of Lamothe et al. (2003), similar simulation of fading correction
was performed by the function ‘calc_Lamothe2003()’ in ‘Luminescence’
R package (Kreutzer et al., 2012). The results are similar to those of Kars
et al. (2008). The ages are over-corrected when the DRC D0 is smaller
than ~1000 Gy, and the degree of over-correction is also higher with
older samples and larger fading rates (Fig. S6). Our simulation study
indicates, when applying the fading correction methods of Kars et al.
(2008) and Lamothe et al. (2003), the laboratory DRC should be built
with the D0 close to the true D0 of the signal. In this case, the conven
tional SAR protocol with Tx correction is not suitable, as it always un
derestimates the D0.
4. Conclusions
A simplified MAR protocol with low-temperature TL normalisation is
proposed. Compared to the conventional SAR and MAR protocols which
apply the test dose signal for correction, the MAR protocol with TL
normalisation has a much higher D0 at ~1000 Gy, which might be able
to increase the dating limit of pIRIR to ~600 ka. To make sure all the
aliquots have the same sensitivity on the low-temperature TL peak, the
TL signals should be measured either before any treatment or after all
the aliquots have been stimulated. Applying this MAR protocol with
MET-pIRIR290 signal on two loess samples get De values consistent with
the expected values up to ~1200 Gy, however applications on three
fluvial and alluvial samples get significantly overestimated De values,
which is a result of partial-bleaching of the high-temperature MET-pIRIR
signals. Simulated fading correction with Kars et al. (2008) and Lamothe
et al. (2003) shows that the age will be over-corrected if the laboratory
DRC has an underestimated D0, and the degree of age over-correction
will be higher with older samples and larger fading rates.
8
J. Zhang and S. Tsukamoto
Radiation Measurements 157 (2022) 106827
Declaration of competing interest
Huntley, D.J., 2006. An explanation of the power-law decay of luminescence. J. Condens.
Matter Phys. 18, 1359–1365.
Huntley, D.J., Baril, M.R., 1997. The K content of the K-feldspars being measured in
optical dating or in thermoluminescence dating. Ancient TL 15, 11–13.
Huntley, D.J., Hancock, R.G.V., 2001. The Rb contents of the K-feldspar grains being
measured in optical dating. Ancient TL 19, 43–46.
Huntley, D.J., Lamothe, M., 2001. Ubiquity of anomalous fading in K-feldspars and the
measurement and correction for it in optical dating. Can. J. Earth Sci. 38,
1093–1106.
Huntley, D.J., Lian, O.B., 2006. Some observations on tunnelling of trapped electrons in
feldspars and their implications for optical dating. Quat. Sci. Rev. 25, 2503–2512.
Ito, K., Tamura, T., Tsukamoto, S., 2017. Post-IR IRSL dating of K-feldspar from last
interglacial marine terrace deposits on the Kamikita coastal plain, northeastern
Japan. Geochronometria 44, 352–365.
Kars, R.H., Reimann, T., Ankjaergaard, C., Wallinga, J., 2014a. Bleaching of the post-IR
IRSL signal: new insights for feldspar luminescence dating. Boreas 43, 780–791.
Kars, R.H., Reimann, T., Wallinga, J., 2014b. Are feldspar SAR protocols appropriate for
post-IR IRSL dating? Quat. Geochronol. 22, 126–136.
Kars, R.H., Wallinga, J., Cohen, K.M., 2008. A new approach towards anomalous fading
correction for feldspar IRSL dating - tests on samples in field saturation. Radiat.
Meas. 43, 786–790.
King, G.E., Burow, C., Roberts, H.M., Pearce, N.J.G., 2018. Age determination using
feldspar: evaluating fading-correction model performance. Radiat. Meas. 119,
58–73.
Kreutzer, S., Schmidt, C., Fuchs, M.C., Dietze, M., Fischer, M., Fuchs, M., 2012.
Introducing an R package for luminescence dating analysis. Ancient TL 30 (1), 1–8.
Kreutzer, S., Schmidt, C., DeWitt, R., Fuchs, M., 2014. The a-value of polymineral fine
grain samples measured with the post-IR IRSL protocol. Radiat. Meas. 69, 18–29.
Lai, Z.P., 2010. Chronology and the upper dating limit for loess samples from Luochuan
section in the Chinese Loess Plateau using quartz OSL SAR protocol. J. Asian Earth
Sci. 37, 176–185.
Lamothe, M, Auclair, M, Hamzaoui, C, Huot, S, 2003. Towards a prediction of long-term
anomalous fading of feldspar IRSL. Radiat. Meas. 37, 493–498.
Li, B., Jacobs, Z., Roberts, R.G., 2017. An improved multiple-aliquot regenerative-dose
(MAR) procedure for post-IR IRSL dating of K-feldspar. Ancient TL 35, 1–10.
Li, B., Jacobs, Z., Roberts, R.G., Li, S.H., 2013. Extending the age limit of luminescence
dating using the dose-dependent sensitivity of MET-pIRIR signals from K-feldspar.
Quat. Geochronol. 17, 55–67.
Li, B., Li, S.-H., 2008. Investigations of the dose-dependent anomalous fading rate of
feldspar from sediments. J. Phys. D Appl. Phys. 41, 225502.
Li, B., Li, S.-H., 2011. Luminescence dating of K-feldspar from sediments: a protocol
without anomalous fading correction. Quat. Geochronol. 6, 468–479.
Li, B., Li, S.-H., 2012. Luminescence dating of Chinese loess beyond 130 ka using the nonfading signal from K-feldspar. Quat. Geochronol. 10, 24–31.
Li, S.-H., 1992. Development and Application of Stimulated Luminescence Dating
Methods for Sediments. Unpublished Ph.D. Thesis, University of Wales,
Aberystwyth.
Li, S.-H., Wintle, A.G., 1991. Sensitivity changes of luminescence signals from colluvial
sediments after different bleaching procedures. Ancient TL 9, 50–53.
Li, S.-H., Wintle, A.G., 1992. Luminescence sensitivity change due to bleaching of
sediments. Int. J. Radiat. Appl. Instrum. Nucl. Tracks Radiat. Meas. 20, 567–573.
Li, Y., Tsukamoto, S., Frechen, M., Gabriel, G., 2018a. Timing of fluvial sedimentation in
the Upper Rhine Graben since the Middle Pleistocene: constraints from quartz and
feldspar luminescence dating. Boreas 47, 256–270.
Li, Y., Tsukamoto, S., Long, H., Zhang, J., Yang, L., He, Z., Frechen, M., 2018b. Testing
the reliability of fading correction methods for feldspar IRSL dating: a comparison
between natural and simulated-natural dose response curves. Radiat. Meas. 120,
228–233.
Li, G., Yang, H., Stevens, T., Zhang, X., Zhang, H., Wei, H., Zheng, W., Li, L., Liu, X.,
Chen, J., Xia, D., Oldknow, C., Ye, W., Chen, F., 2020. Differential ice volume and
orbital modulation of Quaternary moisture patterns between Central and East Asia.
Earth Planet Sci. Lett. 530, 115901.
Lomax, J., Wolf, D., Meliksetian, K., Wolpert, T., Sahakyan, L., Hovakimyan, H.,
Faust, D., Fuchs, M., 2022. Testing post-IR-IRSL dating on Armenian loess-palaeosol
sections against independent age control. Quat. Geochronol. 69, 101265.
Liritzis, I., Stamoulis, K., Papachristodoulou, C., Ioannides, K., 2013. A re-evaluation of
radiation dose-rate conversion factors. Mediterr. Archaeol. Archaeom. 13, 1–15.
Liu, J.F., Murray, A., Sohbati, R., Jain, M., 2016. The effect of test dose and first IR
stimulation temperature on post-IR IRSL measurements on rock slices.
Geochronometria 43, 179–187.
Lowick, S.E., Preusser, F., Pini, R., Ravazzi, C., 2010. Underestimation of fine grain
quartz OSL dating towards the Eemian: comparison with palynostratigraphy from
Azzano Decimo, northeastern Italy. Quat. Geochronol. 5, 583–590.
McGuire, C., Rhodes, E.J., 2015a. Determining fluvial sediment virtual velocity on the
Mojave River using K-feldspar IRSL: initial assessment. Quat. Int. 362, 124–131.
McGuire, C., Rhodes, E.J., 2015b. Downstream MET-IRSL single-grain distributions in
the Mojave River, southern California: testing assumptions of a virtual velocity
model. Quat. Geochronol. 30, 239–244.
Murray, A., Arnold, L.J., Buylaert, J.-P., Gu´
erin, G., Qin, J., Singhvi, A.K., Smedley, R.,
Thomsen, K.J., 2021. Optically stimulated luminescence dating using quartz. Nat.
Rev. Methods Pri. 1, 72.
Murray, A.S., Roberts, R.G., 1998. Measurement of the equivalent dose in quartz using a
regenerative-dose single-aliquot protocol. Radiat. Meas. 29, 503–515.
Murray, A.S., Schmidt, E.D., Stevens, T., Buylaert, J.P., Markovic, S.B., Tsukamoto, S.,
Frechen, M., 2014. Dating Middle Pleistocene loess from Stari Slankamen
The authors declare that they have no known competing financial
interests or personal relationships that could have appeared to influence
the work reported in this paper.
Data availability
Data will be made available on request.
Acknowledgements
Sabine Mogwitz and Sonja Riemenschneider are thanked for sample
preparation, and Petra Posimowski is thanked for gamma spectrometry
measurements. We thank Yan Li, Wahid Abbas and Hao Long for col
lecting the studied samples. We would like to thank the anonymous
reviewer and the editor – Geoff Duller for the constructive comments
which greatly improved the manuscript.
Appendix A. Supplementary data
Supplementary data to this article can be found online at https://doi.
org/10.1016/j.radmeas.2022.106827.
References
Abbas, W., Zhang, J., Tsukamoto, S., Ali, S., Frechen, M., Reicherter, K., 2022.
Pleistocene-Holocene deformation and seismic history of the Kalabagh Fault in
Pakistan using OSL and post-IR IRSL dating. Quat. Int. />quaint.2022.01.007 (in press).
Aitken, M.J., 1985. Thermoluminescence Dating. Academic Press, London.
Aitken, M.J., 1998. An Introduction to Optical Dating. Clarendon Press.
Aitken, M.J., Bussell, G.D., Driver, H.S.T., 1979. Zero-glow monitoring (ZGM). Ancient
TL 9, 13–15.
Brennan, B.J., Lyons, R.G., Phillips, S.W., 1991. Attenuation of alpha particle track dose
for spherical grains. Int. J. Radiat. Appl. Instrum. Nucl. Tracks Radiat. Meas. 18,
249–253.
Bøtter-Jensen, L., Andersen, C.E., Duller, G.A.T., Murray, A.S., 2003. Developments in
radiation, stimulation and observation facilities in luminescence measurements.
Radiat. Meas. 37, 535–541.
Buylaert, J.P., Jain, M., Murray, A.S., Thomsen, K.J., Thiel, C., Sohbati, R., 2012.
A robust feldspar luminescence dating method for Middle and Late Pleistocene
sediments. Boreas 41, 435–451.
Buylaert, J.P., Murray, A.S., Thomsen, K.J., Jain, M., 2009. Testing the potential of an
elevated temperature IRSL signal from K-feldspar. Radiat. Meas. 44, 560–565.
Buylaert, J.P., Thiel, C., Murray, A.S., Vandenberghe, D.A.G., Yi, S.W., Lu, H.Y., 2011.
IRSL and post-IR IRSL residual doses recorded in modern dust samples from the
Chinese Loess Plateau. Geochronometria 38, 432–440.
Buylaert, J.P., Vandenberghe, D., Murray, A.S., Huot, S., De Corte, F., Van den Haute, P.,
2007. Luminescence dating of old (> 70 ka) Chinese loess: a comparison of singlealiquot OSL and IRSL techniques. Quat. Geochronol. 2, 9–14.
Chapot, M.S., Roberts, H.M., Duller, G.A.T., Lai, Z.P., 2012. A comparison of natural- and
laboratory-generated dose response curves for quartz optically stimulated
luminescence signals from Chinese Loess. Radiat. Meas. 47, 1045–1052.
Chen, Y.W., Li, S.H., Li, B., 2013. Residual doses and sensitivity change of post IR IRSL
signals from potassium feldspar under different bleaching conditions.
Geochronometria 40, 229–238.
Chen, Y.W., Li, S.H., Li, B., Hao, Q.Z., Sun, J.M., 2015. Maximum age limitation in
luminescence dating of Chinese loess using the multiple-aliquot MET-pIRIR signals
from K-feldspar. Quat. Geochronol. 30, 207–212.
Colarossi, D., Duller, G.A.T., Roberts, H.M., 2018. Exploring the behaviour of
luminescence signals from feldspars: implications for the single aliquot regenerative
dose protocol. Radiat. Meas. 109, 35–44.
Debenham, N.C., Aitken, M.J., 1984. Thermoluminescence dating of stalagmitic calcite.
Archaeometry 26, 155–170.
Ding, Z.L., Derbyshire, E., Yang, S.L., Yu, Z.W., Xiong, S.F., Liu, T.S., 2002. Stacked 2.6Ma grain size record from the Chinese loess based on five sections and correlation
with the deep-sea δ18O record. Paleoceanography 17, 5-1-5-21.
Duller, G.A.T., 1991. Equivalent dose determination using single aliquots. Nucl. Tracks
Radiat. Meas. 18, 371–378.
Duller, G.A.T., 1994. Luminescence dating of poorly bleached sediments from Scotland.
Quat. Sci. Rev. 13, 521–524.
Fu, X., Li, S.-H., 2013. A modified multi-elevated-temperature post-IR IRSL protocol for
dating Holocene sediments using K-feldspar. Quat. Geochronol. 17, 44–54.
Gu´erin, G., Mercier, N., Nathan, R., Adamiec, G., Lefrais, Y., 2012. On the use of the
infinite matrix assumption and associated concepts: a critical review. Radiat. Meas.
47, 778–785.
9
J. Zhang and S. Tsukamoto
Radiation Measurements 157 (2022) 106827
Schmidt, C., Bă
osken, J., Kolb, T., 2018. Is there a common alpha-efficiency in
polymineral samples measured by various infrared stimulated luminescence
protocols? Geochronometria 45, 160–172.
Smith, B.W., Rhodes, E.J., Stokes, S., Spooner, N.A., 1991. Optical dating of quartz.
Radiat. Protect. Dosim. 34 (14), 75–78.
Stevens, T., Buylaert, J.-P., Thiel, C., Újv´
ari, G., Yi, S., Murray, A.S., Frechen, M., Lu, H.,
2018. Ice-volume-forced erosion of the Chinese Loess Plateau global Quaternary
stratotype site. Nat. Commun. 9, 983.
Stokes, S., Gaylord, D.R., 1993. Optical dating of holocene dune sands in the ferris dune
field, Wyoming. Quat. Res. 39, 274–281.
Spooner, N.A., 1992. Optical dating - preliminary-results on the anomalous fading of
luminescence from feldspars. Quat. Sci. Rev. 11, 139–145.
Thiel, C., Buylaert, J.P., Murray, A., Terhorst, B., Hofer, I., Tsukamoto, S., Frechen, M.,
2011. Luminescence dating of the Stratzing loess profile (Austria) - testing the
potential of an elevated temperature post-IR IRSL protocol. Quat. Int. 234, 23–31.
Thomsen, K.J., Murray, A.S., Jain, M., Botter-Jensen, L., 2008. Laboratory fading rates of
various luminescence signals from feldspar-rich sediment extracts. Radiat. Meas. 43,
1474–1486.
Timar-Gabor, A., Vandenberghe, D.A.G., Vasiliniuc, S., Panaoitu, C.E., Panaiotu, C.G.,
Dimofte, D., Cosma, C., 2011. Optical dating of Romanian loess: a comparison
between silt-sized and sand-sized quartz. Quat. Int. 240, 62–70.
Wallinga, J., Murray, A., Duller, G., 2000a. Underestimation of equivalent dose in singlealiquot optical dating of feldspars caused by preheating. Radiat. Meas. 32, 691–695.
Wallinga, J., Murray, A., Wintle, A., 2000b. The single-aliquot regenerative-dose (SAR)
protocol applied to coarse-grain feldspar. Radiat. Meas. 32, 529–533.
Wintle, A.G., Murray, A.S., 2006. A review of quartz optically stimulated luminescence
characteristics and their relevance in single-aliquot regeneration dating protocols.
Radiat. Meas. 41, 369–391.
Yi, S.W., Buylaert, J.P., Murray, A.S., Lu, H.Y., Thiel, C., Zeng, L., 2016. A detailed postIR IRSL dating study of the Niuyangzigou loess site in northeastern China. Boreas 45,
644–657.
Zhang, J.J., 2018. Behavior of the electron trapping probability change in IRSL dating of
K-feldspar: a dose recovery study. Quat. Geochronol. 44, 38–46.
Zhang, J.J., Li, S.H., Sun, J.M., Hao, Q.Z., 2018. Fake age hiatus in a loess section
revealed by OSL dating of calcrete nodules. J. Asian Earth Sci. 155, 139–145.
Zhang, J.J., Li, S.H., 2019. Constructions of standardised growth curves (SGCs) for IRSL
signals from K-feldspar, plagioclase and polymineral fractions. Quat. Geochronol.
49, 8–15.
Zhang, J.J., Li, S.H., 2020. Review of the post-IR IRSL dating protocols of K-feldspar.
Methods Protoc 3.
Zhao, H., Li, S.H., 2005. Internal dose rate to K-feldspar grains from radioactive elements
other than potassium. Radiat. Meas. 40, 84–93.
(Vojvodina, Serbia) - limitations imposed by the saturation behaviour of an elevated
temperature IRSL signal. Catena 117, 34–42.
Murray, A.S., Wintle, A.G., 2000. Luminescence dating of quartz using an improved
single-aliquot regenerative-dose protocol. Radiat. Meas. 32, 57–73.
Nian, X.M., Bailey, R.M., Zhou, L.P., 2012. Investigations of the post-IR IRSL protocol
applied to single K-feldspar grains from fluvial sediment samples. Radiat. Meas. 47,
703–709.
Olley, J.M., Roberts, R.G., Murray, A.S., 1997. Disequilibria in the uranium decay series
in sedimentary deposits at Allen’s cave, nullarbor plain, Australia: implications for
dose rate determinations. Radiat. Meas. 27, 433–443.
Peri´c, Z., Adolphi, E.L., Stevens, T., Ujvari, G., Zeeden, C., Buylaert, J.-P., Markovic, S.B.,
Hambach, U., Fischer, P., Schmidt, C., Schulte, P., Lu, H., Yi, S., Lehmkuhl, F.,
Obreht, I., Veres, D., Thiel, C., Frechen, M., Jain, M., Vă
ott, A., Ză
oller, L., Gavrilov, M.
B., 2019. Quartz OSL dating of late quaternary Chinese and Serbian loess: a cross
Eurasian comparison of dust mass accumulation rates. Quat. Int. 502 (Part A),
30–44.
Prescott, J.R., Hutton, J.T., 1994. Cosmic-ray contributions to dose-rates for
luminescence and esr dating - large depths and long-term time variations. Radiat.
Meas. 23, 497–500.
Qin, J.T., Chen, J., Li, Y.T., Zhou, L.P., 2018. Initial sensitivity change of K-feldspar pIRIR
signals due to uncompensated decrease in electron trapping probability: evidence
from radiofluorescence measurements. Radiat. Meas. 120, 131–136.
Qin, J.T., Zhou, L.P., 2012. Effects of thermally transferred signals in the post-IR IRSL
SAR protocol. Radiat. Meas. 47, 710–715.
Qin, J.T., Zhou, L.P., 2018. Luminescence dating of the Zeketai loess section in the Ili
Basin, northwestern China: methodological considerations. J. Asian Earth Sci. 155,
146–153.
Readhead, M., 2002. Absorbed dose fraction for 87Rb β particles. Ancient TL 20, 25–28.
Reimann, T., Notenboom, P.D., De Schipper, M.A., Wallinga, J., 2015. Testing for
sufficient signal resetting during sediment transport using a polymineral multiplesignal luminescence approach. Quat. Geochronol. 25, 26–36.
Reimann, T., Tsukamoto, S., Naumann, M., Frechen, M., 2011. The potential of using Krich feldspars for optical dating of young coastal sediments - a test case from DarssZingst peninsula (southern Baltic Sea coast). Quat. Geochronol. 6, 207–222.
Reimann, T., Tsukamoto, S., 2012. Dating the recent past (<500 years) by post-IR IRSL
feldspar – examples from the north sea and baltic sea coast. Quat. Geochronol. 10,
180–187.
Rhodes, E.J., 1990. Optical Dating of Quartz from Sediments. Unpublished D. Phil.
Thesis, University of Oxford.
Rhodes, E.J., 2011. Optically stimulated luminescence dating of sediments over the past
200,000 years. Annu. Rev. Earth Planet Sci. 39, 461–488.
Rhodes, E.J., Leathard, J.A., 2022. MET-IRSL used to track pre-depositional sediment
transport history. Quat. Geochronol. 70.
10