Coupled 3D neutron kinetics and thermalhydraulic characteristics of the Canadian supercritical water reactor
Bạn đang xem bản rút gọn của tài liệu. Xem và tải ngay bản đầy đủ của tài liệu tại đây (4.39 MB, 12 trang )
Nuclear Engineering and Design 298 (2016) 78–89
Contents lists available at ScienceDirect
Nuclear Engineering and Design
journal homepage: www.elsevier.com/locate/nucengdes
Coupled 3D neutron kinetics and thermalhydraulic characteristics of
the Canadian supercritical water reactor
David William Hummel ∗ , David Raymond Novog
Department of Engineering Physics, McMaster University, Canada
h i g h l i g h t s
•
•
•
•
A coupled spatial kinetics and thermalhydraulics model of the PT-SCWR was created.
Positive power excursions were demonstrated during accident-like transients.
The reactor will inherently self-shutdown in such transients with some delay.
A fast-acting shutdown system would limit the consequences of the power pulse.
a r t i c l e
i n f o
Article history:
Received 3 June 2015
Received in revised form
21 November 2015
Accepted 7 December 2015
Available online 7 January 2016
a b s t r a c t
The Canadian Supercritical Water-cooled Reactor concept, as an evolution of the CANada Deuterium
Uranium (CANDU) reactor, includes both pressure tubes and a low temperature heavy water moderator.
The current Pressure Tube type SCWR (PT-SCWR) concept features 64-element fuel assemblies placed
within High Efficiency Re-entrant Channels (HERCs) that connect to core inlet and outlet plena. Among
current SCWR concepts the PT-SCWR is unique in that the HERC separates multiple coolant and moderator regions, giving rise to coupled neutronic-thermalhydraulic feedbacks beyond those present in
CANDU or contemporary Light Water Reactors. The objective of this work was thus to model the coupled neutronic-thermal hydraulic properties of the PT-SCWR to establish the impact of these multiple
regions on the core’s transient behavior. To that end, the features of the PT-SCWR were first modeled
with the neutron transport code DRAGON to create a database of homogenized and condensed crosssections and thermalhydraulic feedback coefficients. These were used as input to a core-level neutron
diffusion model created with the code DONJON. The behavior of the primary heat transport system was
modeled with the thermalhydraulic system code CATHENA. A procedure was developed to couple the
outputs of DONJON and CATHENA, facilitating three-dimensional spatial neutron kinetics and coupled
thermalhydraulic analysis of the PT-SCWR core. Several postulated transients were initiated within the
coupled model by changing the core inlet and outlet boundary conditions. Decreasing coolant density
around the fuel was demonstrated to produce positive power excursions (i.e., the coolant void reactivity
around the fuel was positive), but such power transients were found to be inherently self-terminating
as low density coolant inevitably reaches other parts of the HERC geometry (where the void reactivity
is highly negative). Nevertheless, the observed power excursions potentially demonstrate the need for
fast-acting shutdown system intervention, similar to CANDU designs.
© 2015 The Authors. Published by Elsevier B.V. This is an open access article under the CC BY license
( />
1. Introduction
∗ Correspondence to: McMaster University, Dept. of Engineering Physics, 1280
Main Street, West John Hodgins Engineering Building, Room A315, Hamilton,
Ontario, Canada L8S 4L7. Tel.: +1 9055259140x24924.
E-mail addresses: ,
(D.W. Hummel).
Canada Nuclear Laboratories (formerly Atomic Energy of Canada
Limited), in collaboration with Natural Resources Canada and the
National Sciences and Engineering Research Council, has developed
a conceptual Supercritical Water-Cooled Reactor (SCWR) design
that is an evolution of the CANada Deuterium Uranium (CANDU)
reactor, featuring both pressure tubes and a low temperature heavy
water moderator. This Pressure Tube type SCWR (PT-SCWR), unlike
/>0029-5493/© 2015 The Authors. Published by Elsevier B.V. This is an open access article under the CC BY license ( />
D.W. Hummel, D.R. Novog / Nuclear Engineering and Design 298 (2016) 78–89
79
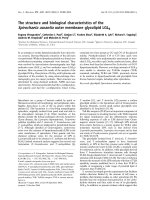
Fig. 1. PT-SCWR HERC concept with 64-element fuel assembly.
a typical CANDU or Pressurized Heavy Water Reactor (PHWR), contains vertical fuel channels, light water coolant, and uses batch
refueling while retaining a separate low-pressure heavy water
moderator (Leung et al., 2011).
In the PT-SCWR concept, coolant travels in a re-entrant path
through the core in what is referred to as the High Efficiency ReEntrant Channel (HERC) (Yetisir et al., 2013). Fig. 1 shows how
coolant at 350 ◦ C and 25.8 MPa enters an inlet plenum and then
travels downward through a center flow tube in each fuel channel.
The coolant then reverses at the bottom of the channels before flowing upwards around the fuel pins towards the outlet plenum, where
it exits at 625 ◦ C. Thermal isolation between the supercritical light
water coolant and the low temperature and pressure heavy water
moderator is provided by a ceramic insulator within the pressure
tube. The fuel is a PuO2 –ThO2 mixture in two concentric rings of
32 elements (averaging 13 weight per cent PuO2 ) with a 5 m active
length and zirconium modified stainless steel cladding (Pencer and
Colton, 2013).
One of the stated design goals for the PT-SCWR concept was
to have a negative Coolant Void Reactivity (CVR). Here coolant
“void” refers to the absence of high density coolant within the
channel (supercritical fluids exhibit large density variation over
small changes in temperature without a phase change). The design
meets the criterion for negative CVR if the entire cross section
of the channel (i.e., both the center flow tube and fuel region) is
assumed to void uniformly. This does not necessarily imply, however, that coolant void in the flow tube and fuel region must both
have negative worth when voided separately. Lattice-level calculations show that while the reactivity is large and negative when
exclusively voiding the center flow tube, the reactivity is positive
when exclusively voiding the fuel region.
Several fast transients can be postulated where the coolant density around the fuel decreases before changes propagate to the
center flow tube. These density changes have corresponding reactivity feedbacks that will affect the reactor power and in turn the
heat being delivered to the fluid, feeding back to the fluid density.
The separation of coolant regions within the channel, in addition
to the decoupling from the heavy water moderator, makes this
transient progression unique as compared to CANDU (where there
is only a single coolant flow path) or typical light water reactors
(where there is no separate moderator). Previous analyses of such
transients in the PT-SCWR concept (e.g., Wu et al., 2015) did not
include this reactivity feedback. The objective of this study was thus
to model several postulated coupled neutronic-thermalhydraulic
transients in the PT-SCWR concept and observe the impact of these
separate coolant density reactivity feedbacks.
2. Modeling methodology
The complex multiphysics of coupled spatial neutron kinetics and thermalhydraulic transients typically require dedicated
computational solvers which are coupled externally. Coupling of
thermalhydraulics and neutronics in the PT-SCWR concept has
been studied extensively at both the channel level (e.g., Shan et al.,
2010) and core level (e.g., Yang et al., 2011), but such past studies
focused on steady-state neutron transport or diffusion instead of
spatial kinetics. In this work the PT-SCWR was modeled at the core
level by coupling the neutron diffusion and spatial kinetics code
DONJON and the thermalhydraulic system code CATHENA. Fewgroup cross sections and thermalhydraulic feedback coefficients for
the DONJON model were generated with the mutligroup neutron
transport code DRAGON. The codes, models, and coupling procedures are described below.
2.1. Core neutronics: DRAGON/DONJON
DRAGON is an open-source code developed at École Polytechnique de Montréal that is capable of solving the multigroup neutron
transport equation with burnup in two and three dimensions
(Marleau et al., 2008). In this study DRAGON was used to generate
input data for DONJON from a series of two-dimensional lattice calculations. DONJON is an open-source code also developed at École
Polytechnique de Montréal (Varin et al., 2005). It is capable of solving the neutron diffusion and spatial kinetics equations in three
80
D.W. Hummel, D.R. Novog / Nuclear Engineering and Design 298 (2016) 78–89
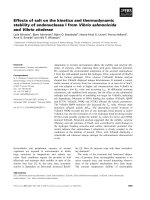
Fig. 2. DRAGON spatial mesh for the infinite lattice (left) and reflector multicell (right).
dimensions, and is used in this work to calculate the steady-state
and transient power distribution in the PT-SCWR.
DRAGON, as part of the industry standard toolset for modeling CANDU, has a substantive history in modeling pressure tube
type, heavy water moderated reactors. Nevertheless, there has been
comparatively little application to supercritical water conditions
until recently. Preliminary computational benchmarks have established that DRAGON is suitable for modeling the PT-SCWR, but that
is the extent of the validation thus far (Hummel et al., 2013). Since
DONJON receives all its input from DRAGON, it can be assumed
that DONJON has equal capability of accurately representing the
PT-SCWR.
2.1.1. DRAGON lattice cell calculations
The PT-SCWR design includes flow-limiting orifices at the inlet
of each channel with sizes specific to each channel’s power so that
there is a uniform coolant enthalpy increase (and density decrease)
over the core. The large reduction in coolant density along the
PT-SCWR channel (from 615 kg m−3 to 68 kg m−3 , mostly in the
fuel region of the assembly) has a significant impact on the lattice physics and has been the subject of much previous study. The
typical approach to capture the effect in two-dimensional lattice
calculations has been to model several lattice cells with different
local conditions (i.e., fluid densities and material temperatures)
(Hummel et al., 2013; Harrison and Marleau, 2013). This approach
was used in this work as well. Multiple lattice cells were evaluated with a set of 20 different local conditions, corresponding to
25 cm increments from channel inlet to outlet, thereby capturing
the axial variation in neutronic properties. Across the core, several
interior and exterior lattice cells were modeled to capture radial
and reflector effects on neutron transport as discussed below.
According to each channel’s radial position in the core and
its proximity to the D2 O reflector, the approximation of a single
cell within an infinite lattice of identical cells (i.e., with reflective
boundary conditions) is not always valid. Previous study has shown
that this heterogeneity can be captured with an additional “multicell” model for channels near the core periphery (Salaun et al.,
2014). Instead of a single channel, this multicell includes channels
on the “corner” (with other channels on two edges of the cell) and
“sides” (with other channels on three edges of the cell) of the core,
as well as a portion of the heavy water reflector. The neutron transport solution for this entire multicell gives a much more accurate
representation of these edge cells than the infinite lattice solution
(Salaun et al., 2014).
Fig. 2 shows how both cell geometries were modeled for the
DRAGON flux calculation. The infinite lattice cell contained 118
spatial regions and the multicell, with the addition of 50 cm of
heavy water reflector, contained 1492 regions. Void boundary conditions were used on the exterior edges and reflective conditions
on all interior boundaries. Both cell models used 14 quadrature
angles and an integration line density of 25 cm−1 in the DRAGON
collision probability calculation. These spatial discretizations were
established via sensitivity analysis on the predicted infinite lattice multiplication factor (kinf ), wherein finer spatial meshing or
higher-order tracking failed to appreciably affect the result.
Each cell (infinite, side, and corner) was evaluated at the
aforementioned 20 axial positions, each with its own local thermalhydraulic conditions, resulting in 60 sets of homogenized and
condensed cross-sections (i.e., 20 each for the infinite lattice, side,
and corner cells). Additional cross-sections were generated for
the heavy water reflector during the multicell calculation. These
calculations were performed with DRAGON 3.06J using the International Atomic Energy Agency’s 172 group nuclear data library
(International Atomic Energy Agency, 2012).
The procedure used for calculating fuel burnup with DRAGON
was typical of most lattice calculations. After an initial flux calculation the change in fuel isotopics is calculated over a discrete
time-step during which the flux (and therefore power and thermalhydraulic parameters) is assumed to be constant. The flux
calculation is then repeated with the new isotopics, which together
serve as the initial conditions for the next time-step. The step size
is smaller with fresh fuel in order to accurately capture the accumulation of saturating fission and activation products, but larger
step sizes are acceptable later in the calculation as the fuel evolves
monotonically. Note that the power and thermalhydraulic parameters were constant over the entire burnup calculation, and so there
are no incorporated “history” effects for changing operating conditions during the fuel cycle.
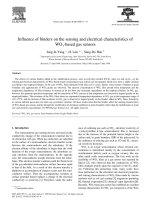
This work used 64 discrete steps as determined by a sensitivity study on the calculatedkeff . Fig. 3 shows the evolution of kinf
and the concentration of the dominant fissile isotope (Pu239) with
burnup at three axial positions along the channel. Identical burnup
calculations were executed at each axial location for the infinite,
side, and corner lattice geometries (the latter two being calculated
simultaneously in the multicell geometry).
Each cell result was homogenized by DRAGON to create fewenergy-group and cell-averaged input parameters for the DONJON
model. These included macroscopic cross-sections for fission,
absorption, scattering, and transport (i.e., diffusion coefficients).
With the high plutonium content in PT-SCWR fuel, it is expected
that the two-group energy structure typically employed in LWR and
CANDU analyses would not accurately capture the effect of the low
energy resonances in the homogenized cross-sections. An eightgroup structure was thus selected based on previous studies of
D.W. Hummel, D.R. Novog / Nuclear Engineering and Design 298 (2016) 78–89
81
DRAGON was also used to create the thermalhydraulic feedback
database for the three-dimensional neutron kinetics simulations.
For these calculations the reference thermalhydraulic parameters
were perturbed multiple times at each of the 20 axial locations
at each burnup step and new sets of homogenized and condensed
cross-section were generated. DRAGON’s CFC module then used the
reference and perturbed cross-sections to create a database of first
and second order coefficients that describe how each homogenized
value changes with the thermalhydraulic parameters. The database
(contained within the FBM data structure), along the with reference
condition cross-sections, were necessary to create the core-level
kinetics model with DONJON.
Fig. 3. Evolution of the infinite lattice cell with burnup.
high plutonium content mixed-oxide fuel (Kozlowski and Downar,
2006). The homogenized eight-group cross-sections for the infinite
lattice cell, side cell, and corner cell, at each of the 20 axial positions,
form the reference fuel cross-sections for steady-state core-level
calculations in DONJON.
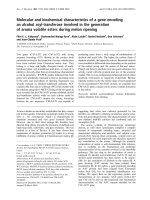
The lattice results can provide insight into the expected behavior of the core. At each of the 20 reference conditions the CVR was
determined by perturbing the coolant density down to 10−4 kg m−3
and calculating the reactivity worth of the change in kinf . Fig. 4
shows the CVR calculated by DRAGON when separately voiding
the fuel region and center flow tube at three burnup states: fresh
fuel, mid-burnup fuel, and exit-burnup fuel. The reactivity worth
of void in the flow tube is shown to be consistently (and strongly)
negative, whereas void exclusively in the fuel region has positive
worth. The total reactivity worth of voiding the entire cross-section
is very close to the linear sum of both channels’ separate worth,
and is thus consistently negative as required by the design specifications. Nevertheless, the positive void reactivity in the fuel
region raises the possibility of positive power excursions in cases
of flow stagnation or reversal (where low density fluid re-enters
the fuel-region from the outlet plenum). Such transients would
be inherently self-limiting since the density in the flow tube will
eventually equilibrate, causing a large negative reactivity insertion.
Furthermore, since reverse coolant flow will lead to potentially
larger disparity in axial coolant conditions, evolving flux tilts may
occur during the period of time prior to self-shutdown. Accurately
predicting these transients thus requires coupled thermalhydraulic
feedbacks for both the flow tube and fuel region in each channel,
essentially doubling the number of feedback paths as compared to
typical core-level coupled transient calculations.
Fig. 4. Infinite lattice CVR calculated with DRAGON.
2.1.2. DONJON calculations
The geometry, thermalhydraulic conditions, and batch fueling
scheme of the PT-SCWR is quarter symmetric, so it was only necessary to include one quarter of the 336 fuel channels to model
the core (Pencer et al., 2013). The 84 channels were modeled with
20 axial nodes, each corresponding to a lattice cell calculation (i.e.,
infinite lattice, side, and corner) evaluated at a reference thermalhydraulic condition. The quarter core is thus modeled with 1680
cubic nodes. A 100 cm radial reflector and 75 cm axial reflector at
each end (both D2 O) were also included in the model with an additional 1820 equally sized nodes. The reference three-batch fueling
scheme (relating the position of first, second, and third cycle fuel
assemblies) was implemented as shown in Fig. 5.
The channel power distribution is necessarily a function of the
fuel burnup distribution in the core. It is expected that each assembly will age differently depending on its position during each batch
cycle. Further, it is expected that after many identical cycles the
channel power history in each location will be the same from one
cycle to the next (i.e., the channel power and burnup distribution
are in equilibrium). The modeling strategy started with an informed
guess of the burnup distribution and then simulate multiply cycles
until equilibrium was achieved.
In this procedure the DONJON model calculates the core flux
and power distribution at an instant in time (a core “snapshot”)
and then uses that distribution to age the fuel over a time step during which the power is assumed to be constant (i.e., by advancing
through the homogenized DRAGON cross-sections as a function of
local burnup). The flux calculation and fuel evolution calculation
are repeated until the end-of-cycle criterion is reached. This work
used time steps of 1.0 Full Power Days (FPD) and an end-of-cycle
criterion of core keff <1.010. At this point the fuel assemblies are
removed, shuffled, and added to the core according to the batchcycle scheme, and the process is repeated for the next cycle. One
hundred batch cycles were simulated, although it was observed
that the individual time-dependent node powers and burnups converged in less than 30. Snapshots corresponding to the beginning,
middle, and end of the equilibrium cycle were considered to be
encompassing of the typical state of the core and were thus selected
for detailed observation in subsequent transient runs.
Note that the DONJON model in Fig. 5 contains no control
devices or other neutron absorbers for reactivity hold-down during the batch cycle. No such devices were part of the reference
PT-SCWR conceptual design while this work was being performed.
Since burnup was evaluated in the reference DRAGON cells with
a single reference set of thermalhydraulic parameters, it is inherently assumed in this DONJON model that each channel possesses
the same axial temperature and density distributions during the
batch cycle calculations. All else being equal, this is contrary to the
channel power evolution that occurs as a result of fuel depletion
during a cycle, i.e., different channel powers should provide different axial fuel temperature and coolant profiles as functions of
time. Without bulk and spatial power control provided by movable control rods and other flux shaping devices (e.g., partial length
82
D.W. Hummel, D.R. Novog / Nuclear Engineering and Design 298 (2016) 78–89
Fig. 5. PT-SCWR core modeled in DONJON.
rods, burnable absorbers, etc.), the core and channel thermalhydraulic conditions would vary significantly over time within each
burnup cycle. Consequently it was assumed that the flux shaping
devices in the final design will be capable of managing channel
power deviations within a small percentage of the reference, ensuring flow-power matching for each channel during the entire cycle.
Flow power matching was accomplished in the present work by
using unique inlet orifice sizes at each core snapshot, thereby creating thermalhydraulic conditions which are congruent with the
expected behavior of the core with control devices. More details
on channel power and orifice sizing are provided in the following
section.
2.2. Core thermalhydraulics: CATHENA
Canadian Algorithm for THErmalhydraulic Network Analysis
(CATHENA) is a thermalhydraulics code developed by AECL primarily for Loss of Coolant Accident (LOCA) analyses of CANDU reactors
(Hanna, 1998). It uses a one-dimensional, two-fluid representation to calculate transient flows in piping networks. The included
GENeralized Heat Transfer Package (GENHTP) allows calculation
of convective heat transfer from surfaces to the fluid, as well as
conduction within walls. The code has recently been enhanced
to function in supercritical flow conditions with an expanded set
of fluid properties, although it currently has no wall friction or
heat transfer correlations specific to supercritical water (Wang and
Wang, 2013). In lieu of these, standard heat transfer correlations are
applied for wall friction and heat transfer. It should be noted that
while CATHENA is a mature analysis tool for CANDU, these modifications and extensions for the supercritical regime in CATHENA
MOD-3.5d/Rev 3 have not yet been extensively validated and so
results should be considered preliminary.
The PT-SCWR has been modeled as in Fig. 1 with pressure
and temperature boundary conditions for simplicity, omitting the
coolant pumps, turbine, and other elements that are expected to
be part of the primary circuit. Each of the 84 channels in the
quarter-core is represented as four identical parallel pipes, thus
giving the correct total flow for the entire core. Component dimensions are consistent with previous models of the PT-SCWR (Wang
and Wang, 2013).
Power is assumed to be homogeneously generated in the fuel
material and heat conducted towards its surface and through the
sheath. Each ring of the fuel assembly is modeled separately in this
regard with the relative power distribution being determined by
lattice physics simulations. From the fuel sheath heat is convected
to the coolant in the fuel region. Convection heat transfer is also
modeled across the pipe wall separating the center flow tube and
fuel region, as well as through the pressure tube/insulator assembly to a boundary condition representing the moderator. To align
with the DONJON model, each channel (also including the flow tube
and all heat transfer elements) is modeled with 20 axial nodes. The
power distribution output from DONJON can thus be transferred
one-to-one to the CATHENA input without any complicated mapping or partitioning. A simplified schematic of the CATHENA model
is shown in Fig. 6. The quarter-core CATHENA model shown in
the figure consists of 1014 individual components, including 4124
hydraulic volumes, 420 GENHTP models and 84 control connections (the valve controllers).
Valve type components, located at the junction of the inlet nozzle and center flow tube in each channel, are used as flow-limiting
orifices that match each channel’s flow to its power, ensuring a
uniform coolant outlet temperature of 625 ◦ C. This flow-power
matching is a key design criteria specified for the PT-SCWR. A PI
(Proportional–Integral) controller is used to find a unique open
fraction for each channel under steady-state conditions, but the
orifice size is then fixed for all subsequent transients. The requirements for these flow-limiting orifices were studied previously and
it was concluded that no fixed open fraction could ensure acceptable temperature drift during a cycle without a reactivity control
system shaping the channel power distribution (Hummel and
Novog, 2014). This work proceeds assuming that power shaping
devices will manage local power such that the deviations from the
D.W. Hummel, D.R. Novog / Nuclear Engineering and Design 298 (2016) 78–89
83
Fig. 6. CATHENA idealization of the PT-SCWR.
reference channel power distribution are acceptably low. Future
analyses will address the radial and axial power tilts that may occur
as a result of control system designs when such designs become
available.
2.3. Neutronics-thermalhydraulics coupling and transient
simulation procedures
The DONJON and CATHENA codes were developed independently and thus have no native provisions for coupling with one
another. It was therefore necessary to create a new coupling procedure that could handle the multi-coolant feedback effects unique
to the re-entrant PT-SCWR design. This was facilitated by DONJON’s
FUELMAP data structure, which contains the current conditions in
each node of the core model including fuel burnup, power, coolant
density and temperature (in both the flow tube and fuel region),
and fuel temperature. This FUELMAP, saved as a file, is read by
an external script which passes power information to CATHENA
via modifications to the CATHENA input file, and in turn thermalhydraulic information to DONJON via changes in the FUELMAP
structure. Modifications to the DONJON source code were necessary so that the coolant in the flow tube and fuel region could be
treated separately in each node of the model.
Initial conditions for transients were created by coupling
the steady-state DONJON and CATHENA models, thus ensuring self-consistent distributions of power and thermalhydraulic
parameters. This steady-state coupling procedure was iterative
with under-relaxation of the power distribution to ensure convergence. Three initial core states, corresponding to beginning, middle,
and end of the equilibrium batch fueling cycle, were selected
as initial conditions for transient analyses. The valve controllers
were enabled within the CATHENA model during each steady-state
84
D.W. Hummel, D.R. Novog / Nuclear Engineering and Design 298 (2016) 78–89
Fig. 7. PT-SCWR channel power distributions used as initial conditions.
iteration, and thus each initial condition corresponds to a flowpower matched state. These initial channel power and flow
distributions are shown in Fig. 7.
DONJON uses the Improved Quasi-Static (IQS) method to model
spatial neutron kinetics in three dimensions (Varin et al., 2005).
The IQS module requires the initial forward and adjoint flux distributions (determined by the three dimensional neutron diffusion
calculation), the perturbation in macroscopic cross-sections, neutron kinetic data (delayed group fractions and precursor half-lives),
and the time step over which to evaluate the transient. A single
set of neutron kinetics parameters were evaluated for fuel near
the core mid-plane (2.375 m). Other studies have shown that these
parameters are only weakly dependent on the local conditions, so
this should be a valid approximation (Pencer et al., 2014). Since
D.W. Hummel, D.R. Novog / Nuclear Engineering and Design 298 (2016) 78–89
85
Fig. 8. Transient coupling procedure used for DONJON and CATHENA.
kinetics parameters are not natively calculated by DRAGON, for
this work data were taken from the standard output of an independently created SCALE/TRITON model of the PT-SCWR lattice cell
(Salaun et al., 2015).
The macroscopic cross-sections for the transient are provided
by the AFM module in DONJON. This module accesses the FeedBack
Matrix (FBM) of thermalhydraulic feedbacks (created by DRAGON)
and, given the values of thermalhydraulic parameters in each node,
generates complete cross-sections corresponding to the current
conditions in each node. The differences in cross-sections from the
previous step (calculated with the DMAC module) are then passed
to IQS. This process is summarized in Fig. 8.
The IQS module in DONJON and the CATHENA calculation both
use the same time step size. In the coupling algorithm shown in
Fig. 8, DONJON leads the transient over a step and CATHENA follows.
The size of the step is determined dynamically by the coupling algorithm based on the maximum power rate of change in each node.
If the maximum difference in node power from the previous step
exceeds 0.5%, the current step is reattempted with a smaller step
size. Sensitivity studies were performed to demonstrate that transient predictions did not deviate when power differences below
0.5% were used. Similarly, if the criterion is satisfied for multiple
consecutive steps the step size is increased. This work used minimum and maximum time steps of 0.0005 s and 1.0 s, respectively.
Transients were performed under steady-boundary conditions to
assess model stability and to ensure that the results fall within a
tight tolerance of the steady state initial conditions used in developing the model (generally less than 0.1% in total power deviation).
and outlet pressure. These boundary conditions are shown in the
CATHENA nodalization (Fig. 6) attached to the pump discharge
(the inlet boundary) and the turbine (the outlet boundary). Since
the inlet and outlet plena include no three dimensional effects
in the one-dimensional CATHENA model, the boundary condition
perturbations occur in all flow-power matched channels simultaneously and there were no radial power shape deviations expected
or observed.
3.1. Temporary perturbations to core boundary conditions
Figs. 9–11 show the transient results from a 2.5 ◦ C step reduction
to the coolant feedwater temperature. At 300 s the inlet temperature was stepped back up to the reference value. With the inlet
pressure remaining constant, the small temperature reduction is
accompanied by a similarly modest increase in coolant density.
3. Transient simulation results
The dynamic response of the system was determined using
various perturbations to the thermalhydraulic boundary conditions which represent the feedwater temperature, inlet pressure,
Fig. 9. Integral core parameters during inlet temperature step down.
86
D.W. Hummel, D.R. Novog / Nuclear Engineering and Design 298 (2016) 78–89
Fig. 12. Integral core parameters during inlet temperature step up.
Fig. 10. Axial profiles during inlet temperature step down at BOC.
According to the lattice results the density increase in the center
flow tube should have a positive reactivity effect and a negative
reactivity effect in the fuel region. Fig. 9 shows that the net effect is a
gradual power decrease, accompanied by a corresponding increase
in core flow under the constraint of constant pressure drop. For
both the BOC and MOC core states the reactor power eventually
reaches equilibrium at a new steady value (≈96% full power in the
former, ≈92% full power in the latter). At EOC, however, the reactivity feedbacks cascade (i.e., lower temperatures result in higher
densities in the fuel region, which leads to lower powers and even
lower temperatures) and the core power has an accelerating downward trajectory. The power transient is arrested when the inlet
temperature is returned to the reference value and the core returns
to the initial steady-state conditions. Without increasing the inlet
temperature the reactor would have likely self-shutdown from the
negative reactivity feedback cascade.
Figs. 10 and 11 show axial distributions in the core averaged
by plane (i.e., each point is the average of all 84 channels in the
quarter-core) for this transient at the BOC and EOC core states. The
magnitude of the coolant temperature feedbacks are much smaller
than the coolant density or fuel temperature feedbacks, so these
distributions were not included in the figures. The differences in
the initial axial power and fuel temperature distributions between
BOC and EOC are evident in the figures, as is the progression of the
negative feedback cascade at EOC. The positive reactivity added by
the fuel temperature decrease is evidently insufficient to arrest the
transient in the EOC case.
Fig. 11. Axial profiles during inlet temperature step down at EOC.
These results suggest that for the same perturbation of boundary conditions the coupled transient is more sensitive at EOC
than BOC (with MOC falling in between). The integrated relationships between fuel burnup and power distribution, cross-section
feedbacks, and initial conditions evidently result in amplified thermalhydraulic feedback later in the cycle, with the fuel temperature
feedback being at its lowest at EOC.
Fig. 12 shows a similar transient initiated by an equally sized
(2.5 ◦ C) step increase in the core inlet temperature. Again, at 300 s
the inlet temperature was returned to the reference value. The
progression of the transient is the opposite as before: the temperature increase results in a coolant density decrease, which has a net
positive reactivity effect. The power increase is accompanied by
a decrease in core flow under the constraint of constant pressure
drop. Even though the magnitude of the transient is larger later in
the cycle, unlike the previous case the transient at EOC reaches a
new steady power and there is no positive feedback cascade. This
can be partially attributed to the reduction in coolant void reactivity
at higher burnups as shown in the lattice physics results.
Fig. 13 shows a transient initiated by a rapid decrease and then
recovery in the core outlet pressure. This temporarily increases
the core pressure drop and thus flow, resulting in a coolant density decrease in the fuel region and in turn a power transient from
the negative reactivity feedback. The core eventually returns to the
original steady-state conditions after the flow recovers. The change
in coolant density and its effect on power are clearly evident in the
axial profiles shown in Fig. 14 (in this case for MOC). The magnitude
of the transient is also shown to be larger later in the batch cycle as
before.
Fig. 13. Integral core parameters during outlet pressure transient.
D.W. Hummel, D.R. Novog / Nuclear Engineering and Design 298 (2016) 78–89
87
Fig. 17. Integral core parameters during flow reversal transient at MOC.
Fig. 14. Axial profiles during outlet pressure transient at MOC.
3.2. Postulated transients in the primary heat transport system
Fig. 15. Integral core parameters during inlet pressure transient.
Figs. 15 and 16 show a transient initiated by a similar reduction
in the core inlet pressure. This has the opposite effect on the core
flow (by lowering the total pressure drop), so the coolant density in
the fuel region decreases and the reactivity feedback is positive. The
trends are opposite to those observed for the outlet perturbation
and are consistent with expectations. The core returns to its initial
conditions after the pressure and flow recover.
Fig. 16. Axial profiles during inlet pressure transient at MOC.
These simulated transients are meant to establish the behavior
of the coupled system in conditions evocative of serious accidents
in the Primary Heat Transport System (PHTS), including Loss-ofCoolant Accidents (LOCAs) and Loss-of-Flow Accidents (LOFAs). In
interpreting the results it is important to recognize that these transients only model the coupled kinetics-thermalhydraulic behavior
and do not attempt to model reactivity responses from control or
shutdown systems. Similarly, the CATHENA model contains none
of the proposed PHTS safety systems (e.g., relief valves and automatic depressurization systems) which are integral components of
the PT-SCWR safety design. Another key feature of the PT-SCWR is
the passive removal of heat via radiation to the moderator system,
which is also not included in this model and thus the peak temperatures are likely to be over-estimated (Yetisir et al., 2013). Finally,
the limitations of the CATHENA code prevent transitioning from
super to sub-critical pressures so the imposed pressure transients
are restricted to remain above 23.0 MPa.
This work is the first to study the inherent dynamics of the
PT-SCWR design by including distinct feedbacks for all important
phenomena. The coupled transient results presented below are for
the MOC core state only as the deviations for BOC and EOC are not
sufficient to affect the conclusions.
Figs. 17 and 18 show a “flow reversal” transient where the inlet
pressure rapidly drops below the outlet pressure, causing coolant
to flow backwards from the outlet plenum to the inlet plenum. This
type of response is representative of a large inlet pipe break (LOCA),
however in this case the outlet pressure remains high to give the
Fig. 18. Axial profiles during flow reversal transient at MOC.
88
D.W. Hummel, D.R. Novog / Nuclear Engineering and Design 298 (2016) 78–89
Fig. 19. Integral core parameters during LOCA-like transient at MOC.
largest possible reverse flow (in reality an inlet LOCA would lead
to system depressurization resulting in a smaller reverse pressure
differential). Fig. 17 shows the pressure, core power, and total core
flow transient. The axial property distributions in Fig. 18 show that
during the initial period when power is increasing there is a large
decrease in coolant density in the fuel region. This positive reactivity feedback results in a power excursion that peaks at 160% of full
power at approximately 6.4 s. The fuel temperature correspondingly increases with power, resulting in negative reactivity that
acts to terminate the power ramp. Eventually the coolant density
in the center flow tube decreases as well, providing large negative reactivity that reduces the power to near zero within a few
seconds.
The transient shown in Figs. 19 and 20 is similar to that above,
but in this case the inlet and outlet pressures decrease in a manner more similar to a realistic LOCA. The same phenomena are
observed as in the extreme flow-reversal case, however the peak
of the power excursion is slightly lower and the tail of the power
transient is longer. These changes are attributable to the smaller
reverse pressure differential and reduced reverse flow. Compared
to the previous transient, the coolant density decrease is slower in
the fuel region (thus delaying the addition of positive reactivity)
and correspondingly slower in the center flow tube (delaying the
addition of negative reactivity).
Figs. 21 and 22 show a “flow rundown” transient where the
inlet pressure exponentially decays to match the outlet pressure
over a ≈15 s period. This is similar to a postulated primary heat
transport pump rundown (or LOFA) without reactor shutdown. The
decreasing core flow again causes a coolant density decrease in the
Fig. 21. Integral core parameters during flow rundown transient at MOC.
Fig. 22. Axial profiles during flow rundown transient at MOC.
fuel region, resulting in a power excursion (peaking at approximately 120% of the initial value) at approximately 9 s. With the
channel flows nearly stagnant, it is evident that conduction through
the flow tube pipe wall delivers sufficient heat to the center coolant
that its density decreases, as show in Fig. 22 at 9 s. The reduction, combined with the elevated fuel temperatures, results in large
negative reactivity feedback that causes the reactor power to drop
below 10% by 30 s.
In general, the observed trend in these three transients is that
the faster the flow decreases the higher the peak of the power
excursion. However the rate of density change in the central flow
tube plays an important role in ultimately reducing the reactor
power and thus slower transients typically result in lower peak
powers, but longer duration power excursions.
4. Conclusions
Fig. 20. Axial profiles during LOCA-like transient at MOC.
A coupled thermalhydraulics and three dimensional spatial
kinetics model of the PT-SCWR conceptual design has been created.
The core physics model was based on lattice calculations that provided homogenized cross-section data for 60 different fuel types
spanning 20 axial locations of infinite lattice, edge and corner cells.
The model also included separate coolant feedbacks for the outer
fuel region and center flow tube, as required by the re-entrant fuel
design. The steady-state core was generated through a series of
snapshot calculations over several refueling cycles such that the
cycle behavior becomes self-similar (i.e., the core was in equilibrium). These initial conditions were then used to model several
D.W. Hummel, D.R. Novog / Nuclear Engineering and Design 298 (2016) 78–89
postulated transients initiated by changes to the core boundary
conditions. From the analysis of these transients it is possible
to make several conclusions regarding the PT-SCWR conceptual
design:
• The total CVR of the conceptual design is negative for cases involving uniform cross-sectional voiding (i.e., both the fuel region and
center flow tube void simultaneously).
• The design of the PT-SCWR fuel channel (i.e., the HERC concept)
results in coolant density decreases around the fuel having positive reactivity effects, even though the total CVR of the channel
is negative as required.
• As a consequence of the above, perturbations in the reactor PHTS
(either temperature or pressure) that reduce the coolant density
will result in temporary core power excursions.
• There were no perturbations that resulted in positive reactivity
cascade; i.e., all transient involving power increases were selfterminating.
• Three dimensional kinetics calculations show axially evolving
flux tilts during transients with negligible change in the radial
flux shape distribution.
• In postulated accident scenarios, such as LOCAs or LOFAs, there
will be a power excursion, the height of which depends on how
quickly the core flow is reduced (i.e., faster reduction results in a
higher pulse).
• Such power transients are inherently self-terminating since the
coolant density in the center flow tube inevitably decreases as
well, providing strong negative reactivity even without reactor
shutdown. This happens faster in transients with flow reversal
than with stagnation. During flow reversal low density fluid is
transported to the center flow tube, while under flow stagnation heat must be conducted through the flow tube pipe wall to
decrease the central flow tube coolant density.
• Given the speed and extent of the power excursions predicted
here it can be concluded that such events could be effectively
mitigated by fast acting shutdown system similar to those used
in standard CANDU designs. Transient analysis of certain CANDU6 LOCA events predicts power pulses from 400% to 500% full
power which are terminated by fast acting shutdown systems
within approximately 1 s (Chang et al., 2003). For comparison,
the pulses seen in this work had peaks of 160% full power or less
and with power ramp rates well below those exhibited in PHWR
LOCAs. It is reasonable to postulate that a similarly capable system deployed in the PT-SCWR would result in significantly less
fuel energy deposition during a large LOCA than in an equivalent
CANDU.
Acknowledgments
Funding to the Canada Gen-IV National Program was provided
by Natural Resources Canada through the office of Energy Research
and Development, Canadian Nuclear Laboratories (formerly Atomic
Energy of Canada Limited), and the Natural Sciences and Engineering Research Council of Canada (Project NNAPJ 422784-11).
89
The authors would also like to thank Professor Guy Marleau at
École Polytechnique de Montréal for his help implementing the
thermalhydraulic feedback model in DRAGON and DONJON.
References
Chang, J.J., Bo, W.R., Jong, Y.J., Ho, C.S. LOCA power pulse characteristics in a CANDU6 with CANFLEX-RU fuel. Proceedings of the Korean Nuclear Society Autumn
Meeting, Yongpyong, South Korea, 2003.
Hanna, B.N., 1998. CATHENA: A thermalhydraulic code for CANDU analysis. Nuclear
Eng. Des. 180, 113–131.
Harrison, G., Marleau, G., 2013. Simulation strategy for the evaluation of neutronic
properties of a Canadian SCWR fuel channel. Sci. Technol. Nuclear Install. 2013,
/>Hummel, D.W., Novog, D.R. Optimized channel inlet orifice sizing for the pressure
tube type supercritical water cooled reactor. The 19th Pacific Basin Nuclear
Conference (PBNC 2014), Vancouver, Canada, 2014.
Hummel, D.W., Langton, S.E., Ball, M.R., Novog, D.R., Buijs, A. Description and preliminary results of a two-dimensional lattice physics code benchmark for the
Canadian pressure tube supercritical water-cooled reactor (PT-SCWR), The 6th
International Symposium on Supercritical Water-Cooled Reactors (ISSCWR-6),
Shenzhen, China, 2013.
International Atomic Energy Agency, “WIMS Library Update Project,” 28 January
2008. [Online]. Available from (accessed
29.10.12).
Kozlowski, T., Downar, T.J., 2006. Pressurized water reactor MOX/UO2 core transient
benchmark—final report. Nuclear Energy Agency—Organization for Economic
Co-operation and Development, Paris, France (NEA/NSC/DOC(2006)20).
Leung, L.K.H., Yetisir, M., Diamond, W., Martin, D., Pencer, J., Hyland, B., Hamilton, H., Guzonas, D., Duffey, R, A next generation heavy water nuclear reactor
with supercritical water as coolant, International Conference on Future of Heavy
Water Reactors, Ottawa, Canada, 2011.
Marleau, G., Hébert, A., Roy, R., 2008. A User Guide for DRAGON 3.06. Institute of
Nuclear Engineering, École Polytechnique de Montréal, Montréal, Canada (Tech.
Re IGE-174 Rev. 8).
Pencer, J., Colton, A. Progression of the lattice physics concept for the Canadian supercritical water reactor. 34th Annual Conference of the Canadian Nuclear Society,
Toronto, Canada, 2013.
Pencer, J., Watts, D., Colton, A., Wang, X., Blomely, L., Anghel, V., Yue, S. Core neutronics for the Canadian SCWR conceptual design. The 6th International Symposium
on Supercritical Water-Cooled Reactors (ISSCWR-6), Shenzhen, China, 2013.
Pencer, J., McDonald, M., Anghel, V. Parameters for Transient response modelling
for the Canadian SCWR. The 19th Pacific Basin Nuclear Conference (PBNC 2014),
Vancouver, Canada, 2014.
Salaun, F., Hummel, D.W., Novog, D.R., The impact of the radial reflector on the 8group cell-averaged cross-sections for the SCWR 62-element lattice cell. 2014
Canada-China Conference on Advanced Reactor Development (CCCARD-2014),
Niagara Falls, Canada, 2014.
Salaun, F., Sharpe, J.R., Hummel, D.W., Buijs, A., Novog, D.R. Optimization of the
PTSCWR control blade sequence using PARCS and DAKOTA. The 7th International Symposium on Supercritical Water-Cooled Reactors (ISSCWR-7), Helsinki,
Finland, 2015.
Shan, J., Chen, W., Rhee, B.W., Leung, L.K.H., 2010. Coupled neutronics/thermalhydraulics analysis of CANDU-SCWR fuel channel. Ann. Nuclear Energy 37,
58–65.
Varin, E., Hébert, A., Roy, R., Koclas, J., 2005. A User Guide for DONJON Version 3.01.
Institute of Nuclear Engineering, École Polytechnique de Montréal, Montréal,
Canada (Tech. Re IGE-208 Rev. 4).
Wang, D.F., Wang, S. A CATHENA model of the Canadian SCWR concept for safety
Analysis. The 6th International Symposium on Supercritical Water-Cooled Reactors (ISSCWR-6), Shenzhen, China, 2013.
Wu, P., Shan, J., Gou, J., Zhang, B., Zhang, B., Wang, H. LOCA/LOECC analysis for
Canadian-SCWR. 7th International Symposium on Supercritical Water-Cooled
Reactors (ISSCWR-7), Helsinki, Finland, 2015.
Yang, P., Cao, L., Wu, H., Wang, C., 2011. Core design study on CANDU-SCWR with
3D neutronics/thermal-hydraulics coupling. Nuclear Eng. Des. 241, 4714–4719.
Yetisir, M., Gaudet, M., Rhodes, D. Development and integration of Canadian scwr
concept with counter-flow fuel assembly, The 6th International Symposium on
Supercritical Water-Cooled Reactors (ISSCWR-6), Shenzhen, China, 2013.