Investigating the potential of rock surface burial dating using IRPL and IRSL imaging
Bạn đang xem bản rút gọn của tài liệu. Xem và tải ngay bản đầy đủ của tài liệu tại đây (5.08 MB, 8 trang )
Radiation Measurements 155 (2022) 106783
Contents lists available at ScienceDirect
Radiation Measurements
journal homepage: www.elsevier.com/locate/radmeas
Investigating the potential of rock surface burial dating using IRPL and
IRSL imaging
E.L. Sellwood a, *, M. Kook a, M. Jain a
a
Department of Physics, Technical University of Denmark, DTU Risø Campus, 4000, Denmark
A R T I C L E I N F O
A B S T R A C T
Keywords:
Infrared-photoluminescence
Infrared-stimulated luminescence
Luminescence-depth profile
Rock surface burial dating
Equivalent dose
Techniques for spatially resolved measurements of infrared-stimulated luminescence (IRSL) and novel Infraredphotoluminescence (IRPL) emissions have recently been developed for applications of rock surface dating. Such
spatially resolved measurements overcome the need for separating out mineral fractions, speed-up sample
preparation and measurement times, and data can be quickly processed provide high-resolution luminescencedepth profiles. Here, we investigate the potential of using spatially resolved IRPL and IRSL measurements for
rock surface burial dating using two large (cm-scale) rock samples with controlled exposure and surface dose
histories. We use a SAR style measurement protocol, with a test-dose normalisation step to monitor sensitivity
changes, a preheat to remove unstable charges and a bleaching step to reset the IRPL signal. Through establishing
the response of IRPL and IRSL to dose, we are able to construct 2D maps of equivalent doses (Des) for each
sample. The results here indicate that spatially resolving IRSL and IRPL from large rock samples has the potential
to be used for rock surface burial dating and offers a means to investigate the spatial distribution of dose and
mineral-dependent sensitivity changes through cm-scale rock samples.
1. Introduction
The potential of dating rock surfaces using optically stimulated
luminescence (OSL) has gained ever increasing interest from geo
scientists over the past few decades. When a rock surface is exposed to
sunlight, trapped charge is optically reset at the surface of the rock. With
increasing exposure time, the luminescence is bleached to progressively
deeper depths from the surface (Polikreti et al., 2002; Sohbati et al.,
2011). The exposure duration is recorded as a bleaching front within the
rock and the exposure time can be determined by reconstructing the
luminescence-depth profile and fitting the profile with a calibrated age
model (Sohbati et al., 2012; Freiesleben et al., 2015). Should this
exposed rock surface then be buried, the total burial duration can be
determined through conventional OSL measurements from surface slices
of the buried rock (e.g. Theocaris et al., 1997; Vafiadou et al., 2007;
Sohbati et al., 2015). The reliability of such dose measurements for rock
surface burial dating is ascertained by reconstruction of the pre-burial
luminescence-depth profile and through model fitting of the data
(Freiesleben et al., 2015). Arguably one of the most advantageous as
pects of OSL rock surface burial dating (RSBD) compared to OSL sedi
ment dating is this easy validation of whether the rock surface was
sufficiently bleached prior to burial (al Khasawneh et al., 2019; Souza
et al., 2021).
Applications of OSL rock surface dating (RSD) often favour the
infrared-stimulated luminescence (IRSL) emission from feldspar because
of its almost ubiquitous availability and relatively higher sensitivity
compared to quartz (Simkins et al., 2016). However, the IRSL emission is
known to suffer from anomalous fading (Winte, 1977; Spooner, 1994;
Huntley and Lamothe, 2001), and although various methods have been
developed to overcome this (e.g. elevated temperature IRSL; Buylaert
et al., 2009; Li and Li, 2011; Thomsen et al., 2011), other problems arise
such as thermal transfer, poor bleaching, and changing sensitivity
(Duller, 1991; Liu et al., 2016; Yi et al., 2016; Colarossi et al., 2018).
Since the characterisation of the infrared-photoluminescence (IRPL)
emissions at 955 nm (IRPL955) and 880 nm (IRPL880) from feldspar
(Prasad et al., 2017; Kumar et al., 2020), there has been increasing hope
in being able to overcome some of the limitations of IRSL. Contrary to
IRSL, IRPL is a steady state emission reliant on the transition of electrons
between the excited and ground state within the principal trap (Prasad
et al., 2017; Kumar et al., 2018, 2020). IRPL is thus a non-destructive
emission with a higher sensitivity than IRSL and has a negligible
fading component even at room temperature (Kumar et al., 2018, 2020).
* Corresponding author. Department of Physics, Technical university of Denmark, Frederiksborgvej 399, 201, 4000, Roskilde, Denmark.
E-mail address: (E.L. Sellwood).
/>Received 1 December 2021; Received in revised form 21 April 2022; Accepted 2 May 2022
Available online 10 May 2022
1350-4487/© 2022 Published by Elsevier Ltd.
E.L. Sellwood et al.
Radiation Measurements 155 (2022) 106783
Measurement times can be set for longer durations to increase the
signal-to-noise ratio and thus it makes a more viable option for lumi
nescence imaging (Kumar et al., 2018).
To date, only a few applications have been attempted using IRPL for
sediment or rock surface dating. Sellwood et al. (2019, 2021) recognised
the suitability of using IRPL for spatially resolved measurements and
demonstrated how luminescence-depth profiles can be reconstructed
from naturally exposed rock slabs for rock surface exposure dating
(RSED). Duller et al. (2020) tested IRPL for determining equivalent
doses (Des) using IRPL images of single sand-sized grains. Kumar et al.
(2021) have described a suitable SAR-based protocol for determining
equivalent doses without the need for a fading correction using IRPL
emissions at 880 nm and 955 nm. These latter two authors used a
TL/OSL Risø reader adapted with an IRPL attachment (Kook et al.,
2018). These promising results, as well as the development of appro
priate measurement protocols through both imaging and reader-based
measurements, have opened possibilities of using spatially resolved
measurements of IRPL for rock surface burial dating (RSBD). Through
imaging, the whole luminescence-depth profile can be rapidly assessed,
and we can avoid the extensive sample preparation stages of coring and
slicing which are required in conventional measurements. We would
also be able to recreate a dose map, presenting the 2D dose distribution
of the whole rock sample, and investigate IRSL and IRPL characteristics
(e.g. sensitivity changes) from different locations across the sample.
Presented here is an exploration of the suitability of IRPL and IRSL
imaging for rock surface burial dating. We attempt to recover known
“burial” doses from two rock samples with controlled exposure and
surface dose histories using the Risø Luminescence Imager (Sellwood
et al., 2022). The IRSL and IRPL at 880 nm and 955 nm was imaged from
two granitic rock slabs, following a SAR-style protocol. Pixel-wise
analysis of the IRPL and IRSL dose response was used to construct 2D
distributions of IRPL and IRSL Des. We discuss sensitivity changes and
residual IRPL levels across different regions of the rock samples, and
their effect on the De estimates. This study has implications for future
applications where investigating and understanding dose distributions
in rocks is crucial for obtaining reliable De estimates, and for under
standing the response of different mineral constituents to dose, bleach
ing and heating. This method yielding high resolution
luminescence-depth profiles is especially powerful when model fitting
is deemed critical to ascertain the extent of bleaching prior to burial.
surface of G12 (200 Gy dose) and to the remaining exposed surface of
G14 (500 Gy) using a cobalt-60 photon beam (1 Gy/min dose rate, DTU
Health Tech department, Risø). The given doses were estimated to have
been attenuated by up to 8% at a depth of 20 mm from the surface of the
rocks (following dose attenuation factors presented in Fujita et al.,
2011). Two different doses were chosen to investigate the response of
IRPL and IRSL in rock to different doses, as well as to investigate
whether IRPL is suitable for RSBD applications with samples of different
ages. From the irradiated cores of G12 and G14, sections for imaging
were cut perpendicular to the now “buried” surface, labelled as G12B
(~22 × 43 × 1.5 mm; ‘B’ notation is used to indicate a “buried” sample)
and G14B (~30 × 39 × 1.8 mm) respectively. Optical images of the
three measured samples and a flow chart of the sample processing stages
can be found in the supplementary information (S1).
2.2. Measurements
Table 1 outlines the measurement sequence for G12B and G14B
using the Risø Luminescence Imager (Sellwood et al., 2022). A preheat at
200 ◦ C for 5 min was given in an oven. Bleaching was achieved over 24 h
ălne Solar simulator. Samples were irradiated in the cobalt-60
in a Ho
gamma cells at the High dose reference laboratory facilities at Risø.
Regeneration doses for G12B and G14B were 50, 250, 500, 1000 and
3000 Gy.
For G14E, the residual IRPL and IRSL was measured to determine the
extent of bleaching from the 327 day exposure. This was followed by
measurement of IRPL and IRSL in response to a 2 kGy saturation test
dose for normalisation of the signals. For all three sections, IRPL was
integrated over 3 s, and the whole IRSL decay curve was captured over
20 frames, each integrated over 10 s.
2.3. Analysis
All analyses was conducted in MATLAB using the Image Processing
toolbox (The Mathworks, 2004). All images from each sample dataset
were first registered onto one-another to allow pixel-wise analysis. The
area outside each sample was removed from the images. The residual
IRPL images (data from steps 5 and 11 in Table 1) were subtracted from
the respective Ln, Lx or Tx images for IRPL. For IRSL, the final frame was
subtracted from the first frame of the respective decay curve, after
checking that residual levels had indeed been reached in the decay
curves (decay curves are available in the supplementary information,
S2). Luminescence-depth profiles were reconstructed by taking the
mean and standard error of each column across the images, and plotted
as a function of depth from the surface.
The equivalent dose calculation and analysis followed a three stage
process. First, Des were calculated for each pixel of the IRPL and IRSL
images measured after the preheat stage. This was achieved by inter
polating the Ln/Tn of each pixel against its respective dose response
curve and reconstructing the De map. For all data sets, a double
2. Methodology
2.1. Samples
Two control samples were measured in this study: G14 and G12.
These two samples were initially collected as 8 cm Ø x 10 cm cores from
a fine crystalline granite from an unknown location in China. Prior to the
experiments here, these cores were heated to 700 ◦ C for 24 h to anneal
the luminescence, and were then given a saturation dose of 20 kGy using
a cobalt-60 source at the Department of Health Technology at DTU, Risø
campus.
For the experiments presented here, two further processing stages
were followed to simulate a surface exposure and subsequent burial
event. First, the edges of the two cores were wrapped in light-proof black
tape keeping the top surfaces of the cores exposed. The cores were
placed on a rotating table under four halogen lamps (Osram H7 70 W
bulbs; 102 mW/cm2) where the exposed top surfaces were bleached for
327 days. To explore the bleaching resulting from this exposure, a 2 cm
diameter core was drilled perpendicular to the bleached surface of core
G14. Using a 0.35 mm thick diamond wire saw, a section (18.4 × 18 ×
1.4 mm) was cut from the centre of this smaller core, perpendicular to
the bleached surface. IRPL and IRSL was measured from this section
(hereafter named G14E; ‘E’ indicating exposure sample) to reconstruct
the luminescence-depth profile resulting from the 327 day exposure.
At the second stage, a “burial” dose was administrated to the exposed
Table 1
Measurement sequence for IRPL and IRSL with the Risø Luminescence Imager.
2
Step
Treatment
Result
1
2
3
4
5
6
7
8
9
10
11
12
13
Natural or Regenerated IRPL
Preheat (200 ◦ C, 5 min)
Natural or Regenerated IRPL and IRSL
Bleach, 24 h
IRPL for residual level
Tx (100 Gy)
Measure IRPL
Preheat (200 ◦ C, 5 min)
IRPL and IRSL
Bleach, 24 h
IRPL for residual level
Regeneration dose
Repeat stages 1–12
Ln or Lx
LnPH or LxPH
LnBG or LxBG
Tx
TxPH
TxBG
E.L. Sellwood et al.
Radiation Measurements 155 (2022) 106783
saturating exponential regression model was chosen for fitting the pixelwise dose response curves, and pixels which had an R2 value < 0.9 for
the fit of the exponential model were rejected. The second analytical
stage followed the reasoning that it is only relevant to observe Des from
pixels where IRPL or IRSL was actually detected. To achieve this, a
threshold mask was applied to each De map to select the luminescing
regions of interest. To create the masks, eight sections, each 1 mm wide
were defined in the full De maps parallel to the “buried” surface, at
progressively deeper depths. The pixel-wise De values from these sec
tions were plotted against the corresponding pixels from the 1 kGy
regeneration dose (Lx) image. We observed a very broad (sometimes
bimodal) De distribution, with a peak present around the expected burial
dose (see supplementary information, S3). From here, an optimum
threshold value was defined based on Lx intensity to filter out pixels
with low intensity or no luminescence, in order to narrow down the
distributions. The final De maps were constructed based on the selected
pixels, after applying the binary masks to the IRSL De maps and to the
IRPL De maps from both before and after preheat. The third stage of
analysis aimed to investigate where at the rock surfaces we could find
the De values closest to the known doses. For this the mean and standard
error of the dose values were calculated from the 1 mm sections parallel
to the burial surface of the final De maps from the previously bleached
regions of the slabs. These values were plotted over depth from the
surface, with depth defined as the mid point of the 1 mm section.
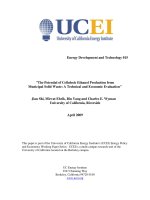
“burial” dose) from after the preheat stage. Panels a, b and c display the
Ln/Tn ratio maps for IRSL, IRPL880 and IRPL955 respectively. The white
regions in the IRSL map (Fig. 2a) indicate infinite values due to nonresponsive test dose regions (i.e. minerals not emitting IRSL or IRPL).
In Fig. 2a–c, it is possible to view a gradual increase in Ln/Tn from the
very surface of the rock to deeper depths for each signal. The
luminescence-depth profiles in Fig. 2d show the expected sigmoidal
form, with each of the profiles showing an expected raised plateau in Ln/
Tn ratio values near the surface due to the “burial” dose (note the IRSL
data corresponds to the left y-axis, and the IRPL data to the right y-axis).
The IRPL profiles (black circles and red triangles) show a slight valley
shape with a relatively higher ratio value at the very surface, which then
drop slightly before the profile progresses to the transition zone up to
saturation. This behaviour has been observed before in RSED profiles,
and is attributed to slight sensitivity change (e.g. see Sellwood et al.,
2019). On the contrary a gradual increase in IRSL Ln/Tn is observed in
the same region (from 0 to 1 mm depth) in the IRSL profile.
Fig. 2e presents the G12B IRSL De map (Gy). The transition in
apparent burial dose is observable from the surface to deeper depths
(blue to green coloured pixels). Both the IRPL880 and IRPL955 (after
preheat; Fig. 2f and g respectively) De maps show a very narrow band of
pixels presenting doses around our dose of interest (200 Gy). There is a
more irregular distribution in apparent doses, with no clear progression
in dose from the surface to the saturated region. The average doses from
the 1 mm sections are presented in Fig. 2h, which shows average doses
from IRPL from both before and after the preheat stages. The grey band
marks the expected 200 Gy (±10%) burial dose profile through the rock
(calculated from dose attenuation values from Fujita et al., 2011). The
average IRSL burial doses from 0 to 3.5 mm and from 5.5 to 7.5 mm all
lie within this expected region, with an increase in dose at 4.5 mm.
Beyond 7.5 mm (the IRSL bleaching depth seen in the G14E profile in
Fig. 1), the De values begin to increase, where the initial IRSL was above
residual level. For the IRPL880 and IRPL955 from before the preheat stage
(solid points in Fig. 2h), the surface doses from 0 to 3 mm over estimate
the known dose by up to 70% (IRPL880). The recovered IRPL Des from
0 to 3 mm from after the preheat stage (hollow points in Fig. 2h) also
over-estimate the known dose, but are slightly lower than those from
before the preheat, with the very surface IRPL955 De almost falling
within our expected range (see inset plot in Fig. 2h for a closer view of
the surface doses).
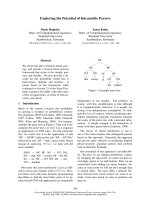
The results from G14B (“burial” dose of 500 Gy) are found in Fig. 3.
The IRSL and IRPL Ln/Tn maps (Fig. 3a–c) are similar to those from
G12B, with the surface regions clearly distinguishable from the satu
rated region by the lower Ln/Tn values (blue – green colour scheme).
The luminescence-depth profiles (Fig. 3d) show comparably higher
surface ratio values (IRPL Ln/Tn ~3.5) than in G12B (IRPL Ln/Tn ~2.2),
with the IRPL profiles again showing an increase in sensitivity at the
surface. The IRSL De (Gy) map (Fig. 3e) presents multiple regions at the
“burial” surface with pixels representing doses ranging from ~200 to
3. Results
Presented below are the results from G14E, G12B and G14B. The
ratio and De maps are presented in false colour with colour bars repre
senting Ln/Tn value or the De (Gy). The colour scaling has been adjusted
to focus on the surface regions of interest. Here, we focus on the De maps
from G12B and G14B after the preheat stage. The De maps from before
the preheat stage can be found in the supplementary information (S4).
3.1. Equivalent doses
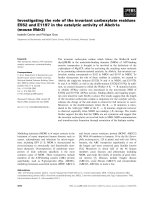
The Ln/Tn ratio maps and luminescence-depth profiles from the
bleached sample (G14E) are shown in Fig. 1. The IRSL ratio map
(Fig. 1a) presents a significant bleached region at the surface (left-hand
side of the ratio map). The bleached regions in the IRPL880 and IRPL955
maps are smaller than IRSL; nonetheless translation of these signals into
luminescence-depth profiles indicates that the 327 day exposure was
sufficient to bleach the IRPL to residual levels to a depth of ~2.5 mm
from the surface, and the IRSL down to ~8 mm from the surface. It is
within these bleached zones that investigation into the calculated De
values will be focused. The shapes of the IRPL luminescence-depth
profiles are slightly different; this is attributed to the differences in
bleachability of the two signals (greater for IRPL955; Kumar et al., 2020).
Fig. 2 presents the data from G12B (residual from exposure +
Fig. 1. a) IRSL Ln/Tn ratio map for G14E. The exposed surface is indicated on the left-hand side of the ratio map. b) IRPL880 Ln/Tn ratio map. c) IRPL955 ratio map.
d) Luminescence-depth profiles from the IRSL and IRPL ratio maps. The profile data here has been normalised to the saturation level.
3
E.L. Sellwood et al.
Radiation Measurements 155 (2022) 106783
Fig. 2. Results from G12B. a), b) and c) present the Ln/Tn ratio maps for IRSL, IRPL880 and IRPL955 after preheat respectively. The “burial” surface is on the left-hand side of
each ratio map. d) Luminescence-depth profiles from the Ln/Tn ratio maps. The IRPL profiles correspond to the right axis, and the IRSL to the left. e) IRSL De map after masking
to observe only the brightest luminescent regions. f) IRPL880 De map. g) IRPL955 De map. h) Average De values from 1 mm wide regions parallel to the “burial” surface from the
IRSL De map, and the IRPL De maps from before and after the preheat stage. The inset window shows a zoomed view of the data points from the surface two mm. Error bars show
standard error from the mean and the grey band is the expected dose-depth profile of the 200 Gy dose ( ± 20 Gy), based on attenuation factors from Fujita et al. (2011).
600 Gy. The calculated surface doses in the IRPL880 and IRPL955 De maps
(Fig. 3f and g, respectively) at first glance are slightly higher than the
IRSL (yellow pixels). Observing Fig. 3h, it is only within the surface 0 to
3 mm that the mean IRSL De values fall within the expected dose range
(500 Gy ± 10%; grey band on Fig. 3h), with a slight increase in dose
between 3 and 7 mm, before increasing towards higher doses. Across the
whole rock slab, there is a significant difference between the IRPL880 Des
from before (solid circles in Fig. 3h) and after preheat (hollow circles),
with an almost 50% overestimate of the known dose for the data after
the preheat stage. From 0 to 2 mm depth, the IRPL880 from before the
preheat stage, and the IRPL955 results from both before and after preheat
are within uncertainties consistent with the expected dose range.
before the preheat. The data is plotted over each regeneration cycle in
the measurement protocol. Cycle 1 corresponds to measurement of the
initial IRPL and IRSL after receiving the “burial” dose. The IRSL sensi
tivity at the very surface of G12B (red circles in Fig. 4a) varies within 5%
from unity for each regeneration cycle, except for cycle 5 (1 kGy
regeneration dose), where the sensitivity decreases by over 25%. This
decrease is consistent for data from all the depths across the slab. The
G12B IRPL880 and G12B IRPL955 data (Fig. 4b and c respectively) both
before and after preheat show the biggest sensitivity changes across
cycles in the surface 2 mm (up to ~20%). The deeper slices show lesser
variations of <10% across cycles; the biggest change seen at deeper
depths is observed between cycle 1 and cycle 2.
The IRSL test dose sensitivity of G14B is irregular with no systematic
changes in Tx/Tn ratio through the regeneration cycles (Fig. 4d). The
IRSL sensitivity shows a significant decrease across the slabs at cycles 2
and 6, but this behaviour is not seen in the IRPL data. Similarly to G12B,
the IRPL880 sensitivity changes after preheat in Fig. 4e indicating that
the sensitivity at the saturated region of the slabs (blue squares and pink
triangles n Fig. 4) is relatively stable with a few percent relative change
after an initial decrease of ~15% from unity after cycle 2. The surface
regions (red circles and orange stars) do not follow such systematic
behaviour. This irregular sensitivity fluctuation at the rocks surface is
also seen in the data from before the preheat stage (inset in Fig. 4d), as
well as in the IRPL955 data (Fig. 4f and inset). The IRPL955 Tx/Tn ratios
from the surface regions fluctuate between ±10% from unity. The
deepest regions of the slab do not show this, again presenting more
stable Tx/Tn ratios (within 5% of each other) after an initial decrease at
cycle 2.
3.2. Investigating IRPL sensitivity
We discuss below the suitability of our measurement protocol with
regards to the test dose and IRPL bleaching. We discuss the variations in
IRPL or IRSL test dose responses as well as the variations in background
(BG) levels for each signal for each sample from these regions. For this,
we followed similar analysis as for the De maps discussed above. The
same threshold masks as used for the De maps were applied to the Tx
(both before and after preheat) and bleached images after the regener
ation doses (from step 5 in Table 1) for each sample. We again, defined 1
mm sections parallel to the burial surface of the slabs, at 0–1 mm, 1–2
mm, 2–3 mm, 7–8 mm and 18–19 mm.
3.2.1. Test dose sensitivity
Fig. 4a–c presents the G12B Tx/Tn ratio values after preheat at
different depths across the samples from IRSL, IRPL880 and IRPL955,
respectively. The insets in Fig. 4 b and c show the IRPL Tx/Tn ratios from
4
E.L. Sellwood et al.
Radiation Measurements 155 (2022) 106783
Fig. 3. Results from G14B. a) IRSL Ln/Tn ratio map. The “burial” surface is on the left-hand side of the images. b) IRPL880 Ln/Tn map. c) IRPL955 Ln/Tn map. d)
Luminescence-depth profiles from the Ln/Tn maps. e) IRSL De (Gy) map. f) IRPL880 De map. g) IRPL955 De map from before the preheat stage. h) Mean and standard
error of Des taken from 1 mm wide regions parallel to the buried surface of the rock slab. The data from the IRPL both before and after preheat is shown. The grey
band represents the expected absorbed dose profile (500 ± 50 Gy). The inset window shows a zoomed view of the surface regions.
3.2.2. Influence of residual IRPL on test dose
Following from the observed sensitivity changes in Fig. 4, we address
the IRPL residual levels in the Lx data, following bleaching in the solar
simulator (steps 5 and 11 in Table 1). We investigate whether these
residual levels had an influence on the test dose response. Presented in
Fig. 5a are the G12B IRPL880 mean Tx values after preheat from each
SAR cycle, from the 1 mm sections defined in section 3.2.2, plotted
against the corresponding mean Lx residual levels (from step 5 in
Table 1). The data are fitted with a liner regression, and the dotted lines
represent 95% prediction intervals. The 1:1 line is shown for reference.
The measured IRPL880 Tx increases with increasing Lx residual (which
increases as a function of increasing regeneration dose; see supple
mentary information S5), with a slope of 1.47 (±0.38). The same trend is
seen in the IRPL955 data (Fig. 5b) from G12B which has a greater slope,
indicating a greater influence on the test dose from the non-bleached
component of the IRPL955 Lx data. This suggests that the Tx dose may
be building upon the remaining Lx residual level, which is not being
reset fully during the bleaching stage. The data points in Fig. 5 a and b
fall into three groups depending on their depth from the surface. In both
a and b, the IRPL Tx intensity and residuals for the surface of the slab
(red circles) are relatively lower than at deeper regions of the slab.
Slightly higher residuals and Tx values are seen in the data from 1 to 2
mm from the surface (yellow stars) and the data from deeper than 2 mm
and from the saturated regions of the slab cluster together with higher
residual vs. Tx values.
The data from G14B is shown in Fig. 5c and d. Here, the slopes of the
linear regressions are larger (and with larger uncertainties) than those
for G12B, and the spread of the data is larger – especially for the data
from 7 to 8 mm from the slab surface (blue squares). At this depth in the
slab there is an apparent high sensitivity to the test dose and a higher Lx
residual value in both the IRPL880 and IRPL955 compared to other depths
across the slab. The relatively lower Lx residual or Tx intensity seen in
the surface region (red circles in Fig. 5) of G12B is not observed in G14B.
The residual levels and Tx responses at all depths from the slab are
similar and all increase to similar degrees with increasing regeneration
dose (apart from at 7–8 mm). The general observation from the G12B
data are that the trend in the residual vs. Tx is similar for the surface and
the deeper regions; however, the absolute response to the test dose is
smaller for the surface regions compared to the deeper regions. In G14B,
the residual vs. Tx trend, as well as the absolute Tx intensities in the
surface and the deeper regions are indistinguishable. The two samples
(G12B and G14B) had the same test dose and the same regeneration
doses so the differences observed between the two samples in Fig. 5
could either be due to the different “burial” doses, or simply a coinci
dence. This needs be confirmed in future studies.
4. Discussion
Through imaging of the initial and regenerated IRSL and IRPL from
the large rock samples, we were able to clearly observe the bleaching
extent of the IRPL and IRSL, and validate the presence of the simulated
burial doses at the prior bleached surfaces. Pixel-wise analysis resulted
in the construction of 2D maps of Des. From these maps alone, it was
possible to observe the different responses of the IRSL and IRPL to dose
from different regions (e.g. Fig. 2e–g), at a resolution which is
unachievable with conventional measurements of individual rock slices.
We observe calculated IRSL Des in both G12B and G14B falling
within the expected dose ranges within the surface few mm of the
sample sections, where the IRSL was previously bleached to residual
levels. The calculated IRPL Des are less predictable, with De estimates
within our expected “burial” dose range found only at the very surface of
G14B. There is no clear trend on the effect of preheat on the ability to
5
E.L. Sellwood et al.
Radiation Measurements 155 (2022) 106783
Fig. 4. a) Sensitivity changes from G12B IRSL Tx/Tn data, from different depths across the rock slab. b)Tx/Tn ratio vales from G12B IRPL880 after the preheat stage.
The IRPL data from before the preheat is presented in the inset. c)G12B IRPL955 Tx/Tn ratio values after the preheat, with data from before the preheat presented in
the inset. d) G14B IRSL Tx/Tn data from different depths across the slab. e) G14B IRPL880 Tx/Tn ratio values. f) G14B IRPL955 sensitivity changes.
recover dose from the IRPL data; the before and after preheat De data are
generally consistent with the error margin for the surface region; the
only exception is the IRPL880 after preheat data for sample G14B
(Fig. 3h), which significantly overestimates that of all the other signals
(up to 50% overestimation from the expected 500 Gy, and a 30% in
crease in average De from before the preheat). It can be argued that the
trap population is affected by the preheat stage (i.e. recuperation or
thermal transfer is occurring during preheat) which is leading to the
final overestimates of De values. However, if this were to be the case, it is
surprising that we do not see a greater influence on this on the IRPL955
De estimates from before to after the preheat stages. It is suggested that
future studies include a zero regenerative dose as part of the SAR
sequence to investigate recuperation in the samples, and that preheat
plateau and thermal transfer tests also be conducted.
Investigating the sensitivity changes via test dose response from the
spatially resolved data offered an indication not only as to the suitability
of our measurement protocol, but also into the change in Ln/Lx ratio at
the surface of luminescence-depth profiles which is observed here
(Figs. 2d and 3d) and in other studies (e.g. Sellwood et al., 2019; Sell
wood et al., 2021). From taking the Tx/Tn ratio at different depths
across the samples, it was clear that the very surface of the samples
experience a sensitivity change in the IRPL different to that seen in the
deeper regions of the slabs which were in laboratory saturation. Both
samples show an initial decrease in surface sensitivity (0–1 mm depth)
with the first regeneration cycle before a general relative increase in
sensitivity. In contrast, the deeper regions of the slabs show an initial
decrease in sensitivity (in all signals) but then the Tx/Tn ratio stays more
steady with each subsequent cycle. Considering the main difference
between the surface the and deeper regions of the slab is the bleaching
history, the differences in sensitivity with measurement cycle between
the surface and deeper regions of the slabs arguably results from the
initial bleaching of this surface (profiles shown in Fig. 1 from G14E).
There is a much larger flux and likely a greater UV component at the
surface compared to the deeper regions (Ou et al., 2018). This bleaching
perhaps influenced the distribution of charge in the shallow or deep
traps at this location. However, it remains to be confirmed whether it is
this effect of high energy wavelengths at the surface during bleaching, a
change in trapping probability due to surface irradiation, or simply the
individual responses of the samples which could be the source of the
large sensitivity change observed at the surface. It is interesting to note
that IRSL shows the opposite trend, that the sensitivity change at the
surface is much smaller compared to the deeper regions. This indicates
that the sensitivity change is not necessarily linked to the distribution of
recombination centres at the surface, but instead with the trapping
centres.
The test dose response of G14B is more variable than that seen in
G12B. Previous research by Colarossi et al. (2018) and Liu et al. (2016)
has demonstrated a test dose size dependency on dose recovery. They
argue for the use of larger tests doses relative to the expected dose and
relative to the residual dose. Here, the test dose was 50% of the “burial”
dose for G12B, but only 20% of the “burial” dose for G14B. Testing the
effect of test dose size is suggested for future RSBD applications.
Following the observations from Fig. 5 where the Tx was building on the
residual IRPL following bleaching in the solar simulator, it is also sug
gested that the bleaching stage for residual IRPL information (stages 5
and 11 in Table 1) should also be changed. A longer bleaching duration
may be needed to endure full bleaching of the IRPL, especially following
the larger regeneration doses. There is larger scatter in the IRSL Tx/Tn
compared to the IRPL (Fig. 4). This scatter cannot be attributed to pixel
misalignment as that would have also affected the IRPL data. Possible
explanations could be: a) the presence of a thermal gradient in the rock
sample during preheating leading to irreproducible thermal eviction of
unstable charge with depth, or b) a larger change in the recombination
centre population during SAR cycles (Thomsen et al., 2011; Kars et al.,
6
E.L. Sellwood et al.
Radiation Measurements 155 (2022) 106783
Fig. 5. a) G12B IRPL880 mean Tx values from different regions of the slab plotted against the Lx residual values after step 5 in the measurement protocol. b) G12B
IRPL955 data. c) G14B IRPL880 correlation and d) G14B IRPL955 correlation. The solid lines show the results of the linear regression through each data set, and dotted
lines represent the 95% prediction intervals for new observations. The dashed line shows the 1:1 line for reference.
2012, 2014; Li et al., 2013).
the surface, or from changes in trapping probability due to irradiation at
the surface. Whilst we demonstrate how 2D De maps can be recon
structed from spatially resolved IRSL and IRPL, we suggest that future
work should focus on the understanding the effect of different preheats
and test dose sizes on the regenerated IRSL and especially IRPL. Thor
ough investigation into why we see different sensitivities in response to
dose at the surface of the rocks needs to be conducted if we want to
continue attempting rock surface burial dating of natural rock samples.
5. Conclusions
We apply here a SAR protocol for recovering a known “burial” dose
using spatially resolved IRSL and IRPL from two rock samples with
known exposure and burial dose histories. We calculated IRSL Des in the
prior bleached regions near the surface which were generally consistent
with the given doses (200 Gy and 500 Gy). The known doses were
recovered from the very surface of G14B (500 Gy) from both IRPL880 and
IRPL955, but the IRPL Des from G12B over estimated the known 200 Gy
dose. The preliminary results discussed here argue that IRPL and IRSL
burial doses can be recovered from spatially resolved measurements.
Test dose sensitivity was seen to increase in the IRPL signals in the
surface regions of the samples; the sensitivity changes were less prom
inent in the deeper (>2 mm) regions of the samples. This suggests that
IRPL sensitivity changes may be related to the initial bleaching period
(resetting prior to burial) as such bleaching is most effective closest to
Declaration of competing interest
The authors declare that they have no known competing financial
interests or personal relationships that could have appeared to influence
the work reported in this paper.
Acknowledgements
The authors wish to thank Trine Freiesleben for providing the
7
E.L. Sellwood et al.
Radiation Measurements 155 (2022) 106783
samples used here. We are also grateful to Mark Bailey, Arne Miller and
Torben Esmann Mølholt, our colleagues at the at the Risø High Dose Rate
Reference Laboratory who provided access to the large irradiation
facilities.
Li, B., Jacobs, Z., Roberts, R., Li, S., 2013. Extending the age limit of luminescence dating
using the dose-dependent sensitivity of MET-pIRIR signals from K-feldspar. Quat.
Geochronol. 17, 55–67. />Li, B., Li, S.H., 2011. Luminescence dating of K-feldspar from sediments: a protocol
without anomalous fading correction. Quat. Geochronol. 6, 468–479. https://doi.
org/10.1016/j.quageo.2011.05.001.
Liu, J., Murray, A., Sohbati, R., Jain, M., 2016. The effect of test dose and first IR
stimulation temperature on post-IR IRSL measurements of rock slices.
Geochronometria 43, 179–187. />Ou, X.J., Roberts, H.M., Duller, G.A.T., Gunn, M.D., Perkins, W.T., 2018. Attenuation of
light in different rock types and implications for rock surface luminescence dating.
Radiat. Meas. />Polikreti, K., Michael, C., Maniatis, Y., 2002. Authenticating marble sculptures with
thermoluminescence. Anc. TL 20, 11–18.
Prasad, K., Poolton, N.R.J., Kook, M., Jain, M., 2017. Optical dating in a new light: a
direct, non-destructive probe of trapped electrons. Sci. Rep. 7, 12097 https://doi.
org/10.1038/s41598-017-10174-8.
Sellwood, E., Guralnik, B., Kook, M., Prasad, A., Sohbati, R., Hippe, K., Wallinga, J.,
Jain, M., 2019. Optical bleaching front in bedrock revealed by spatially-resolved
infrared photoluminescence. Sci. Rep. 9, 1–12. />Sellwood, E.L., Kook, M., Jain, M., 2022. A 2D imaging system for mapping
luminescence-depth profiles for rock surface dating. Radiat. Meas. 150, 106697
/>Sellwood, E.L., Kook, M., Jain, M., 2021. Rapid in situ assessment of luminescencebleaching depths for deriving burial and exposure chronologies of rock surfaces.
Quat. Geochronol. 67, 101227 />Simkins, L.M., DeWitt, R., Simms, A.R., Briggs, S., Shapiro, R.S., 2016. Investigation of
optically stimulated luminescence behavior of quartz from crystalline rock surfaces:
a look forward. Quat. Geochronol. />Sohbati, R., Jain, M., Murray, A., 2012. Surface exposure dating of non-terrestrial bodies
using optically stimulated luminescence: a new method. Icarus 221, 160–166.
/>Sohbati, R., Murray, A., Jain, M., Buylaert, J.P., Thomsen, K., 2011. Investigating the
resetting of OSL signals in rock surfaces. Geochronometria 38, 249–258. https://doi.
org/10.2478/s13386-011-0029-2.
Sohbati, R., Murray, A.S., Porat, N., Jain, M., Avner, U., 2015. Age of a prehistoric
“Rodedian” cult site constrained by sediment and rock surface luminescence dating
techniques. Quat. Geochronol. 30, 90–99. />quageo.2015.09.002.
Souza, P.E., Sohbati, R., Murray, A.S., Clemmensen, L.B., Kroon, A., Nielsen, L., 2021.
Optical dating of cobble surfaces determines the chronology of Holocene beach
ridges in Greenland. Boreas 50, 606–618. />Spooner, N.A., 1994. The anomalous fading of infrared-stimulated luminescence from
feldspars. Radiat. Meas. 23, 625–632. />90111-2.
The Mathworks, 2004. Image Processing Toolbox, MATLAB Version R2018a.
Theocaris, P.S.S., Liritzis, I., Galloway, R.B.B., 1997. Dating of two hellenic pyramids by
a novel application of thermoluminescence. Can. J. Earth Sci. 24, 399–405. https://
doi.org/10.1006/JASC.1996.0124.
Thomsen, K., Murray, A., Jain, M., 2011. Stability of IRSL signals from sedimentary Kfeldspar samples. Geochronometria 38, 1–13. />Vafiadou, A., Murray, A.S., Liritzis, I., 2007. Optically stimulated luminescence (OSL)
dating investigations of rock and underlying soil from three case studies. J. Archaeol.
Sci. 34, 1659–1669. />Winte, A.G., 1977. Detailed study of a thermoluminescent mineral exhibiting anomalous
fading. J. Lumin. 15, 385–393. />Yi, S., Buylaert, J.P., Murray, A.S., Lu, H., Thiel, C., Zeng, L., 2016. A detailed post-IR
IRSL dating study of the Niuyangzigou loess site in northeastern China. Boreas 45,
644–657. />
Appendix A. Supplementary data
Supplementary data to this article can be found online at https://doi.
org/10.1016/j.radmeas.2022.106783.
References
al Khasawneh, S., Murray, A., Thomsen, K., AbuAzizeh, W., Tarawneh, M., 2019. Dating
a near eastern desert hunting trap (kite) using rock surface luminescence dating.
Archaeol.Anthropol.Sci. 11, 2109–2119. />Buylaert, J.P., Murray, A.S., Thomsen, K.J., Jain, M., 2009. Testing the potential of an
elevated temperature IRSL signal from K-feldspar. Radiat. Meas. 44, 560–565.
/>Colarossi, D., Duller, G.A.T., Roberts, H.M., 2018. Exploring the behaviour of
luminescence signals from feldspars: implications for the single aliquot regenerative
dose protocol. Radiat. Meas. 109, 35–44. />radmeas.2017.07.005.
Duller, G.A.T., 1991. Equivalent dose determination using single aliquots. Int. J. Radiat.
Appl. Instrumentation 18, 371–378. />Duller, G.A.T., Gunn, M., Roberts, H.M., 2020. Single grain infrared photoluminescence
(IRPL) measurements of feldspars for dating. Radiat. Meas. 133, 106313 https://doi.
org/10.1016/j.radmeas.2020.106313.
Freiesleben, T., Sohbati, R., Murray, A., Jain, M., Al Khasawneh, S., Hvidt, S.,
Jakobsen, B., 2015. Mathematical model quantifies multiple daylight exposure and
burial events for rock surfaces using luminescence dating. Radiat. Meas. 81, 16–22.
/>Fujita, H., Jain, M., Murray, A.S., 2011. Retrospective dosimetry using Japanese brick
quartz: a way forward despite an unstable fast decaying OSL signal. Radiat. Meas.
46, 565–572. />Huntley, D.J., Lamothe, M., 2001. Ubiquity of anomalous fading in K-feldspars and the
measurement and correction for it in optical dating. Can. J. Earth Sci. 38,
1093–1106. />Kars, R.H., Busschers, F.S., Wallinga, J., 2012. Validating post IR-IRSL dating on Kfeldspars through comparison with quartz OSL ages. Quat. Geochronol. 12, 74–86.
/>Kars, R.H., Reimann, T., Ankjærgaard, C., Wallinga, J., 2014. Bleaching of the post-IR
IRSL signal: new insights for feldspar luminescence dating. Boreas 43, 780–791.
/>Kook, M., Kumar, R., Murray, A.S., Thomsen, K.J., Jain, M., 2018. Instrumentation for
the non-destructive optical measurement of trapped electrons in feldspar. Radiat.
Meas. />Kumar, R., Kook, M., Jain, M., 2021. Sediment dating using infrared photoluminescence.
Quat. Geochronol. 62, 101147 />Kumar, R., Kook, M., Jain, M., 2020. Understanding the metastable states in K-Na
aluminosilicates using novel site-selective excitation-emission spectroscopy. J. Phys.
D Appl. Phys. 53 />Kumar, R., Kook, M., Murray, A.S., Jain, M., 2018. Towards direct measurement of
electrons in metastable states in K-feldspar: do infrared-photoluminescence and
radioluminescence probe the same trap? Radiat. Meas. />radmeas.2018.06.018.
8