Anomalous fading in thermoluminescence signal of ten different K-feldspar samples and correlation to structural state characteristics
Bạn đang xem bản rút gọn của tài liệu. Xem và tải ngay bản đầy đủ của tài liệu tại đây (844.43 KB, 7 trang )
Radiation Measurements 155 (2022) 106789
Contents lists available at ScienceDirect
Radiation Measurements
journal homepage: www.elsevier.com/locate/radmeas
Anomalous fading in thermoluminescence signal of ten different K-feldspar
samples and correlation to structural state characteristics
G.S. Polymeris a, *, V. Giannoulatou b, K.M. Paraskevopoulos c, V. Pagonis d, G. Kitis b
a
Institute of Nanosciences and Nanotechnology, NCSR “Demokritos”, Ag. Paraskevi, 15310, Athens, Greece
Nuclear Physics Laboratory, Aristotle University of Thessaloniki, 54124, Thessaloniki, Greece
c
Solid State Section, Physics Department, Aristotle University of Thessaloniki, 54124, Thessaloniki, Greece
d
McDaniel College, Physics Department, Westminster, MD, 21157, USA
b
A R T I C L E I N F O
A B S T R A C T
Keywords:
Thermoluminescence
Anomalous fading
Structural characteristics
K-feldspars
The present work reports an extended study of anomalous fading (AF) in the TL signal of ten different pure Kfeldspar samples from North Greece. A fading protocol was applied, including a standard series of TL mea
surements undertaken following a variety of storage times after irradiation, in order to plot the luminescence
output as a function of storage time. Anomalous fading was found to be ubiquitous for the TL signal of all
feldspars. The remnant signals are defined as the ratio of the TL signal remaining after storage time t, over the
corresponding signal promptly measured. Two different fading rates were calculated, namely the value of gfactor which describes the luminescence signal loss in terms of percentage per decade of time as well as the g50factor which describes the fading rate when the signal has been reduced to 50% of the prompt value measured
after irradiation due to AF. Both aforementioned fading factors were calculated over the entire TL glow curves in
step intervals of 10 ◦ C and were eventually plotted versus glow curve temperature. The analysis indicated that
fading factors yield maximum values within the temperature range between 200 and 350 ◦ C, with a tendency to
decrease with increasing temperature along the rest glow curve. As the 10 K-feldspar samples belong to three
different groups (microclines, sanidines and orthoclases), possible correlation is studied between the fading
factors and specific structural parameters of alkali feldspars, such as the probability of Al-cation to occupy
specific sites in the forming tetrahedra and the volume of the unit cell.
1. Introduction
Athermal or anomalous fading (hereafter AF) of thermolumines
cence (TL) signals is the term adopted for the rapid decay of lumines
cence, instead of the stability expected for it according to standard
luminescence kinetic models (Wintle, 1973; Chen and McKeever, 1997).
Previous works have been careful to differentiate between processes
which can be accelerated by heating and those which operate inde
pendent of the temperature of storage (Sanderson, 1988; Spooner,
1994). It stands as experimental drawback against effectively using
feldspars as a luminescence chronometer. In many cases, AF is also
monitored for the case of either optically or infrared stimulated lumi
nescence (OSL and IRSL, respectively). Despite the detrimental effect of
AF to the final ages, there have been proposed various attempts to
circumvent it. These attempts include (a) correcting the ages by calcu
lation of an appropriate factor (Huntley and Lamothe, 2001); (b)
adopting experimental protocols with two or multi steps of IRSL, where
the second or the last measurement takes place at elevated temperature
(Thomsen et al., 2008; Buylaert et al., 2009); (c) isolating the most stable
signal using the appropriate mathematical models and deconvolution
(Pagonis et al., 2021); and (d) measuring alternative luminescence sig
nals, such as Thermally Assisted Optically Stimulated Luminescence (TA
– OSL, Polymeris et al., 2015) and Infrared Photoluminescence (IRPL,
Prasad et al., 2017).
During the last decade, a collection of various K-feldspar samples
from igneous rocks of Northern Greece has stimulated basic research on
the luminescence properties of K-feldspars as an attractive topic for our
research group. These samples were repeatedly studied towards an effort
to correlate luminescence features such as TL/OSL/IRSL intensity with
structural state characteristics (Polymeris et al., 2013, 2017; Pagonis
et al., 2015, 2020, 2021; Sfampa et al., 2015, 2019; Kitis et al., 2016;
Șahiner et al., 2017; Angeli et al., 2020). All previous found good
* Corresponding author.
E-mail address: (G.S. Polymeris).
/>Received 23 November 2021; Received in revised form 10 May 2022; Accepted 14 May 2022
Available online 19 May 2022
1350-4487/© 2022 Elsevier Ltd. All rights reserved.
G.S. Polymeris et al.
Radiation Measurements 155 (2022) 106789
correlation between individual K-feldspar structure and various stimu
lated luminescence features, mostly for TL and IRSL signals. Besides
intensities, bleaching and model dependent parameters that describe the
IRSL phenomenon in feldspars were also correlated. It is critical to note
that no previous study on AF has ever been reported so far in the liter
ature for these specific museum samples of K-feldspars.
In contrast, AF in TL, OSL, IRSL and TA - OSL signals has been
meticulously studied for the case of Durango apatite; a reference ma
terial as it yields extremely intense athermal fading effect. AF in
Durango apatite was studied as a function of (a) grain size in both
micrometer and nanometer ranges, (b) annealing temperature, (c) predose and irradiation temperature, (d) heating rate as well as (e) the
occupancy of the recombination sites. For a review in the related liter
ature, readers could refer to Polymeris et al. (2018 and references
therein). In this latter study, AF was studied throughout the entire
temperature range of the TL glow curve differentially, namely in in
tervals of 10 ◦ C; through this aforementioned analysis of the AF, these
authors have pointed out that the effect in nano-sized Durango apatite
yields minor dependence on the TL glow curve temperature. The aim of
the present study is twofold, including (a) an attempt to study AF within
the entire temperature range of the TL signal of these museum samples
of K-feldspars performing an analysis similar to that reported by Poly
meris et al. (2018), along with (b) possible correlation of the effect to the
structure of the samples.
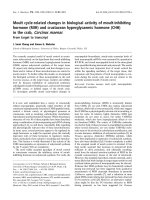
respectively. Fig. 1 presents the dependence of the unit cell volume of
these samples on the probability Σt1.
2.2. Apparatus
The TL measurements for these feldspar samples were carried out
using a Risø TL/OSL reader (model TL/OSL-DA-20), equipped with
90
Sr/90Y beta particle source, delivering a nominal dose rate of 0.105
Gy/s (Bøtter-Jensen et al., 2000). A 9635QA photomultiplier tube with a
combination of Pilkington HA-3 heat absorbing and a Corning blue filter
was used for light detection. All measurements were performed with low
constant heating rates of 1 K/s in order to avoid significant temperature
lag (Kitis et al., 2015), and the samples were heated up to the maximum
temperature of 500 ◦ C. The grain size of the samples was 90–150 μm.
Aliquots with mass of 7.5 mg each, were prepared by mounting the
material on stainless-steel disks of 1 cm2 area. Prior TL measurements,
all feldspar samples were annealed at 900 ◦ C for 1 h.
2.3. Protocol
A typical protocol to study fading includes a standard series of TL
measurements undertaken following a variety of storage times after
irradiation, in order to plot the luminescence output as a function of
storage or fading time (Visocekas et al., 1994; Duller, 1997; Polymeris
et al., 2006, 2014). The protocol that was applied in the framework of
the present study is the same as used in our previous related studies; its
various steps are presented in Table 1.
2. Experimental
2.1. Materials
3. Method of analysis
In very general terms, the basic structure of an alkali feldspar consists
of a three dimensional array of corner-sharing AlO4 and SiO4 tetrahedra.
Three out of the four T-cation sites are occupied by a Si-cation, and the
fourth by an Al-cation. The structure of sanidines contains two distinct
Si/Al tetrahedral sites, denoted by T1 and T2, being monoclinic. By
contrast, microclines are the low temperature form and the corre
sponding unit cell is triclinic, with highly ordered distribution of Al/Si
cations among four distinguishable tetrahedral sites, denoted by T1(o),
T2(o), T1(m) and T2(m). Orthoclases used to be considered an interme
diate form between sanidines and microclines. Nevertheless, while most
microcline samples show fine-scale tartan twinning, the group including
orthoclases is now known to have a complex “tweed” texture revealed by
high resolution electron microscopy. The use of both FTIR and powder
XRD analysis (Ribbe, 1983; Kroll and Ribbe, 1987; Theodosoglou et al.,
2010; Polymeris et al., 2013) has enabled not only the identification of
the samples, but also the calculation of basic structural state charac
teristics, such as the unit cell volume as well as the probability of the
Al-cation to occupy the T1(o) and T1(m) sites Σt1 = t1m + t10. There is a
straightforward, monotonic increase of both aforementioned parameters
as one moves from sanidines to orthoclases and eventually to
microclines.
The present study was conducted to a group consisting of ten natu
rally occurring pure K-feldspar samples from igneous rocks of Northern
Greece; these are the same samples that have been previously studied by
Polymeris et al. (2013, 2017), Pagonis et al. (2015, 2020, 2021), Sfampa
et al. (2015, 2019), Kitis et al. (2016), Șahiner et al. (2017) and Angeli
et al. (2020). Both handling and chemical pretreatments of these sam
ples were previously described by Theodosoglou et al. (2010); thus these
will not be repeated here. These K-feldspars include samples from all
three groups, namely microclines, sanidines and orthoclases. Samples
from these three groups are almost identical in their physical properties,
and it is impossible to distinguish between them without either X-ray
diffraction (XRD) or Fourier Transform Infrared (FTIR) spectroscopy
analysis. The only difference is their crystal structure. Classification of
the K-feldspar samples into orthoclase, microcline and sanidine is made
by Theodosoglou et al. (2010) using both FTIR and XRD analysis and the
identification of specific vibrational modes and diffraction peaks
In the present study, the TL signals that were measured in the
framework of the current AF experiment correspond to the signals
remaining after various times which have elapsed since the end of
irradiation. Taking measurements of the corresponding TL signal
promptly after an irradiation in the laboratory is crucial. Nevertheless,
during step 2, the exact zero storage time is not zero; there is always a
minimum time elapsed between the end of the irradiation and the
following TL measurement. In the case of the Risø TL/OSL Reader that
was used, this time interval is configured to be 120s. A good approxi
mation to the effective fading time is half of the irradiation time (ac
cording to Auclair et al., 2003) plus the delay between end of irradiation
and start of the measurement for calculating the g-value. Thus, storage
Fig. 1. The dependence of the unit cell volume on the probability of the Alcation to occupy the T1 sites Σt1 = t1m + t10.
2
G.S. Polymeris et al.
Radiation Measurements 155 (2022) 106789
In each case, the goodness of fit was tested using the Figure Of Merit (F.
O.M.) of Balian and Eddy (1977). For the direct fitting parameters (g and
ρ’), the corresponding error for each value was calculated as the error in
the fitting analysis; the corresponding F.O.M. value represents the error
percentage. For each value of g50, standard error propagation analysis
was applied.
Table 1
The protocol for the AF measurements of the present study.
Protocol’s
Steps
Protocol’s Actions
1
2
3
4
5
6
Test Dose (50 Gy).
TL measurement to obtain the initial sensitivity TL0.
Test Dose (50 Gy)
Storage in dark for duration t1 = 6 h
Residual TL1 (R-TL1 hereafter) measurement
Repeat steps 3–5 for 12 different storage times ti, ranging up to 2
months
4. Results and discussion
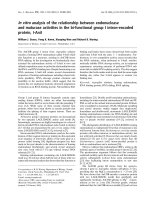
AF stands as an effect that is present in all K-feldspar samples of the
present study. Fig. 2a and b presents a group of residual TL glow curves
for a microcline and a sanidine K-feldspar sample respectively, and
selected storage times, with laboratory codes KST4 (microcline) and
SAM2 (sanidine). It is quite interesting to note that, despite the fact that
all TL glow curves where measured up to 500 ◦ C, measurable and intense
signal is measured up to almost 400–450 ◦ C (test dose 50 Gy, heating
rate 1 K/s). These two examples of glow curves are presented as typical
for all other samples, since the behavior is identical in terms of both
glow curve shapes and fading behavior. According to both Fig. 2a and b
as well as to Polymeris et al. (2013), some among these samples yield a
TL peak at temperatures lower than 100 ◦ C (heating rate 1 K/s), corre
sponding to one shallow trap; the signal loss monitored for this specific
TL peak is clearly seen due to the lifetime of the specific charge at room
temperature. However, this peak is neither always prominent due to
overlapping with the rest TL signal, nor interesting in the present study,
as it yields thermal fading. At this point it is quite important to note that
the TL glow curves of all K-feldspar samples do not yield other promi
nent TL glow peaks, besides this aforementioned shallow one. Never
theless, signal loss takes place throughout the temperature range of the
quite complex TL glow curves, namely within the temperature region
between 150 and 450 ◦ C, where a continuum of TL intensities is yielded.
Within this region, fading gets contributions from both thermal and
anomalous signal loss. For this reason, the analysis that was suggested
for the present study will help in identifying the temperature range at
which the signal loss is seen simply due to the lifetime of charge at room
temperature. As the expressions applied in the present work are derived
assuming that the AF is attributed to quantum mechanical tunneling
effect, when athermal or anomalous fading becomes dominant, g and g50
values are expected to yield stable values within errors.
The effect of AF is quite fast for initial short storage times, while as
this fading time gets more prolonged, fading rate decreases rapidly. As
Fig. 2 reveal, fading does not influence all electron traps responsible for
the TL signal in the same manner. AF is much stronger in the low tem
perature part of the TL glow curve, where both thermal and athermal
fading take place, while the effect of fading decreases gradually as the
temperature increases along the TL glow-curve. Moreover, in all Kfeldspars there is a part of the high-temperature TL glow curve which
remains unaffected; for temperatures over 400 ◦ C the TL glow curves of
all storage times coincide. In other words, there is a significant part of
the TL signal that is left unfaded. This behavior is characteristic of a
localized transition and has been reported recently by Pagonis et al.
(2013, 2014). It is the well known wave-front behavior, as it was named
by Sfampa et al. (2015) in their bleaching experiments using IRSL. The
temperature range of this unaffected part of the TL glow curve increases
for the orthoclase group of K-feldspars, while for the other two groups it
remains about the same. Similar features were also reported by Sfampa
et al. (2015) for the part of the high-temperature TL glow curve which
remains unaffected by the IRSL bleaching, no matter how long the
stimulation time be. The corresponding fading behavior in apatites was
slightly different, as AF occurs throughout the temperature range within
RT and 500 ◦ C (Polymeris et al., 2014).
Fig. 2c and d present the corresponding results of the interval AF
analysis on the AF of the same two K-feldspar samples. This analysis
consists of calculating both g and g50 fading factors within intervals over
10 ◦ C within the entire TL glow curve and plotting them versus TL glow
curve temperature, covering the temperature region between 130 and
time also includes part of the irradiation time. As test dose was 50 Gy,
irradiation time was roughly 500s. Thus, 250s were added to the storage
time. Consequently, all corresponding durations are added to the storage
time sequence of step 2 (Aitken, 1985; Polymeris et al., 2018).
For each storage time, a background measurement was performed,
namely measurement to look at the black body radiation, and during the
analysis was subtracted from the corresponding measurement. Remnant
TL signals are defined as the ratio of the TL signal remaining after
storage time t, over the corresponding prompt TL signal measured after
the end of the irradiation. The expression that finally describes the
dependence of this aforementioned ratio is as follows (Aitken, 1985;
Chen and McKeever, 1997; Polymeris et al., 2014):
TLi
g
t
⋅log10 ,
=1 −
100
t0
TL0
(1)
where TL0 stands as the prompt measured luminescence signal at initial
time, t0 after the end of irradiation and TLi the signal after storage time ti.
Eq. (1) gives directly the value of g-factor which describes the lumi
nescence signal loss in terms of percentage per decade of time as a fitting
parameter.
Besides the percentage TL signal loss per decade of time, the fading
parameter g50 was also calculated. It represents the g-factor when the TL
signal has been reduced to 50% of the prompt value measured after
irradiation due to AF. The mathematical formulation of the g50-factor
was described by Pagonis and Kitis (2015), based on the model that was
previously suggested by Jain et al. (2012). According to these two ci
tations, the final expression that was used is the following (Polymeris
et al., 2018):
])
(
TLi
′ [
= exp − 12.167 ⋅ ρ ⋅ log10 (s⋅t)3
TL0
(2)
where ρ′ (cm− 3) is a dimensionless parameter denoting the density of
recombination centers and s (s− 1) represents the frequency factor
characterizing the tunneling process taking place from the ground state
of the system (Pagonis et al., 2013; Pagonis and Kitis, 2015). However,
regarding the parameters in Eq. (2), the analytical equation does not
result in a direct calculation of the AF factor as in the case of Eq. (1). So,
Pagonis and Kitis (2015); Kitis et al. (2015) attempted to correlate the
dimensionless parameters ρ′ of Eq. (2) with the g-factor of Eq. (1), by
suggesting the following expression:
g50 = 2.7035⋅ρ′ 1 3
(3)
/
In the framework of the present study, fading rate values will be
evaluated via the calculation of g50 and g-factors. It is worth mentioning
that all the expressions applied in the present work are derived assuming
that the AF is attributed to quantum mechanical tunneling effect
(Wintle, 1977; Jain et al., 2012). Both values of g50 and g-parameters
were calculated for intervals of 10 ◦ C throughout the entire TL glow
curve region over all potassium feldspar samples by fitting the experi
mental data using Eq. (1) and by treating it as the unique fitting
parameter; this analysis will be termed interval AF analysis. Special
focus has been devoted to the temperature region where the naturally
irradiated signal is measured, namely roughly between 200 and 400 ◦ C.
3
G.S. Polymeris et al.
Radiation Measurements 155 (2022) 106789
Fig. 2. Plots a and b present the TL glow curves that were measured following various storage times and subsequent TL measurement for two different K-feldspar
samples, namely a sanidine (SAM2) and a microcline (KST4). Plots c and d present the corresponding g and g50 fading factors plotted versus TL glow curve
temperature.
500 ◦ C, for the reasons that were just previously described. It must be
noticed that, according to this figure, the g50-factor differs from the gfactor, since these two parameters were calculated using different
models. However, as it is also demonstrated by Fig. 2a and b, in most
cases the g50-factor values and the g-factor values do not differ sub
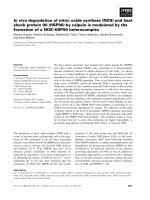
stantially. Fig. 3 presents, for the same fading data set (corresponding to
representative temperature interval between 290 and 300 ◦ C for the
sample MRK4), examples of fitting using both equation (1) for calcu
lating the g value (Fig. 3a) as well as equation (2) for the calculation of
the g50 value (Fig. 3b). Experimentally obtained data are presented as
dots while the best-fit as line. Fig. 3c and d present the fitting residuals of
plots 3a and 3b respectively. Both models approximate the data well. As
the residuals indicate, equation (1) indicates better results for longer
fading times while the model of Pagonis and Kitis (2015) (equation (2))
approximates better the data at short storage times.
Another prominent feature of Fig. 2 deals with the values of either
fading parameter throughout the entire TL glow curve region; none is
stable over the temperature region of the present study. Such depen
dence of the fading rate on the TL glow curve temperature is both
obvious as well as prevalent for temperatures over 400 ◦ C, where the
values of both factors decrease substantially; nevertheless it exists even
for temperatures below 400 ◦ C. This is another hint towards a temper
ature dependent behavior of the AF in K-feldspars samples as well, be
sides apatites (Polymeris et al., 2018). This thermal dependent behavior
is also demonstrated by Fig. 4, presenting the dependence of the
remnant TL after 30 days storage time (namely the ratio
TL30 days
TL0 )
over the
entire TL glow curve temperature range. According to Bowman (1988)
this ratio should give the anomalous fading factor as a function of the
glow-curve temperature. According to these plots, AF rate presents wide
Fig. 3. Examples of remnant TL fitted using both models, namely equation (1) (plot a) and equation (2) (plot b). Plots c and d present the corresponding
fitting residuals.
4
G.S. Polymeris et al.
Radiation Measurements 155 (2022) 106789
Fig. 6. The behavior of the parameter ρ′ versus the TL glow curve temperature
for a selection of samples that include one microcline, one sanidine and one
orthoclase. Inset presents a detail of the main plot for TL glow curve temper
atures beyond 200 ◦ C.
Fig. 4. Remnant TL following storage of 1 month, plotted versus the TL glow
curve temperature.
plateau regions, located within the temperature part below 250 ◦ C.
Nevertheless, one can argue that these plateaus are slopping towards
lower temperatures than being flat, showing a break in slope below
250 ◦ C. In any case, the temperature range of this plateau strongly de
pends on the type of K-feldspar, being wider for the case of sanidines.
Moreover, thermal dependence of AF rate is much different in apatites,
where more than one plateau region could be easily identified within the
temperature range up to 500 ◦ C (Polymeris et al., 2014), while the last
plateau that corresponds to deep traps with delocalization temperatures
over 450 ◦ C lying very close to the value of unity (Polymeris et al.,
2014).
Nevertheless, the most interesting feature that Fig. 4 yields, deals
with the dependence of the level of the remnant TL following storage for
1 month on the type of K-feldspars. Microclines indicate much more
intense residual TL levels than the other two types of K-feldspars. At the
same time, fading is more intense in sanidines, resulting in the lowest
level of the signal acquired. The values of the remnant TL after 30 days
show clear tendency to decrease with decreasing unit cell volume.
Nevertheless, a clear discrimination among the remnant TL values of
different groups is not so prominent due to very close spacing.
In order to study further the dependence of the athermal fading on
the structural characteristics, the g fading factors of all samples were
ploted together for the sake of comparison; these are presented in
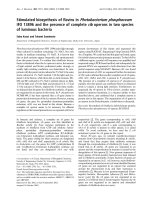
Fig. 5a. The data regarding the g-factors over all samples indicate that
the corresponding values fall clearly within three distinctive groups,
each one corresponding to the groups of sanidines, orthoclases and
microclines. More specifically, for the case of sanidines, the values of the
g fading factor yield smooth increase up to temperatures around 300 ◦ C,
and mild decrease over this temperature. For the case of orthoclases, a
wide plateau is observed between 200 and 350 ◦ C, followed by a smooth
decline at higher temperatures. Finally for the case of microclines,
smooth decrease is monitored within the temperature range between
200 and 450 ◦ C. It is quite important to note that independent of the Kfeldspar type, g fading factors decrease abruptly for temperatures over
450 ◦ C. For a specific temperature, g factors of sanidines get highest
values while the corresponding of microclines the lowest values. This
latter feature stands in excellent agreement to Fig. 4.
Similarly, Fig. 5b presents the g50 factors of all samples. In this case,
the corresponding data over all samples indicate that the values fall
clearly in two groups, one corresponding to the group of sanidines
solely, while the other group includes both orthoclases and microclines.
Fig. 5. Fading rate results on the K-feldspar samples of the present study consisting of the plots of both fading factors g (plot a) and g50 (plot b) within intervals of
10 ◦ C versus the TL glow curve temperature.
5
G.S. Polymeris et al.
Radiation Measurements 155 (2022) 106789
For the former group, the values of g50 factors yield a smooth linear
decrease for temperatures up to 400 ◦ C, that becomes faster over 400 ◦ C.
In contrast, for either cases of microclines and orthoclases, the values of
g50 factors form a wide plateau within the range 200 and 400 ◦ C. In all
cases, a steep decrease is monitored over 400 ◦ C. Discrimination be
tween orthoclases and microclines within the former group using only
the g50 factor is not possible. This latter factor is calculated using Eq. (3)
and via the dimensionless density of acceptors’ parameter ρ′ . Fig. 6
shows the behavior of this latter parameter ρ’ versus the TL glow curve
temperature for a selection of samples that include one microcline, one
sanidine and one orthoclase. Only one example is presented for each
group. As this figure strongly suggests, the dependence of the dimen
sionless density of acceptors is quite mild to both TL glow curve tem
perature as well as to the structural state characteristics of the Kfeldspars. Similar results were also reported by Angeli et al. (2020),
regarding the dependence of the values of parameter ρ′ on the structural
state characteristics of the K-feldspar samples. Thus the dependence of
the g50 factor on characteristics such as the unit cell volume or the
probability to occupy the T1(o) and T1(m) sites Σt1, reflects the depen
dence of the parameter ρ′ on such features.
The final result of the present study indicates that the ubiquitous
athermal fading phenomenon is more intense in sanidines and less
intense in microclines. This is not the first time that macroscopic
experimental luminescence features are correlated to microscopic
structural state characteristics of the K-feldspar samples (Biswas and
Singhvi, 2013; Angeli et al., 2020 and references therein). In fact, as
sanidines yield the lowest unit cell volume among all three groups, it is
quite straightforward to consider that at the same time K-feldspars of
this group indicate quite high values of charge density and consequently
the highest values for the dimensionless parameter ρ′ . The present
manuscript indicates that AF in K-feldspar samples take advantage of the
nearest pairs of donnor and acceptor charges. In microcline samples
where the local dimensionless parameter ρ′ is lower than in all other
groups, AF is less intense.
Finally, it is important to note that in both cases of remnant TL after
30 days storage time (Fig. 4) as well as either g or g50 factors plotted
versus temperature (Fig. 5) plateaus are formed within specific tem
perature regions and with varying temperature widths. Those plateaus,
wherever available, indicate trapping states with similar athermal
fading characteristics on the timescales considered. As each group of Kfeldspars indicates individual AF features, a prevalent correction is not
possible over all K-feldspars. Instead, such a correction might be possible
for each group of K-feldspars independently.
• Among the three groups of K-feldspars, sanidines yield more intense
athermal fading while microclines yield weak athermal fading.
• Discrimination among the three different groups could be achieved
using the g fading factor but not the g50 factor.
• Due to mild dependence of either g and g50 factors on the TL glow
curve temperature, the present study suggests the term “anomalous”
instead of “athermal” fading.
Declaration of competing interest
The authors declare that they have no known competing financial
interests or personal relationships that could have appeared to influence
the work reported in this paper.
References
Aitken, M.J., 1985. Thermoluminescence Dating. Clarendon Press.
Angeli, V., Kitis, G., Pagonis, V., Polymeris, G.S., 2020. Sequential two-step optical
stimulation in K-feldspars: correlation among the luminescence signals and
implications for modeling parameters. J. Lumin. 226, 117425.
Auclair, M., Lamothe, M., Huot, S., 2003. Measurement of anomalous fading for feldspar
IRSL using SAR. Radiat. Meas. 37 (4–5), 487–492.
Balian, H.G., Eddy, N.W., 1977. Figure of Merit (FOM): an improved criterion over the
normalized chi-square test for assign the goodness-of-fit of gamma ray spectral
peaks. Nucl. Instrum. Methods 145, 389–395.
Biswas, R.H., Singhvi, A.K., 2013. Anomalous fading and crystalline structure; studies on
individual chondrules from the same parent body. Geochronometria 40 (4),
250–257.
Bøtter-Jensen, L., Bulur, E., Duller, G.A.T., Murray, A.S., 2000. Advances in luminescence
instrument systems. Radiat. Meas. 32, 523–528.
Bowman, S.G.E., 1988. Nucl. Tracks Radiat. Meas. 14, 131.
Buylaert, J.P., Murray, A.S., Thomsen, K.J., Jain, M., 2009. Testing the potential of an
elevated temperature IRSL signal from K-feldspar. Radiat. Meas. 44, 560–565, 2009.
Chen, R., McKeever, S.W.S., 1997. Theory of Thermoluminescence and Related
Phenomena. World Scientific, Singapore.
Duller, G.A.T., 1997. Behavioural studies of stimulated luminescence from feldspars.
Radiat. Meas. 27 (5–6), 663–694.
Huntley, D.J., Lamothe, M., 2001. Ubiquity of anomalous fading in K-feldspar and the
measurement and correction for it in optical dating. Can. J. Earth Sci. 38,
1093–1106, 2001.
Jain, M., Guralnik, B., Andersen, M.T., 2012. Stimulated luminescence emission from
localized recombination in randomly distributed defects. J. Phys. Condens. Matter
24, 385402.
Kitis, G., Kiyak, N.G., Polymeris, G.S., 2015. Temperature lags of luminescence
measurements in a commercial luminescence reader. Nucl. Instrum. Methods Phys.
Res. B 359, 60–63.
Kitis, Polymeris, G.S., ahiner, E.V., Meriỗ, M., Pagonis, G., 2016. Influence of the
infrared stimulation on the optically stimulated luminescence in four K-feldspar
samples. J. Lumin. 176, 32–39.
Kroll, H., Ribbe, P.H., 1987. Determining (Al, Si) distribution and strain in alkali
feldspars using lattice parameters and diffraction-peak positions: a review. Am.
Mineral. 72, 491–506.
Pagonis, V., Brown, N.D., Peng, J., Kitis, G., Polymeris, G.S., 2021. On the deconvolution
of promptly measured luminescence signals in feldspars. J. Lumin. 239, 118334.
Pagonis, V., Kitis, G., 2015. Mathematical aspects of ground state tunnelling models in
luminescence materials. J. Lumin. 168, 137–144.
Pagonis, V., Kitis, G., Polymeris, G.S., 2020. Quantum tunneling processes in feldspars:
using thermoluminescence signals in thermochronometry. Radiat. Meas. 134,
106325.
Pagonis, V., Phan, H., Ruth, D., Kitis, G., 2013. Further investigations of tunnelling
recombination processes in random distributions of defects. Radiat. Meas. 58, 66–74.
Pagonis, V., Polymeris, G.S., Kitis, G., 2015. On the effect of optical and isothermal
treatments on luminescence signals from feldspars. Radiat. Meas. 82, 93–101.
Polymeris, G.S., Sfampa, I.K., Niora, M., Stefanaki, E.C., Malletzidou, L.,
Giannoulatou, V., Pagonis, V., Kitis, G., 2018. Anomalous fading in TL, OSL and TA OSL signals of Durango apatite for various grain size fractions; from micro to nano
scale. J. Lumin. 195, 216–224, 2018.
Polymeris, G.S., Giannoulatou, V., Sfampa, I.K., Tsirliganis, N.C., Kitis, G., 2014. Search
for stable energy levels in materials exhibiting strong anomalous fading: the case of
apatites. J. Lumin. 153, 245–251.
Polymeris, G.S., Kitis, G., Pagonis, V., 2017. Thermoluminescence glow curves in
preheated feldspar samples: an interpretation based on random defect distributions.
Radiat. Meas. 97, 20–27.
Polymeris, G.S., Theodosoglou, E., Kitis, G., Tsirliganis, N.C., Koroneos, A.,
Paraskevopoulos, K.M., 2013. Preliminary results on structural state characterization
of K-feldspars by using thermoluminescence. Mediterranean Archaeology and
Archaeometry 13 (3), 155161.
Polymeris, G.S., ahiner, E.V., Meriỗ, M., Kitis, G., 2015. Thermal assistance in TA-OSL
signals of feldspar and polymineral samples; comparison with the case of pure
quartz. Radiat. Meas. 81, 270–274.
5. Conclusions
• Fading rate was studied in two ways (a) by plotting the remnant TL
after storage time of 1 month (namely the ratio
TL30 days
TL0 )
versus TL
glow curve temperature and (b) by calculating both fading factors g
and g50 (the latter describes the fading rate when the TL signal has
been reduced to 50% of the prompt value measured after irradiation)
within intervals of 10 ◦ C within the entire TL glow curve and plotting
them versus TL glow curve temperature.
• As the TL glow curves of K-feldspars are quite complex, calculation of
the fading rate within intervals of 10 ◦ C throughout the entire TL
glow curve region over all potassium feldspar samples was helpful in
identifying the temperature ranges at which the signal loss is seen
simply due to either the lifetime of charge at room temperature or
anomalous fading.
• The wide plateau of both g and g50 parameters suggests that anom
alous fading is ubiquitous over the TL glow curve within 200–380 ◦ C
in all K-feldspar samples.
• The values of these aforementioned fading parameters are clearly
correlated to the crystal structure of the K-feldspars.
6
G.S. Polymeris et al.
Radiation Measurements 155 (2022) 106789
Polymeris, G.S., Tsirliganis, N.C., Loukou, Z., Kitis, G., 2006. A comparative study of
anomalous fading effects of TL and OSL signals of Durango apatite. Phys. Status
Solidi 203, 578–590.
Prasad, A.K., Poolton, N.R.J., Kook, M., Jain, M., 2017. Optical dating in a new light: a
direct, non-destructive probe of trapped electrons. Sci. Rep. 7, 12097.
Ribbe, P.H. (Ed.), 1983, Feldspar Mineralogy, second ed., vol. 2. Mineralogical Society of
America. Reviews in Mineralogy.
Sanderson, D.C.W., 1988. Fading of thermoluminescence in feldspars: characteristics and
corrections. Nucl. Tracks Radiat. Meas. 14, 155–161.
Șahiner, E., Kitis, G., Pagonis, V., Meriỗ, M., Polymeris, G.S., 2017. Tunnelling
recombination in conventional, post-infrared and post-infrared multi-elevated
temperature IRSL signals in microcline K-feldspar. J. Lumin. 188, 514–523.
Sfampa, I.K., Polymeris, G.S., Pagonis, V., Kitis, G., 2019. Correlation between isothermal
TL and IRSL in K-Feldspars of various types. Radiat. Phys. Chem. 165, 108386.
Sfampa, I.K., Polymeris, G.S., Pagonis, V., Theodosoglou, E., Tsirliganis, N.C., Kitis, G.,
2015. Correlation of basic TL, OSL and IRSL properties of ten K-feldspar samples of
various origins. Nucl. Instrum. Methods Phys. Res. B 359, 89–98.
Spooner, N.A., 1994. The anomalous fading of infrared-stimulated luminescence from
feldspars. Radiat. Meas. 23 (2–3), 625–632.
Theodosoglou, E., Koroneos, A., Soldatos, T., Zorba, T., Paraskevopoulos, K.M., 2010.
Comparative Fourier transform infrared and X-ray powder diffraction analysis of
naturally occurred K-feldspars. In: Bulletin of the Geological Society of Greece,
Proceedings of the 12th International Congress, Patras, pp. 2752–2761.
Thomsen, K.J., Murray, A.S., Jain, M., Bøtter-Jensen, L., 2008. Laboratory fading rates of
various luminescence signals from feldspar-rich sediment extracts. Radiat. Meas. 43,
1474–1486.
Visocekas, R., Spooner, N.A., Zink, A., Blanc, P., 1994. Tunnel afterglow, fading and
infrared emission in thermoluminescence of feldspars. Radiat. Meas. 23, 377–385.
Wintle, A.G., 1977. Detailed study of minerals exhibiting anomalous fading. J. Lumin.
15, 385–393.
Wintle, A.G., 1973. Anomalous fading of thermo-luminescence in mineral samples.
Nature 245, 143–144.
7