The relationship between irradiation sensitivity of quartz Al and Ti centers and baking temperature by volcanic lava flow: Example of Datong volcanic group, China
Bạn đang xem bản rút gọn của tài liệu. Xem và tải ngay bản đầy đủ của tài liệu tại đây (8.68 MB, 9 trang )
Radiation Measurements 157 (2022) 106823
Contents lists available at ScienceDirect
Radiation Measurements
journal homepage: www.elsevier.com/locate/radmeas
The relationship between irradiation sensitivity of quartz Al and Ti centers
and baking temperature by volcanic lava flow: Example of Datong volcanic
group, China
Chun-Ru Liu a, Hao Ji a, *, Wen-Peng Li b, Chuan-Yi Wei a, Gong-Ming Yin a, **
a
b
State Key Laboratory of Earthquake Dynamics, Institute of Geology, China Earthquake Administration, Beijing, 100029, China
Department of Ocean Science and Engineering, Southern University of Science and Technology, Shenzhen, 518055, China
A R T I C L E I N F O
A B S T R A C T
Keywords:
Quartz
Electron spin resonance (ESR)
Al center
Ti center
Lava flow
Datong volcano group
The investigation of irradiation sensitivity of electron spin resonance (ESR) centers is a significant part of the
study of ESR signal characteristics and helps to gain insight into the physical mechanisms of paramagnetic
centers. In this study, we have observed and compared the irradiation sensitivity characteristics of ESR centers
under high-temperature baking in natural conditions by lava flow. Results show that the irradiation sensitivity of
the Al and Ti–Li centers increases with the baking temperature, while the irradiation sensitivity of the Ti–H
center increases first (up to ~500 ◦ C) and then decreases with temperature. Moreover, the ESR intensity of the Ti
center is more strongly dependent on the annealing history of the samples than the Al center. In addition, from
the results of the heating experiment, after heating above 1000 ◦ C, additional irradiation does not produce new
Ti–H signals, which probably indicates that the paleo-temperature of the lava flow in Yujiazhai area did not
exceed 1000 ◦ C.
1. Introduction
Structural defects in solids (charged electron and electron hole traps)
may be produced by radioactive elements decaying in the environment.
The increase in defect concentration is positively correlated with the
increase in the accumulation of radiation dose. Electron spin resonance
(ESR) is one of the main dating techniques which are based on the
accumulation of radiation defects in solids being the same as lumines
cence dating (Vyatkin and Koshchug, 2020). In ESR dating, lattice de
fects with unpaired electrons are analyzed to determine the accumulated
dose of radiation and hence the age (Toyoda and Ikeya, 1991).
Quartz is one of the most abundant minerals on the surface of the
earth which is often used for ESR dating (e.g. Grün et al., 1999; Toyoda
et al., 2000), such as for fault gouge (e.g. Ikeya et al., 1982), volcanic
tephra (e.g. Imai et al., 1985; Suchodoletz et al., 2012), flint (e.g. Porat
et al., 1994), and sediment (e.g. Yokoyama et al., 1985; Liu et al., 2010).
The recent studies of the signal characteristics are mainly focused on the
feature of light fading (e.g. Yokoyama et al., 1985; Toyoda et al., 2000;
Voinchet et al., 2003), thermal behavior (e.g. Fukuchi, 1989; Toyoda
and Ikeya, 1991; Toyoda et al., 1993; Falgu`
eres et al., 1994; Vyatkin and
Koshchug, 2020), dose-response (e.g. Grün and Macdonald, 1989; Grün
and Brumby, 1994; Voinchet et al., 2013; Duval and Guilarte, 2015;
Tsukamoto et al., 2018), and potential use for sediment provenance
tracing (e.g. Tissoux et al., 2015; Wei et al., 2017, 2019), etc.
Changes in ESR heating, bleaching, and irradiation (Poolton et al.,
2000) sensitivity of quartz as a result of laboratory treatments had been
studied, however, there are very few studies from natural conditions, in
spite of the studies of luminescence dating, which is similar to the ESR
principle, many sensitivity studies have been carried out and a lot of
reliable results have been achieved (e.g. Lai and Wintle, 2006; Zheng
et al., 2009; Lü and Sun, 2011). So it was significantly necessary to check
the feature of the sensitivity (mainly irradiation) of ESR centers in nat
ural conditions.
The Quaternary Datong volcanic group (DVG) is the most important
monogenetic volcanic region in eastern China. The volcanic basalt
overlays the lacustrine strata, forming the baking strata with different
temperatures, and the closer to the basalt, the higher the baking tem
perature. The lacustrine strata baked by lava flow provides a good
natural sample for the study of sensitivity characteristics of quartz ESR
centers because compared with the result of laboratory treatments: 1)
* Corresponding author.
** Corresponding author.
E-mail addresses: (H. Ji), (G.-M. Yin).
/>Received 30 November 2021; Received in revised form 15 June 2022; Accepted 29 June 2022
Available online 1 July 2022
1350-4487/© 2022 Elsevier Ltd. All rights reserved.
C.-R. Liu et al.
Radiation Measurements 157 (2022) 106823
the characteristics of quartz baked by lava flow are the same because of
the same provenance of sediments (Wang et al., 2002); 2) after depo
sition the lacustrine strata have been baked at different temperatures
from high (hundreds or even over a thousand) to low (natural envi
ronment temperature) depending on the depth; 3) the sample was baked
in the air, not in the oven; 4) the raw sediment was baked, not just quartz
grains; 5) the baked time was much longer, days or even months; 6) after
baking, the sample was irradiated at the natural dose rate rather than
artificially irradiated at 8 to 10 orders of magnitude higher than the
natural dose rate; 7) before baking, the lacustrine sediments was
bleached under natural sunlight; 8) judging from the characteristics of
the lacustrine sediments closest to the basalt, water should be involved
in the lava flow baking.
Therefore, in the present study, we have observed and compared the
irradiation sensitivity (the amount of signal growth per unit dose)
characteristics of quartz ESR centers in natural conditions by lava flow.
In addition, according to the heating experiment, we estimated the
paleo-temperatures of the lava flow and the associated baking layers.
Zhao et al., 2012; Zhao et al., 2015).
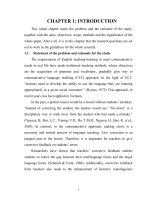
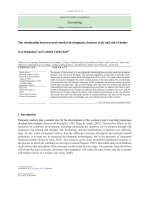
The sampling site is located on the north bank of Cetian Reservoir the
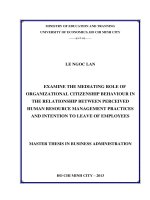
southwest of Yujiazhai village, and the southeast of DVG (Fig. 2). The
upper part of the sample section is covered with basalt which has a
thickness of about 4 m. Chen et al. (1986) used the K–Ar method to
determine the average age of basalt in Cetian Reservoir as ~0.4 Ma. The
baked layer is about 1.2 m and has a distinct red color compared with
the unfired layer (Liu et al., 2015). According to the baking color and
degree, from high to low, the baked layer can be divided into four parts
(Fig. 2): (1) sintering layer. Indirect contact with lava flow, due to high
temperature and pressure, the loose sediments consolidated into hard
blocks with brick red color and thickness of ~10 cm, with numerous
pores and rolling structure. The basalt is inclined upward at the contact
surface between the basalt and lacustrine layer. (2) High temperature
quenched layer, located in the lower part of the sintered layer, between
10 and 20 cm deep. It is speculated that water is involved in baking, so it
shows the characteristics of high-temperature quenching, gray and
looseness, spherical structure, and more pores (Fig. 2c). (3) High baking
temperature layer at a depth between 20 cm and 80 cm, dense and dark
red. (4) Low baking temperature layer at a depth between 80 cm and
120 cm, dense and yellow-green, and the grain size of the sediment is
smaller than for the upper layers. (5) The typical lacustrine layer is
located at depths below 120 cm, yellow-white and dense. It contains a 5
cm thick calcium carbonate plate at the depth of 160 cm (Fig. 2e).
We sampled sediments in these different layers (0–10, 10–20, 30–40,
50–60, 70–80, 90–100, 110–120, 130–140, 150–160, and 170–180 cm)
and named them S1-10 to evaluate the impact of the baking temperature
on the quartz ESR centers under natural conditions, and in order to
evaluate the dose rates of sample S1 and S2, we also collected a basalt
sample (B1) at about 10 cm from the top of the lacustrine layer for
analysis (Fig. 2).
2. Samples
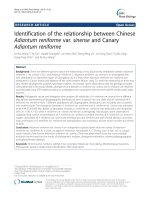
The sample site is located in the central part of Nihewan Basin, and
the Sanggan River flows through Nihewan Basin from west to east.
Typical lacustrine strata (tens of meters thick) are widely distributed in
Nihewan Basin along the banks of the Sanggan River. The sedimentary
deposit studied is considered to be homogeneous and the quartz initially
(before baking) should have the same physical properties. The Cetian
Reservoir was built on the Sanggan River in the Nihewan Basin. The lava
flow from DVG, located in the eastern part of Datong City, covered the
lacustrine strata at the north bank of Cetian Reservoir (Fig. 1).
There are at least 13 volcanic cones in the western part of the DVG,
composed predominantly of alkali basalt produced by central-vent
eruptions, while the eastern part of the DVG is dominated by lava
flow composed mainly of tholeiites produced by fissure eruptions (e.g.
Zhang, 1986; Basu et al., 1991; Li and Xu, 1995; Xu et al., 2005).
Volcanism in the western part of the DVG dates from the late Middle
Pleistocene, at ~0.4 Ma, while in the eastern part it dates from the early
Middle Pleistocene, at ~0.76 Ma (e.g. Kaneoka et al., 1983; Chen et al.,
1992; Cheng et al., 2006). However, the timing of the ending of volca
nism in the region has been debated for several decades (e.g. Pei, 1981;
Zhou et al., 1982; Li and Sun, 1984; Zhu et al., 1990; Chen et al., 1992;
3. Experimental procedures
3.1. Quartz extraction and irradiation
There is a significant difference in grain size between the upper and
lower. It is clayey silt at the depth of 0–80 cm, and silty clay below 80
cm. So, it is hard to separate the fraction larger than 100 μm below 80
cm. For comparing the natural signal intensity of quartz, 80–100 μm
fraction in all the samples was chosen to avoid any difference caused by
Fig. 1. Location map of the study area and sampling site.
2
C.-R. Liu et al.
Radiation Measurements 157 (2022) 106823
Fig. 2. Sampling profile of Yujiazhai and sample locations on the profile.
different quartz particle sizes. After sieving, pure quartz was obtained
through chemical separation techniques detailed by Liu et al. (2010).
For investigating the irradiation sensitivity change, six samples of
different baking characteristics were selected for the study: S1and S2
were selected for different colors and features; S3 and S5 were selected
with 30 cm intervals for S3, S4 and S5 have the same color and features;
S7 was selected to be 30 cm from S5 for S6 and S7 have the same color
and features; S8 was selected because it is hard to extract enough quartz
in S9 and S10 for higher calcium content. The quartz grains extracted
from six samples (S1, S2, S3, S5, S7, and S8) were divided into several
200 mg aliquots, seven of them were irradiated using a60Co gamma
source with the dose range of 109–2072 Gy.
a Bruker ER-041-XG X-band spectrometer in a finger dewar cooled to 77
K with liquid nitrogen, in the ESR laboratory of the Institute of Geology,
China Earthquake Administration, Beijing. The experimental parame
ters were: microwave power 5 mW and modulation amplitude 0.16 mT.
The Al center intensity was measured from the top of the first peak to the
bottom of the 16th peak (Yokoyama et al., 1985). The Ti–Li center in
tensity was taken from the top of the peak at g = 1.979 to the bottom at
g = 1.913 (Rink et al., 2007; Liu et al., 2010) and the average of the two
peaks near g = 1.986 to the baseline is used as the signal intensity of the
Ti–H center. Fig. 3 showed the natural S3 sample ESR spectrum at low
temperature (77K, liquid nitrogen). Considering the angular depen
dence of the ESR signal due to the sample heterogeneity, each aliquot
was measured six times after a rotation of 60◦ angle in the cavity to
obtain the average intensity.
3.2. ESR measurement
The ESR intensities of both the Al and Ti centers were measured with
3
C.-R. Liu et al.
Radiation Measurements 157 (2022) 106823
4. Results
4.1. ESR measurement of natural (non-irradiated) aliquots
In this section we want to compare quantificationally the ESR signal
intensity of natural quartz because quartz at different depths: 1) theo
retically, has the same provenance and the same transport and deposi
tion process before deposition; 2) after deposition, was partial or
complete thermal bleaching by lava flow depending on the depth; 3)
after baking, was irradiated continuously at natural dose rate for hun
dreds of thousands of years.
The dose rates were shown in Table 1, range of 2.72–3.17 Gy/ka, low
in the upper layer and high in the lower layer. Theoretically, if there is
no change in irradiation sensitivity characteristics of quartz ESR centers
at different depths, the intensity of quartz ESR centers should increase
with the depth according to stratigraphic order. However, the ESR in
tensity of quartz at different baking layers varies greatly. The natural
quartz ESR spectrum of several samples (S1, S4, S7, and S10) at low
temperature (77K) were shown in Fig. 4.
Fig. 3. ESR spectrum showing the intensity of the Al, Ti–Li, and Ti–H centers in
natural sample S3 (77K, liquid nitrogen).
3.3. Dose rate
4.1.1. The Al center
Fig. 5a shows the evolution of the Al center signal intensity versus
the depth of sampling. It can be divided into three stages: 1) During the
first stage, between 180 and 130 cm, the signal intensity does not change
significantly. 2) The second stage corresponds to a rapid decrease of
signal intensity between 130 and 50 cm. 3) The third stage corresponds
to a rapid increase of intensity between 50 cm and the top of the
sequence.
Considering the dose rate and stratigraphic order, the Al center in
tensity of the second stage (130-50 cm) should be equal to or slightly less
than that of the first stage (180-130 cm). The Al center intensity of the
second stage is much smaller than that of the first stage because the
quartz was baked at high temperatures (over 220 ◦ C), and the ESR in
tensity of the Al center decrease at 220 ◦ C (Toyoda and Ikeya, 1991), and
then released.
Dose rate is one of the factors to compare ESR signal characteristics
of quartz in different baking layers (see 4.1 section). The external dose
rate consists of the beta and gamma dose rates from the radioactive el
ements (U, Th, K) in the sediments immediately surrounding the sample,
plus the contribution from cosmic rays. However, as a result of the
gamma rays having an average range of 30 cm, the calculation of the
gamma dose rate for samples S1 and S2 should take into account the
contribution of the overlying basalt. Considering the depths of samples
S1 and S2, we estimate the contribution ratios of basalt and sediment to
gamma dose rate as 1:1 and 1:3, respectively. Radioactive elements (U,
Th, K) concentrations were determined by ICP-OES/MS analysis of the
natural sediments and basalt. The external alpha dose rate was not
considered for hydrofluoric acid etching in quartz extraction (Liu et al.,
2010). The external beta and gamma dose rates were derived using the
dose rate conversion factors from Gu´erin et al. (2011). We assumed a
grain size of 90 μm for beta ray attenuation, and the attenuation factor is
0.93 (Mejdahl, 1979). Since the sediments were dry at the time of
sampling, current water is more likely underestimated in comparison
with the past water content, and therefore it is estimated to be 10%
concerning previous ESR studies in the Nihewan Basin (The lacustrine
strata are the same set of sedimentary stratigraphy as in the Nihewan
Basin) (Liu et al., 2010, 2013, 2014). In addition, the water content of
basalt is considered to be 0%. The cosmic dose rate contributions were
calculated using the formulae proposed by Prescott and Hutton (1988),
with depth, altitude, and latitude corrections (Prescott and Hutton,
1994).
4.1.2. The Ti center
There are three types of Ti centers according with the nature of the
compensator cations: Ti–Li center, Ti–H center and Ti–Na center. The
Ti–Na center is however very rarely observed in natural quartz. In this
study, we did not observe the presence of this center in middle and lower
layer (S5, S6, S7, S8, S9 and S10), so we will just discuss the signal
characteristics of the Ti–Li and Ti–H centers.
The signal intensity of the Ti–Li center remains basically unchanged
for the lower part of the sequence from 180 to 130 cm depth, then de
creases to the minimum value at 90 cm, and then increases slowly with
the increasing baking temperature at the depth between 90 and 30 cm,
before to lastly grows rapidly until the top of the section, as shown in
Fig. 5b.
The Ti associated donor electrons are recombining predominantly at
the [AlO4]0 acceptors. The annealing process may lead directly to the
Table 1
Dose rates for samples S1–S10 and B1 from the Yujiazhai profile.
Sample No.
Depth (cm)
U (ppm)
Th (ppm)
K (%)
Water content (%)
Dβ (Gy/ka)
Dγ (Gy/ka)
Dcos (Gy/ka)
Dtotal (Gy/ka)
S1
S2
S3
S4
S5
S6
S7
S8
S9
S10
B1
5
15
35
55
75
95
115
135
155
175
0
1.52 ±
1.59 ±
1.62 ±
1.61 ±
2.06 ±
2.27 ±
2.13 ±
2.24 ±
2.19 ±
2.72 ±
0.80 ±
8.85 ± 0.44
9.83 ± 0.49
10.17 ± 0.51
8.84 ± 0.44
10.62 ± 0.53
9.71 ± 0.49
11.42 ± 0.57
11.75 ± 0.59
10.72 ± 0.54
10.64 ± 0.53
2.40 ± 0.12
2.33 ± 0.12
2.29 ± 0.11
1.91 ± 0.10
1.90 ± 0.10
1.99 ± 0.10
1.98 ± 0.10
2.11 ± 0.11
2.08 ± 0.10
2.15 ± 0.11
1.89 ± 0.10
0.72 ± 0.04
10 ± 5
10 ± 5
10 ± 5
10 ± 5
10 ± 5
10 ± 5
10 ± 5
10 ± 5
10 ± 5
10 ± 5
0
1.900 ±
1.904 ±
1.668 ±
1.630 ±
1.782 ±
1.780 ±
1.887 ±
1.888 ±
1.904 ±
1.796 ±
1.024
1.082
1.015
0.955
1.096
1.075
1.163
1.181
1.148
1.140
0.384
0.120 ±
0.119 ±
0.115 ±
0.112 ±
0.108 ±
0.105 ±
0.105 ±
0.099 ±
0.097 ±
0.094 ±
2.72 ±
2.93 ±
2.80 ±
2.70 ±
2.99 ±
2.96 ±
3.16 ±
3.17 ±
3.15 ±
3.03 ±
0.08
0.08
0.08
0.08
0.10
0.11
0.11
0.11
0.11
0.14
0.04
4
0.072
0.074
0.065
0.063
0.069
0.069
0.073
0.073
0.074
0.070
± 0.026
± 0.028
± 0.026
± 0.028
± 0.028
± 0.032
± 0.030
± 0.030
± 0.034
± 0.034
± 0.010
0.006
0.006
0.006
0.006
0.005
0.005
0.005
0.005
0.005
0.005
0.15
0.16
0.14
0.13
0.15
0.15
0.15
0.16
0.15
0.15
C.-R. Liu et al.
Radiation Measurements 157 (2022) 106823
Fig. 4. The natural quartz ESR spectrum of several samples (S1, S4, S7, and S10) at low temperature (77K, liquid nitrogen).
dissociation of Li, H associates (Poolton et al., 2000), rather than first
changing their charge state (Weil, 1984). Thus, the intensity of Ti–Li
center from 50 cm to 0 cm increases (Fig. 6), similar to that of Al center.
Compared with the Al and Ti–Li centers, the signal intensity of the
Ti–H is very weak. As shown in Fig. 5c, the signal intensity of Ti–H
center initially remains consistent at the depth of 180–130 cm, then
increases to a maximum at 50 cm and decreases sharply with the in
crease of baking temperature.
It is very interesting to compare Fig. 5b and c that there is a good
correspondence between the stage of rapid increase of natural signal
intensity of the Ti–Li center and the stage of rapid decrease of natural
signal intensity of the Ti–H center (40-0 cm). Poolton et al. (2000) also
observed this phenomenon by heating quartz samples before artificial
irradiation and proposed the following explanation: beyond 870 ◦ C
(temperature of the transition from β-quartz to β-tridymite), the Ti–H
centers become unstable and dissociate, this would leave isolated Ti ions
available for Li capture, and then enhance the Ti–Li center population.
At the stage where the natural signal intensity of ESR centers changes
significantly (60-0 cm), compared with the change of less than one time
of the Al center intensity, the signal intensity of the Ti–Li and Ti–H
centers changed by a factor of 7 and 2, respectively. It indicates that the
ESR intensity of the Ti center is more strongly dependent on the
annealing history of the samples than the Al center (Poolton et al.,
2000). As there are many potential sources of H+ and Li+ within the
lattice in quartz, including water inclusions, OH molecules, [H3O4]0
defects, and cations associated with the Al or other centers (Halliburton
et al., 1979; Nuttall and Weil, 1981; Yang and McKeever, 1990), the
observed signal intensity change is much greater for Ti related signal
centers than for Al center.
Compared with the signal intensity at the depth of 180–130 cm, the
maximum intensity value of both Ti–Li and Ti–H center has been
increased by two times and one time respectively (Fig. 5b and c). Ac
cording to the measurement results of dose rate (Table 1), we speculated
that the irradiation sensitivity of both Ti–Li and Ti–H centers changed
after high-temperature baking.
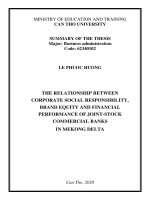
ESR intensity with irradiation for the six samples is shown in Fig. 6.
5. Discussion
In this study, the irradiation sensitivity is defined as the amount of
signal growth per unit dose, that is:
K = △E/△Gy
Where K is the irradiation sensitivity constant, △E is the intensity of
ESR signal growth after received irradiation of △Gy.
Recently, the Exponential + linear (EXP + LIN) function and Double
saturating exponential (DSE) function have been recommended for dose
response behavior fitting of the Al and Ti–Li centers, respectively (e.g.
Duval, 2012; Duval and Guilarte, 2015). But, in order to facilitate
comparison and discussion, linear fitting is adopted in this study because
the linear fitting is close to the exponential fitting in the low dose part,
the maximum value of artificial irradiation is 2072 Gy in this study
(Fig. 6). The linear fitting equation is expressed as:
I=K*(D + DE)
Where I is the ESR intensity, D is the additional irradiation dose, DE is
the equivalent dose. The results of fitting see Table 2.
5.1. The Al center
According to the results of fitting (Table 2), the order of irradiation
sensitivity constant of the Al center can be roughly expressed as KS8 =
KS7 < KS5 < KS3 < KS2 = KS1(Fig. 6a), indicating that the change of
irradiation sensitivity of the Al center increases with the baking tem
perature. The Al center sensitivity of S7 is the same as that of S8, indi
cating that the layer where S7 is located is not affected by baking or the
baking temperature is not sufficient to change the irradiation sensitivity
of the Al center. As shown in Fig. 5a, in the first stage (180-130 cm), the
signal intensity of the Al center basically does not vary. We interpret it as
below 130 cm, the sediments were not affected by baking and the signal
intensity of the Al center is the geological original intensity. In the
second stage (130-50 cm, between S7 and S3) the irradiation sensitivity
of the Al center is increase, but the intensity of it decreases as the rise of
baking temperature. Therefore, it can be concluded that the signal in
tensity of unbleachable part (during the deposition process) in Al center
was released by the baking temperature at this stage, but the baking
temperature was not sufficient to change the irradiation sensitivity of
this center. In the third stage (50-0 cm), the Al signal increases with
decreasing depth, corresponding to the irradiation sensitivity of the Al
4.2. ESR measurement of irradiated aliquots
According to the results of natural (non-irradiated) aliquots, we
suggest that high-temperature baking may change the irradiation
sensitivity of Al, Ti–Li, and Ti–H centers in quartz. To verify this, we
have conducted an artificial irradiation experiment for six samples (S1,
S2, S3, S5, S7, and S8) to confirm whether the irradiation sensitivities of
ESR centers actually change after baking by lava flow. The growth of
5
C.-R. Liu et al.
Radiation Measurements 157 (2022) 106823
Fig. 6. Evolution of the signal intensity of ESR centers with accumulated
gamma dose. (a) Al center, (b) Ti–Li center, and (c) Ti–H center. For Ti–H
center, since the signal intensities of Sample S3 and S5 are much greater than
the other four samples, two intensity axes were established to compare them
together with the accumulated gamma dose. S1, S2, S7, and S8 correspond to
the left intensity axis and S3 and S5 correspond to the right intensity axis.
Fig. 5. Variation of signal intensity of ESR centers vs depth. (a) Al center, (b)
Ti–Li center, and (c) Ti–H center.
center increases with the baking temperature (Fig. 6a). This suggests
that high-temperature baking near to the lava flow is sufficient to alter
the irradiation sensitivity of the Al center, and that the higher the
temperature rises, the greater the sensitivity increases.
The Al center is a defect where an Al3+ replaces a Si4+ and is asso
ciated with a monovalent cation M+, such as H+, Li+, or Na+. Because of
6
C.-R. Liu et al.
Radiation Measurements 157 (2022) 106823
Table 2
The linear fitting results of quartz Al, Ti–Li, and Ti–H centers. K = irradiation
sensitivity constant; Adj. r2 = goodness-of-fit.
Sample No.
S1
S2
S3
S5
S7
S8
Al center
Ti–Li center
Ti–H center
K
Adj.r2
K
Adj.r2
K
Adj.r2
0.6450
0.6498
0.5171
0.2951
0.1070
0.1188
0.9786
0.9811
0.9854
0.9531
0.9667
0.9730
0.5459
0.6079
0.3816
0.1778
0.0199
0.0182
0.9898
0.9906
0.9639
0.9783
0.9730
0.9760
0.0019
0.0029
0.0297
0.0438
0.0035
0.0035
0.9696
0.9667
0.9881
0.9642
0.9699
0.9838
the irradiation at room temperature, after trapping a hole, the cation M+
diffuses away. Therefore, the increase of the Al center irradiation
sensitivity observed with baking may be due to the diffusion of the
cations within the quartz itself, and further studies are needed.
5.2. The Ti center
The order of irradiation sensitivity constant of the Ti–Li center can be
expressed as KS8 = KS7
baking temperature (Although the irradiation sensitivity of sample S2 is
slightly greater than that of S1), just like the behavior of the Al center,
but a little different is that the layer where the minimum signal value of
the Ti–Li center is located (90–100 cm) (Fig. 5b) is below the layer
where the minimum signal value of the Al center is located (50–60 cm)
(Fig. 5a). This suggests that the thermal stability of the Al center is
higher than that of the Ti–Li center, which is consistent with the results
observed by Toyoda and Ikeya (1991).
The variation of the Ti–H center sensitivity with temperature is
significantly different from that of the Al and Ti–Li centers. The irradi
ation sensitivity constant of samples at different layers can be expressed
as KS1
creases with baking temperature, which can well explain the variation of
the Ti–H center’s natural intensity at different layers on the profile
(Fig. 5c).
5.3. Estimating annealing temperatures
In order to estimate annealing temperatures for the different layers,
we attempted to perform a heating experiment (each aliquot was heated
for 12 h in the temperature range from 100 to 1100 ◦ C at 100 ◦ C in
tervals using a muffle furnace) in the laboratory and then irradiated a
specific dose value (6000 Gy) to observe the change of signal intensity of
ESR centers. To ensure that the quartz particles had the same origin, the
sample used was lacustrine sediment 350 cm from the basalt, and the
results are shown in Fig. 7.
Despite the difference between laboratory simulations and natural
conditions, we can still see that for the same ESR center, the signal in
tensities at different heating temperatures from laboratory simulations
(the red line in Fig. 7) show almost consistent trends with the natural
signal intensities at different depths in the profile (Fig. 5). Theoretically,
the change in the net increase in the signal intensity of ESR centers
before and after irradiation of samples (the signal intensity value of the
red line minus the signal intensity value of the blue line) with different
heating temperatures (Fig. 7) can be considered to represent a change in
irradiation sensitivity. Therefore, it can be clearly seen that the changes
of radiation sensitivity of the three ESR centers observed in the labo
ratory (Fig. 7) are coincident with those observed under natural con
ditions (volcanic baking) (Section 5.1 and 5.2), which can be seen as
additional evidence for our conclusion.
From Fig. 5, we can see that for the three ESR centers, there is a
significant inflection point in the signal intensity at 50–60 cm depth
Fig. 7. The relations between the signal intensity of ESR centers (before and
after gamma irradiation 6000 Gy) and annealing at different temperatures
(0–1100 ◦ C) for 12 h.
7
C.-R. Liu et al.
Radiation Measurements 157 (2022) 106823
uniformly, and by comparing with the heating curves, the inflection
point represents a temperature perhaps around 400–500 ◦ C. However,
for middle and lower layers (180-60 cm), the assessment of the
annealing temperatures only by ESR intensities is unreliable due to the
possibility of varying degrees of thermal bleaching of the ESR centers.
An interesting phenomenon is that after heating above 1000 ◦ C, addi
tional irradiation does not produce new Ti–H signals, and since Ti–H
signals can be observed in all of our samples, this probably indicates that
the paleo-temperature of lava flow did not exceed 1000 ◦ C.
It should be noted that according to the results of our heating
experiment, the changing behavior of the natural signal intensity of the
Ti–Li and Ti–H centers in the upper section (40-0 cm) may not be
explained by the quartz phase transition (β-quartz to β2-tridymite,
870 ◦ C) proposed by Poolton et al. (2000), and we speculate that this
may be related to another phase transition of quartz (α-quartz to
β-quartz, 573 ◦ C), which, of course, requires further experiments to
confirm.
Cheng, S.P., Li, C.Y., Yang, G.Z., Zhou, S.W., 2006. Differentiating Pleistocene
tectonically driven and climate-related fluvial incision: the Sanggan River, Datong
basin, north China. Geol. Mag. 143, 393–410.
Duval, M., 2012. Dose response curve of the ESR signal of the Aluminum center in quartz
grains extracted from sediment. Anc. TL 30, 41–49.
Duval, M., Guilarte, V., 2015. ESR dosimetry of optically bleached quartz grains
extracted from Plio-Quaternary sediment: evaluating some key aspects of the ESR
signals associated to the Ti-centers. Radiat. Meas. 78, 28–41.
Falgu`eres, C., Miaillier, D., Sanzelle, S., Fain, J., Laurent, M., Montret, M., Pilleyre, T.,
Bahain, J.-J., 1994. Potential use of the E’ center as an indicator of initial resetting in
TL/ESR dating of volcanic materials. Quat. Sci. Rev. 13, 619–623.
Fukuchi, T., 1989. Theoretical study on frictional heat by faulting using ESR. Appl.
Radiat. Isot. 40, 1181–1193.
Grün, R., Macdonald, P.D.M., 1989. Non-linear fitting of TL/ESR dose-response curves.
Appl. Radiat. Isot. 40, 1077–1080.
Grün, R., Brumby, S., 1994. The assessment of errors in past radiation doses extrapolated
from ESR/TL dose-response data. Radiat. Meas. 23, 307–315.
Grün, R., Tani, A., Gurbanov, A., Koshchug, D., Williams, I., Braun, J., 1999. A new
method for the estimation of cooling and denudation rates using paramagnetic
centers in quartz: a case study on the Eldzhurtinskiy Granite, Caucasus. J. Geophys.
Res. Solid Earth 104, 17531–17549.
Gu´
erin, G., Mercier, N., Adamiec, G., 2011. Dose-rate conversion factors: update. Anc. TL
29, 5–8.
Halliburton, L.E., Perlson, B.D., Weeks, R.A., Weil, J.A., Wintersgill, M.C., 1979. EPR
study of the E′ 4 center in α-quartz. Solid State Commun 30, 575–579.
Ikeya, M., Miki, T., Tanaka, K., 1982. Dating of a fault by electron spin resonance on
intrafault materials. Science 215, 1392–1393.
Imai, N., Shimokawa, K., Hirota, M., 1985. ESR dating of volcanic ash. Nature 314,
81–83.
Kaneoka, I., Notsu, K., Liu, C., 1983. K-Ar age and Sr isotopic ratio of a Pleistocene
Datong basalt, China. Bull. Volc. Soc. Japan 28, 75–78.
Lai, Z.P., Wintle, A.G., 2006. Locating the boundary between the Pleistocene and the
Holocene in Chinese loess using luminescence. The Holocene 16, 893–899.
Li, H., Sun, J., 1984. Research for Datong volcanic activity using TL age. Sci. China 7,
637–644.
Li, S., Xu, H., 1995. Depositional Characteristics of volcanic debris of Datong volcano
group in the eastern part of China. Acta Sedimentol. Sin. 13, 151–157.
Liu, C.R., Yin, G.M., Gao, L., Bahain, J.J., Li, J.P., Lin, M., Chen, S.M., 2010. ESR dating
of Pleistoncene archaeological localities of the Nihewan Bsain, North ChinaPreliminary results. Quat. Geochronol. 5, 385–390.
Liu, C.R., Yin, G.M., Fang, F., Voinchet, P., Deng, C.L., Han, F., Li, J.P., Song, W.J.,
Wang, D., Bahain, J.J., 2013. ESR dating of the donggutuo palaeolithic site in the
Nihewan Basin, northern China. Geochronometria 40, 348–354.
Liu, C.R., Yin, G.M., Deng, C.L., Han, F., Song, W.J., 2014. ESR dating of the majuangou
and banshan paleolithic sites in the Nihewan Basin, north China. J. Hum. Evol. 73,
58–63.
Liu, Z., Zhao, H., Wang, C.M., Li, S.H., 2015. Estimation of paleo-firing temperatures
using luminescence signals for the volcanic lava baked layer in Datong, China. Quat.
Geochronol. 30, 363–368.
Lü, T.Y., Sun, J.M., 2011. Luminescence sensitivities of quartz grains from eolian deposits
in northern China and their implications for provenance. Quat. Res. 76, 181–189.
Mejdahl, V., 1979. Thermoluminescence dating: beta-dose attenuation in quartz grains.
Archaeometry 21, 61–72.
Nuttall, R.H.D., Weil, J.A., 1981. The magnetic properties of the oxygen-hole aluminum
centers in crystalline SiO2. II. [AlO4/H+]+ and [AlO4/Li+]+. Can. J. Phys. 59,
1709–1718.
Pei, J.X., 1981. Dating of Sediments baked by lava flow in Datong area by thermoluminescence. Chin. Sci. Bull. 16, 1003–1005.
Poolton, N.R.J., Smith, G.M., Riedi, P.C., Bulur, E., BØtter-Jensen, L., Murray, A.S.,
Adrian, M., 2000. Luminescence sensitivity changes in nature quartz induced by high
temperature annealing: a high frequency EPR and OSL study. J. Phys. D: Appl. Phys.
33, 1007–1017.
Porat, N., Schwarcz, H.P., Valladas, H., Bar-Yosef, O., Vandermeersch, B., 1994. Electron
spin resonance dating of burnedflint from Kebara cave, Israel. Geoarchaeology 9,
393–407.
Prescott, J.R., Hutton, J.T., 1988. Cosmic ray and gamma ray dosimetry for TL and ESR.
Int. J. Radiat. Appl. Instrum. Nucl. Tracks Radiat. Meas. 14, 223–227.
Prescott, J.R., Hutton, J.T., 1994. Cosmic ray contributions to dose rates for
luminescence and ESR dating: large depths and long-term time variations. Radiat.
Meas. 23, 497–500.
Rink, W.J., Bartoll, J., Schwarcz, H.P., Shane, P., Ber-Yosef, O., 2007. Testing the
reliability of ESR dating of optically exposed buried quartz sediments. Radiat. Meas.
4, 1618–1626.
Suchodoletz, H., Blanchard, H., Hilgers, A., Radtke, U., Fuchs, M., Dietze, M., Ză
oller, L.,
2012. TL and ESR dating of middle Pleistocene lava flows on lanzarote island, canary
islands (Spain). Quat. Geochronol. 9, 54–64.
Tissoux, H., Voinchet, P., Lacquement, F., Despri´
ee, J., 2015. ESR as a method for the
characterization of alluvial sediments. Radiat. Meas. 81, 2–8.
Toyoda, S., Ikeya, M., 1991. Thermal stabilities of paramagnetic defect and impurity
centers in quartz: basis for ESR dating of thermal history. Geochem. J. 25, 437–445.
Toyoda, S., Ikeya, M., Dunnell, R.C., Mccutcheon, P.T., 1993. The use of electron spin
resonance (ESR) for the determination of prehistoric lithic heat treatment. Appl.
Radiat. Isot. 44, 227–231.
Toyoda, S., Voinchet, P., Falgu`eres, C., Dolo, J.M., Laurent, M., 2000. Bleaching of ESR
Signals by the sunlight: a laboratory experiment for establishing the ESR dating of
sediments. Appl. Radiat. Isot. 52, 1357–1362.
6. Summary and conclusions
In this paper, we investigated the relationship between irradiation
sensitivity of quartz Al and Ti centers and baking temperature by vol
canic lava flow. The irradiation sensitivity of the Al and Ti–Li centers
increases with the baking temperature, whereas the irradiation sensi
tivity of the Ti–H center increases first (up to ~500 ◦ C) and then de
creases with temperature. The reduction of the Ti–H center sensitivity at
40-0 cm depth may be due to the baking temperature in this depth range
reaching the temperature of the quartz phase transition from α-quartz to
β-quartz (573 ◦ C), causing the [TiO4/H+]0 centers become unstable and
dissociate. In addition, from our experimental results, the ESR intensity
of the Ti center is more strongly dependent on the annealing history of
the samples than the Al center, because there are many potential sources
of H+ and Li+ within the lattice in quartz, including water inclusions, OH
molecules, [H3O4]0 defects and cations associated with the Al or other
centers (Yang and McKeever, 1990). Finally, from the results of the
heating experiment, after heating above 1000 ◦ C, additional irradiation
does not produce new Ti–H signals, this probably indicates that the
paleo-temperature of the lava flow in Yujiazhai area did not exceed
1000 ◦ C.
Declaration of competing interest
The authors declare that they have no known competing financial
interests or personal relationships that could have appeared to influence
the work reported in this paper..
Data availability
Data will be made available on request.
Acknowledgements
This work was supported by the National Natural Science Foundation
of China (Grant No. 42172211), and the basic scientific research fund,
Institute of Geology, China Earthquake Administration (Grant No.
IGCEA1908).
References
Basu, A.R., Wang, J., Huang, W., Xie, G., Tatsumoto, M., 1991. Major element, REE, and
Pb, Nd and Sr isotopic geochemistry of Cenozoic volcanic rocks of eastern China:
implications for their origin from suboceanic-type mantle reservoirs. Earth Planet.
Sci. Lett. 105, 149–169.
Chen, W.J., Li, D.M., Dai, T.M., 1992. K-Ar ages and residual argon of Quaternary basalt
in Datong. In: Liu, R.X. (Ed.), The Age and Geochemistry of Cenozoic Volcanic Rock
in China. Seismological Press, Beijing.
Chen, W.J., Liu, R.X., Sun, J.Z., et al., 1986. Preliminary K-Ar age determination of the
Quaternary basalts in Datong volcanic area. Quat. Sci. 7, 96–102.
8
C.-R. Liu et al.
Radiation Measurements 157 (2022) 106823
Tsukamoto, S., Long, H., Richter, M., Li, Y., King, G.E., He, Z., Yang, L.H., Zhang, J.R.,
Lambert, R., 2018. Quartz natural and laboratory ESR dose response curves: a first
attempt from Chinese loess. Radiat. Meas. 120, 137–142.
Voinchet, P., Falgu`eres, C., Laurent, M., Toyoda, S., Bahain, J.J., Dolo, J.M., 2003.
Artificial optical bleaching of the Aluminium center in quartz implications to ESR
dating of sediments. Quat. Sci. Rev. 22, 1335–1338.
Voinchet, P., Yin, G.M., Falgu`
eres, C., Liu, C.R., Han, F., Sun, X.F., Bahain, J.J., 2013.
ESR dose response of Al center measured in quartz samples from the Yellow River
(China): implications for the dating of Upper Pleistocene sediment. Geochronometria
40, 341–347.
Vyatkin, Koshchug, 2020. Annealing kinetics of Ti- and Ge-related centers in quartz.
Appl. Magn. Reson. 51, 349–362.
Wang, X.S., Løvlie, R., Su, P., 2002. Environmental magnetic records of Nihewan
lacustrine sediments at Xujiayao and their paleoclimatic significance. Quat. Sci. 22,
451–458.
Wei, C.Y., Li, C.A., Liu, C.R., Li, W.P., Zhang, Z.J., Zhang, H.S., Zhao, J.X., Zhang, L.Y.,
2017. Nature ESR signals of quartz E’ center shed new light on river sediments
provenance: a case study in southeast margin of the Tibet Plateau. Quat. Int. 454,
38–44.
Wei, C.Y., Liu, C.R., Li, C.A., Yin, G.M., Zhang, Y.F., Li, W.P., Yu, L.P., 2019. Application
of long time artificial optical bleaching of the E1′ centre to sediment ESR dating.
Geochronometria 46, 79–86.
Weil, J.A., 1984. A review of electron spin spectroscopy and its application to the study
of paramagnetic defects in crystalline quartz. Phys. Chem. Minerals 10, 149–165.
Xu, Y.G., Ma, J.L., Frey, F.A., Feigenson, M.D., Liu, J.F., 2005. Role of lithosphereasthenosphere interaction in the genesis of Quaternary alkali and tholeiitic basalts
from Datong, western North China Craton. Chem. Geol. 224, 247–271.
Yang, X.H., McKeever, S.W.S., 1990. The pre-dose effect in crystalline quartz. J. Phys. D:
Appl. Phys. 23, 237.
Yokoyama, Y., Falgu`eres, C., Quaegebeur, J.P., 1985. ESR dating of quartz from
quaternary sediments: first attempt. Nucl. Tracks 10, 921–928.
Zhang, Y., 1986. Characteristic of petrology of the Datong basalts. Seismol. Geol. 8,
59–67.
Zhao, H., Wang, C.M., Mao, H.L., Lu, Y.C., Liu, L.J., Ji, Y.P., Zhao, H.M., 2012. OSL
dating of volcanic baked sediments in Datong area, Shanxi province of China. Quat.
Sci. 32, 510–515.
Zhao, H., Liu, Z., Wang, C.M., Li, S.H., 2015. Luminescence dating of volcanic eruptions
in Datong, northern China. Quat. Geochronol. 30, 357–362.
Zheng, C.X., Zhou, L.P., Qin, J.T., 2009. Difference in luminescence sensitivity of coarsegrained quartz from deserts of northern China. Radiat. Meas. 44, 534–537.
Zhou, K., Liu, C., Yuan, B., Sun, J., 1982. Preliminary discussion of volcanic stages of
Datong volcano group. Chin. Sci. Bull. 27, 234–236.
Zhu, R.X., Liu, C., Zhu, K.K., 1990. Determination of the paleomagnetic field of Datong
region and its geological significance. J. Grad. Sch. Chin. Acad. Sci. 7, 72–78.
9