Moving averages simplified ( PDFDrive )
Bạn đang xem bản rút gọn của tài liệu. Xem và tải ngay bản đầy đủ của tài liệu tại đây (5.25 MB, 136 trang )
Moving Averages
Simplified
By Clif Droke
MARKETPLACE BOOKS
Columbia, MD
MARKETPLACE BOOKS
Simplified Series
Technical Analysis Simplified by Clif Droke
Elliott Wave Simplified by Clif Droke
Moving Averages Simplified by Clif Droke
Other ground-breaking books in the
Marketplace Books Series:
The Precision Profit Float Indicator:
Powerful Techniques to Exploit Price and Volume
by Steve Woods
Trader’s Guide to Technical Analysis
by C. Colburn Hardy
Commodity Options: Spectacular Options With
Limited Risk by Larry Spears
Trend Forecasting: Unleashing the Hidden Power
of Intermarket Analysis to Beat the Market
by Louis B. Mendelsohn
7 Chart Patterns That Consistently Make Money
by Ed Downs
Trading, Sex, and Dying: The Heart of a Gambler
by Juel E. Anderson
The ARMS Index by Richard Arms, Jr.
The New Market Wizards: Conversations With
America’s Top Traders by Jack D. Schwager
McMillan On Options by Lawrence G. McMillan
The Art of Short Selling by Kathryn Staley
Point and Figure Charting: Essential Applications
for Forecasting and Tracking Market Prices
by Tom Dorsey
The Trader’s Tax Solution: Money Saving Strategies
for the Serious Investor by Ted Tesser
“Nothing distills the essence of supply and
demand like the chart. And nothing distills the
chart quite like the moving average.”
— Clif Droke
Copyright © 2001 by Clif Droke.
Published by Marketplace Books.
All rights reserved.
Charts provided by © BigCharts.com. All rights reserved.
Reproduction or translation of any part of this work beyond that permitted
by Section 107 or 108 of the 1976 United States Copyright Act without
the permission of the copyright owner is unlawful. Requests for permission
or further information should be addressed to the Permissions Department
at Traders’ Library.
This publication is designed to provide accurate and authoritative information in regard to the subject matter covered. It is sold with the understanding that neither the author nor the publisher is engaged in rendering legal,
accounting, or other professional service. If legal advice or other expert
assistance is required, the services of a competent professional person
should be sought.
From a Declaration of Principles jointly adopted by a Committee
of the American Bar Association and a Committee of Publishers.
This book, along with other books, are available at discounts
that make it realistic to provide them as gifts to your
customers, clients and staff. For more information on these
long-lasting, cost-effective premiums, please call John Boyer
at 800-424-4550 or e-mail him at
ISBN 1-883272-66-1
Printed in the United States of America
Contents
Introduction
7
Chapter 1
The Essence of Moving Averages:
What Every Successful Trader Should Know
11
Chapter 2
The Benefits of Using Moving Averages:
Spotting Trend Changes and Trading Signals
17
Chapter 3
Trading With Single Moving Averages:
A Simple Strategy That Works
21
Chapter 4
Trading With Two Moving Averages: What They Are
and How to Use Them for High Impact Results
37
Chapter 5
Using Moving Averages to Identify Price Cycles:
An Important Tool to Discover Profitable Entry Points
51
Chapter 6
Principle of Threeness and Fourness: How Price Cycle
Repetition Creates Opportunities for Traders
59
MOVING AVERAGES SIMPLIFIED
5
Chapter 7
Using Moving Averages to Identify Support and
Resistance Levels: A Key Tool to Capture Tops
and Bottoms
79
Conclusion
87
Appendix A
How to Calculate Moving Averages
91
Glossary
99
Trading Resource Guide
Suggested Reading List
Internet Sites
6
MOVING AVERAGES SIMPLIFIED
123
125
128
Introduction
M
oving averages have long been used by
investors and traders as an aid to analyzing
price trends. Moving averages have the
attribute of being able to smooth price fluctuations,
making it easier to follow underlying trends with
the naked eye. Used in conjunction with other
technical indicators, or even with other averages,
moving averages provide a reliable tool for beating
the market a fair percentage of the time — once
you know how to use them properly.
Used in conjunction with other
technical indicators, or even
with other
averages, moving
averages provide
a reliable tool for
beating the
market a fair
percentage of
the time — once
A growing number of traders are becoming aware
of the tremendous profit potential that comes with
integrating moving averages with a favored trading
system. Books have already been written to teach
the profitable application of moving averages in
trading the markets, yet most fall short of this goal.
One reason for this failing is that a basic working
knowledge of moving averages is already common among countless thousands of traders. As any
good trader knows, once a particular trading system
becomes the common knowledge of the vast multitudes, it tends to lose its utility and reliability. Few
you know how
to use them
properly.
MOVING AVERAGES SIMPLIFIED
7
books on moving averages have gone beyond the
plebeian in their attempts to explain how moving
averages can be used to a trader’s advantage.
It is our philosophy, based on
many years of
study and realtime experience,
Another problem with books that have addressed
this subject is that they frequently err on the side
of complexity. Experienced traders are aware that
the more complex a given trading system is, the
less often it provides useful trading signals. In the
marketplace, as in most of life itself, simplicity is the
essence of success. It is our philosophy, based on
many years of study and real-time experience, that
the more simple a trading method is, the more likely it will prove beneficial to the trader, and we have
kept this principle in mind in producing this book.
that the more
simple a trading
method is, the
more likely it will
prove beneficial
to the trader, and
we have kept
this principle in
mind in producing this book.
One little known and widely overlooked aspect of
moving averages is that they work best when used
in conjunction with cycle analysis. The trader must
have at least a basic understanding of market cycles
in order to consistently use moving average analysis
to his or her advantage. So crucial is cycle theory
to the profitable employment of moving averages
to any form of trading, that we felt compelled to
include two chapters in this book dedicated to cycle
analysis when used in conjunction with moving
averages. Chapter 6, alone, should be worth the
price of this book for the serious trader.
It is not within the scope of this book to focus
exclusively on moving averages with reference to
market cycles; nevertheless, a broad understanding
of this application is necessary and should always
be borne in mind when conducting moving average
analysis. After all, moving averages are, essentially,
8
MOVING AVERAGES SIMPLIFIED
smoothed out pricelines, which highlight the major
trends and cycles that govern the underlying security.
Aside from the cyclical element of moving average
analysis, we also examine the more traditional forms
of moving averages when used in conjunction with
price, volume, and various technical indicators.
The studies
You will find throughout this work a number of
“real-market” charts, supplied by BigCharts.com,
which will greatly add to your understanding and
comprehension of the principles this book aims to
teach. Nothing but experience can ultimately assure
consistent success in the markets, but the studies
and examples included in this book will further
your understanding of how moving averages, once
properly implemented, will greatly enhance your
trading success.
es, once properly
and examples
included in this
book will further
your understanding of how
moving averagimplemented,
will greatly
enhance your
trading success.
MOVING AVERAGES SIMPLIFIED
9
CHAPTER 1
The Essence of Moving Averages:
What Every Successful Trader Should Know
T
he term “moving averages” is widely employed
within the realm of financial analysis, and
almost everyone has a basic comprehension
of what they are and how they are used. Yet few
truly understand the intricacies of moving averages
and the many ways they can be used to maximize
trading profits in the financial markets. A growing
interest among the investing public about moving
averages has spawned a number of books on the
subject in recent years, yet few books, despite their
merit, really come close to providing the essence
of what moving averages are, and how and when
they should be used. To that end, we have written
this book with the hope that it will go far in aiding
the serious trader or investor about the proper way
of incorporating moving averages into his or her
market analysis.
A moving
average is an
indicator that
shows the
average value
of a security’s
price over a
period of time.
What is a moving average? A moving average is an
indicator that shows the average value of a security’s price over a period of time.1 When calculating
a moving average, a mathematical analysis of the
security’s average value over a predetermined time
MOVING AVERAGES SIMPLIFIED
11
period is made. As the security’s price changes, its
average price moves up or down.
When calculating a moving
average, a mathematical analysis
of the security’s
average value
over a predetermined time
period is made.
As the security’s
The five most commonly used types of moving averages are the simple, or arithmetic; the exponential;
the triangular; the variable; and the weighted moving average. Moving averages can be calculated on
any data series, including a security’s open, high,
low, close, volume, or other indicator. A moving
average of another moving average is also commonly used in various forms of technical analysis.2
This technique is used for purposes of tracking the
price momentum of a stock or commodity and is
constructed by averaging the moving average of
the price being followed.
price changes,
its average price
moves up or
down. A buy
signal is generated when the
security’s price
rises above its
moving average,
and a sell signal
is generated
when the
security’s price
falls below its
moving average.
The only significant difference between the various
types of moving averages is the weight assigned to
the most recent price data. Simple moving averages
apply equal weight to the prices. Exponential and
weighted averages apply more weight to recent
prices of the stock or commodity being followed.
Triangular averages apply more weight to prices in
the middle of the time period. And variable moving
averages change the weighted based on the volatility of prices.3
Steven B. Achelis, in his book, Technical Analysis
From A to Z, has written one of the most lucid
explanations of moving averages that we have
read, which we quote from at length:
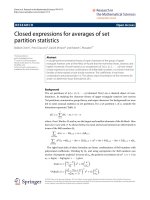
“The most popular method of interpreting a moving average is to compare the relationship between
a moving average of the security’s price with the
12
MOVING AVERAGES SIMPLIFIED
security’s price itself. A buy signal is generated
when the security’s price rises above its moving
average, and a sell signal is generated when the
security’s price falls below its moving average.
➞
sell signal
buy signal
15-month
moving average
Continues Achelis: “This type of moving average
trading system is not intended to get you in at the
exact bottom nor out at the exact top. Rather, it
is designed to keep you in line with the security’s
price trend by buying shortly after the security’s
price bottoms and selling shortly after it tops.
FIGURE 1-1:
Simple Moving
Average
“The critical element in a moving average is the
number of time periods used in calculating the average. When using hindsight, you can always find a
moving average that would have been profitable....
The key is to find a moving average that will be consistently profitable. The most popular moving average is the 39-week (or 200-day) moving average.
Note the buy and
This monthly S&P
500 bar chart illustrates a 15-month
moving average.
sell signals generated as the price
moved above and
below the moving
average line.
MOVING AVERAGES SIMPLIFIED
13
This moving average has an excellent track record in
timing the major (long-term) market cycles.
“The length of a moving average should fit the
market cycle you wish to follow. For example, if you
determine that a security has a 40-day peak-to-peak
cycle, the ideal moving average length would be 21
days calculated using the following formula:
Ideal Moving Average Length = Cycle Length + 1
_________________
2
In this book, we
will concentrate
primarily on
price-only simple
moving averages
of short-term
and intermediate-term time
frames.
Continues Achelis: “Moving averages can also be
calculated and plotted on indicators. The interpretation of an indicator’s moving average is similar to
the interpretation of a security’s moving average:
When the indicator rises above its moving average,
it signifies a continued upward movement by the
indicator; when the indicator falls below its moving
average, it signifies a continued downward movement by the indicator.”4
Indeed, many and varied are the uses for moving
averages, whether used on prices or technical indicators of prices. In this book, we will concentrate
primarily on price-only simple moving averages of
short-term and intermediate-term time frames.
Moving Average Time Frames
Trend
Very Short Term
Short Term
Minor Intermediate
Intermediate
Long Term
14
MOVING AVERAGES SIMPLIFIED
Moving Average
5-13 days
14-25 days
26-49 days
50-100 days
100-200 days
_______________
NOTES
1 Achelis, Steven, Technical Analysis From A to Z, McGraw
Hill, 1996, pg. 184
2 Ibid, pg. 184
3 Ibid, pg. 184
4 Ibid, pgs. 184-186
MOVING AVERAGES SIMPLIFIED
15
CHAPTER 2
The Benefits of Using
Moving Averages:
Spotting Trend Changes and Trading Signals
P
rice movements of all actively traded securities are a measure of volatility and therefore
take on the appearance of being very erratic.
To the untrained eye, the price chart of any given
security resembles an indecipherable mess of squiggly lines with little meaning. Even to an experienced chart analyst price fluctuations can be very
misleading. What is called for in order to eliminate
these wild undulations and to enable the analyst to
identify the underlying trend is a smoothing device,
something to reduce the undulations and isolate
the overall movement of prices. This is the function
best served by moving averages.
The moving
average is a
smoothing
device — something to reduce
the undulations
and isolate the
overall movement of prices—
which enables an
analyst to identify the underlying
trend.
All averages of prices tend to fluctuate less actively
than the prices from which they are derived: the
greater the number of days from which an average
is composed, the more gentle and gradual are the
fluctuations relative to the price action from which
it is derived.1
MOVING AVERAGES SIMPLIFIED
17
The moving average is one of the
most versatile
and widely used
of all technical indicators.
Because of the
way it is constructed and
the fact that it
can be so easily quantified
and tested, it
is the basis for
most mechanical
trend-following
systems in use
today.
In his book, Commodity Futures Trading With
Moving Averages, J.R. Maxwell provides a succinct account of the usefulness of moving averages
when incorporated in a trading program: “The use
of an average eliminates or reduces the distraction
caused by the often sudden and relatively far-reaching daily price fluctuations, enabling the user to
observe a smoother depiction of the trend changes
as they occur. This is one of the two principal reasons for the widespread use of various types of
averages as trading tools.
“The second principal reason is that these figures,
when plotted as lines on charts, with the closing
prices or other lines representing price action, will
cross above and below one another as market
trends change. Two averages encompassing different numbers of price units (days) will cross over and
under each other in the same fashion. Such crossings, either by themselves, or in combination with
other signals, such as changes in statistical data
concerning supply and demand, serve as trading
signals for a large proportion of the people who
speculate in the futures markets.
“These crossings are definite, easily observed signals in a fast-moving and frequently very confusing
swirl of activity. Clear-cut signs, such as these are,
to buy and to sell, can be comforting to have under
such conditions, especially when they appear to
be well accepted by so many traders, and their use
seems to be based upon solid logic.”2
The different forms of analysis involving moving
averages are many and varied. Many traders place
18
MOVING AVERAGES SIMPLIFIED
heavy emphasis on the trading signals provided
when two moving averages of the underlying security’s priceline cross. Others rely on a system involving a moving average or series of moving averages
calculated from a moving average itself in relation
to the underlying security’s price to generate trading signals. Others still prefer to rely simply on a
single moving average, which is plotted with the
priceline. The results they obtain trading with these
signals vary depending on the time frame of the
averages used along with a variety of other factors.
When used
properly and
carefully tested,
moving averages can act as a
tool — generating
trading signals —
that confirm and
Concludes Maxwell: “A moving average is like
any tool. It is essential to know its capabilities and
its limitations before its potential value can be
determined. Then, if it has any merit, skill may be
required to obtain the maximum benefit from its
use.”3 (For a more detailed discussion of moving
average crossovers, please see Chapter 4.)
forecast turning
points in market
trends.
_______________
NOTES
1 Maxwell, J.R., Commodity Futures Trading With Moving
Averages, Speer Books, 1976, pg. 5
2 Ibid, pgs. 5-6
3 Ibid, pg. 6
MOVING AVERAGES SIMPLIFIED
19
CHAPTER 3
Trading With Single Moving Averages:
A Simple Strategy That Works
O
ne of the most basic, yet proven, techniques
for using moving averages as a trading tool
is the single moving average method. This
trading method involves nothing more than a single,
simple moving average of any given length (but pre
ferably suited to the contract and time frame being
traded) and its relation to the underlying contract’s
price. Entry and exit signals for trading are provided
by how the priceline trades in relation to the moving average — whether above it or below it. Notice
should also be given as to whether or not the
moving average is rising or falling relative to the
priceline.
Stan Weinstein, editor of the highly regarded Pro
fessional Tape Reader, is especially noted for his use
of this technique. In his book, Secrets for Profiting
in Bull and Bear Markets, he reveals his preferred
method of using moving averages as a timing tool:
The single
moving average
method involves
nothing more
than a single,
simple moving
average of any
given length —
preferably suited
to the contract
and time frame
being traded —
and its relation
to the underlying
contract’s price.
“A very important technical tool that helps alert
you to both shorter- and longer-term moves [is the
moving average]. All that a moving average really
MOVING AVERAGES SIMPLIFIED
21
In the pages
that follow, we
provide several
examples of the
use of the simple
30-week and
30-day moving
averages using
Weinstein’s technique for entry
and exit. The
30-day moving
average is the
best for shortterm trading,
since it provides
faster signals.
The 30-week
moving average
is the best for
long-term investors because a
does is smooth out the major trend so the wild
day-to-day gyrations — which the new buying and
selling programs have made even wilder — do not
throw off your market perspective. Over the years,
I’ve found that a 30-week moving average (MA)
is the best one for long-term investors, while the
10-week MA is best for traders to use. A 30-week
MA is simply the closing price for this Friday night
added to the prior 29 Friday weekly closings. Divide
that figure by 30 and the answer is what’s plotted on this week’s chart.1 Stocks trading beneath
their 30-week MAs should never be considered for
purchase, especially if the MA is declining. Stocks
trading above their 30-week MAs should never be
considered for short selling, especially if the MA is
rising. For a long-term investor, the ideal time to
buy a stock is when it breaks out above resistance
and also moves above its 30-week MA, which must
no longer be declining. For a trader who wants
action, the ideal time to buy a stock is when it’s
already above its 30-week MA, when the MA is
rising. The trader’s ideal entry point is after a stock
consolidates in a new trading range and pulls back
close to the moving average, then breaks out again
above resistance.”2
greater amount
of price and
volume information is contained
within the chart.
22
Weinstein gives preference to the 50-day (or
10-week) moving average in his analysis of the
intermediate cycle, but we prefer the 30-day moving average for short-term trading since it provides
faster signals. In the pages that follow, we provide
several examples of the use of the simple 30-day
and 30-week moving averages using Weinstein’s
technique for entry and exit.
MOVING AVERAGES SIMPLIFIED
2
A
C
30-day
moving average
3
B
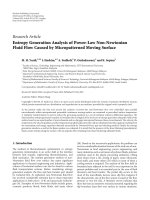
A, B, C, D = buy signals
1, 2, 3 = sell signals
Figure 3-1.
➞
1
D
Microsoft (MSFT)
A fine example of a daily chart with a 30-day moving average is Microsoft. Here, the moving average
gave decisive buy signals in April, July and Decem
ber 1999, and in June 2000. Clear-cut sell signals
were flashed in May 1999, January 2000, and July
2000. Pay close attention to how the moving average line behaved relative to the priceline at each
of these points. Note that before a decisive buy
signal is given, the moving average must be in tran
sition from falling to rising, which typically produces
a small bowl-shaped formation. This is a strong
signal that the short-term cycle has bottomed and
that prices will be carried higher. Remember, too,
that for a moving average to give a buy signal it
must be in an overall rising position, and the priceline should be above the average. The reverse is
true for a sell signal.
FIGURE 3-1:
Daily chart with
30-day moving
average.
falling
rising
In order for a deci
sive buy signal to be
given, the moving
average must be in
transition from falling
to rising, which
typically produces a
small bowl-shaped
formation.
MOVING AVERAGES SIMPLIFIED
23
Figure 3-2.
IBM (IBM)
IBM’s daily chart with 30-day moving average demonstrates nicely the utility of the MA trading system. Note the buy signals given between April and
May 1999 as well as in December 1999, along with
sell signals in February 1999, August-September
1999, and February 2000. After the sell signal in
February 2000, IBM proceeded to fluctuate rather
violently between $100 and $128. However, when
the priceline gets too far ahead of the moving average, it is a good idea to ignore the buy signal until
prices get back in line with the average and a relative
balance has been achieved, and a decisive breakout
is made in either direction. This buy signal was given
August 2000 near $110. Note how the moving
average acted to contain the priceline and provided
strong support at this area. When this happens it is
an emphatic indication that prices are going higher.
The next sell signal was flashed a month later in
FIGURE 3-2:
Daily chart with
30-day moving
average.
2
4
3
➞
1
A
24
30-day
moving
average
C
B
MOVING AVERAGES SIMPLIFIED
A, B, C = buy signals
1, 2, 3, 4 = sell signals