Development of a research reactor protocol for neutron multiplication measurements
Bạn đang xem bản rút gọn của tài liệu. Xem và tải ngay bản đầy đủ của tài liệu tại đây (4.23 MB, 20 trang )
Progress in Nuclear Energy 106 (2018) 120–139
Contents lists available at ScienceDirect
Progress in Nuclear Energy
journal homepage: www.elsevier.com/locate/pnucene
Development of a research reactor protocol for neutron multiplication
measurements
T
Jennifer Arthura,b,∗, Rian Bahrana, Jesson Hutchinsona, Avneet Sooda, Nicholas Thompsona,
Sara A. Pozzib
a
b
Los Alamos National Laboratory, Los Alamos, NM 87545, United States
University of Michigan Department of Nuclear Engineering and Radiological Sciences, Ann Arbor, MI 48109, United States
A R T I C LE I N FO
A B S T R A C T
Keywords:
Research reactor
Neutron multiplicity
Monte carlo simulations
Protocol
A new series of subcritical measurements has been conducted at the zero-power Walthousen Reactor Critical
Facility (RCF) at Rensselaer Polytechnic Institute (RPI) using a 3He neutron multiplicity detector. The Critical
and Subcritical 0-Power Experiment at Rensselaer (CaSPER) campaign establishes a protocol for advanced
subcritical neutron multiplication measurements involving research reactors for validation of neutron multiplication inference techniques, Monte Carlo codes, and associated nuclear data. There has been increased attention and expanded efforts related to subcritical measurements and analyses, and this work provides yet
another data set at known reactivity states that can be used in the validation of state-of-the-art Monte Carlo
computer simulation tools. The diverse (mass, spatial, spectral) subcritical measurement configurations have
been analyzed to produce parameters of interest such as singles rates, doubles rates, and leakage multiplication.
MCNP®6.2 was used to simulate the experiment and the resulting simulated data has been compared to the
measured results. Comparison of the simulated and measured observables (singles rates, doubles rates, and
leakage multiplication) show good agreement. This work builds upon the previous years of collaborative subcritical experiments and outlines a protocol for future subcritical neutron multiplication inference and subcriticality monitoring measurements on pool-type reactor systems.
1. Introduction
Subcritical measurements have been continually performed since
the 1940s. The results of these experiments have provided data used for
simulations of special nuclear material (SNM) systems in the fields of
nuclear nonproliferation, safeguards, and criticality safety.
Improvements in nuclear detection instrumentation and SNM availability in the 1950s and 1960s lead to increased research activity in
both the theory and practice of multiplication and reactivity measurements. Multiplication is an extremely important parameter in SNM
systems, as it can give information about the type, enrichment, and risk
level of the SNM being investigated for nuclear security reasons. In
addition, for criticality safety purposes, it is extremely important to be
able to accurately predict the multiplication of systems for various
processes and experiments. Multiplication inference measurements take
advantage of the fact that neutrons emitted during fission are correlated
in time and can be used to gain knowledge about the system being
measured.
Multiplying system parameters of interest include leakage
∗
multiplication ML , total multiplication MT , the multiplication factor
ke f f , and the prompt multiplication factor kp . ML represents the number
of neutrons escaping a system for every neutron injected into the
system, while MT represents the number of prompt neutrons created on
average by a single neutron in the multiplying system. ke f f is a measure
of the ratio of the total number of neutrons in the current generation to
the total number of neutrons in the previous generation. kp is similar to
ke f f , except that it only takes into account prompt neutrons. These
parameters are sensitive to the distribution of the number of neutrons
emitted per fission. Simulation capabilities were historically developed
alongside the measurements for comparison purposes. Comparisons
between neutron multiplication measurements and simulations are
used to validate multiplication inference techniques and radiation
particle transport codes, and to identify and correct deficiencies in
underlying nuclear data quantities such as ν (average number of neutrons emitted per fission) (Arthur et al., 2016; Bahran et al., 2014a;
Sood et al., 2014; Bolding and Solomon, 2013; Miller et al., 2010;
Mattingly, 2009; Bahran et al., 2014b). Most notably, recent (1990s and
2000s) methods of obtaining list mode data (time stamps of neutron
Corresponding author. Los Alamos National Laboratory, Los Alamos, NM 87545, United States.
E-mail address: (J. Arthur).
/>Received 21 September 2017; Received in revised form 22 February 2018; Accepted 24 February 2018
Available online 20 March 2018
0149-1970/ © 2018 The Author(s). Published by Elsevier Ltd. This is an open access article under the CC BY-NC-ND license ( />
Progress in Nuclear Energy 106 (2018) 120–139
J. Arthur et al.
core without the disadvantage of possible radiation damage to the detector system electronics or materials. Additionally, the detector system
is much less likely to be overwhelmed in the relatively lower neutron
flux of a 0-power reactor. Due to the absence of noticeable burnup, the
fuel inside a 0-power reactor is typically very well characterized as
compared to fuel from reactors with significant burnup. The fuel rods
also do not become distorted (i.e. cracking, swelling, or melting) from
burnup while residing in a 0-power reactor (distortion occurs when the
heat from fission reactions causes the fuel to melt and fuse into distorted geometries). In addition to changing the fuel composition and
geometry, the high burnup of some research reactors can preclude entering the core for direct manipulation of experiment equipment. Due to
the buildup of fission products, the gamma ray flux inside the reactor
core can become quite significant. Although 3He tubes are relatively
insensitive to gamma rays, a large flux may significantly increase the
noise signal even in 3He detectors (Trahan, 2016). Specific to a 0-power
pin-type reactor, the symmetry of typical fuel rod arrangement (rather
than the fuel plates used within some reactors) is beneficial to neutron
multiplicity measurements. A 0-power reactor best matches the criterion in neutron multiplicity measurements of understanding the dimensions and components of the system to be measured as well as
possible.
events registered in a detector) from both measurements and simulations have also been developed and allow for a more detailed comparison between the two (Hutchinson et al., 2016).
More recently, there has been significant progress on the design and
execution of benchmark quality subcritical neutron multiplication
measurements for radiation transport code and nuclear data validation.
The majority of these experiments have involved a 4.5 kg alpha-phase
plutonium sphere (BeRP ball) surrounded by copper (Bahran and
Hutchinson, 2016), tungsten (Richard and Hutchinson, 2016), and
nickel (Richard and Hutchinson, 2014). Evaluations of the nickel and
tungsten measurements have both been accepted into the International
Criticality Safety Benchmark Evaluation Project (ICSBEP) Handbook
(Briggs et al., 2014). The ICSBEP handbook contains hundreds of
benchmark quality critical and subcritical measurement evaluations.
The purpose of the handbook is to provide benchmark quality data that
can be used for validation and improvement of nuclear databases and
radiation transport codes. The nickel benchmark was the first ICSBEPaccepted evaluation of measurements analyzed with the Hage-Cifarelli
formalism based on the Feynman Variance-to-Mean method (Cifarelli
and Hage, 1986), and was the culmination of many years of collaborative subcritical experiment research (Arthur et al., 2016; Bahran
et al., 2014a; Sood et al., 2014; Bolding and Solomon, 2013; Miller
et al., 2010; Mattingly, 2009; Hutchinson et al., 2016; Richard and
Hutchinson, 2014, 2016; Hutchinson et al., 2013a, 2013b, 2014,
2015a). Although the state-of-the-art has been advancing throughout
the years, benchmark measurements have only been done with simple
SNM geometries. There is no protocol on how to best perform, and what
can be learned from, measurements on increasingly complex reactor
systems, such as zero-power pin-type pool research reactors. Furthermore, these types of measurements can also inform protocol for future
subcriticality monitoring measurements on accelerator driven reactor
systems (Dulla et al., 2014; Chabod et al., 2014; Uyttenhove et al.,
2014).
2.2. Correlated neutron detection
Correlated neutron detection involves detecting fission neutrons
that are correlated in time, energy, angle, and number. The time of
emission, kinetic energy, directional angle of emission, and number of
emitted neutrons are all dependent upon each other in a true fission
reaction (Wagemans, 1991). Multiplying system parameters of interest
in correlated neutron benchmark measurements include the singles rate
R1, the doubles rate R2 , and the leakage multiplication ML . The “singles”
rate is defined as the rate of detection of single neutrons from a fission
chain. The “doubles” rate is defined as the rate of detection of two
neutrons from the same fission chain. ML represents the average
number of neutrons that would escape the system following the introduction of a single neutron to the system. The following sub-sections
outline how the parameters of interest are obtained from raw measured
and simulated data.
2. Establishing a research reactor protocol
The Critical and Subcritical 0-Power Experiment at Rensselaer
(CaSPER) measurement campaign was designed to establish a protocol
for neutron multiplicity measurements on research reactors as the next
step in advanced subcritical neutron multiplication inference measurements. Such measurements can help identify deficiencies and
quantify uncertainties in nuclear data, as well as validate predictive
radiation transport simulation capabilities related to subcritical neutron
multiplication inference techniques. CaSPER includes integral experimental configurations at different achieved reactivity states which have
been measured at the Walthousen Reactor Critical Facility (RCF)
(Thompson et al., 2015) at Rensselaer Polytechnic Institute (RPI). The
RCF achieves different reactivity states by varying the control rod (CR)
and water height in the reactor core. It is a benefit that the system is
able to reach a wide range of multiplication states, by using both fine
and coarse reactivity control in the form of CR and water height, respectively. It is also useful to know the possible reactivity states ahead
of time, through the use of reactivity worth curves. The diversity of the
CaSPER configurations are unique in contrast to previous subcritical
benchmark measurements in that they are the first neutron multiplication inference measurements on a zero-power pool-type reactor
which offers spatial complexity, different materials (fuel, moderator,
CR material, etc.) and system-specific neutron cross-section sensitivities
(various energy ranges and neutron reaction contributions).
2.2.1. Measured data processing
Neutron multiplicity measurements record list-mode data, which
consists only of the time of neutron detection and the tube in which the
detection occurred. In this work, the 3He detector system records only
these two pieces of information. The list-mode data can be used for
many different types of multiplicity analysis methods; for this work the
data was analyzed with the Hage-Cifarelli formalism based on the
Feynman Variance-to-Mean method. The list-mode data were binned
into Feynman histograms according to specified time widths using the
data processing tool Momentum (Smith-Nelson, 2015). A Feynman
histogram is a representation of the relative frequencies of various
multiplets (i.e., 1 event, 2 events, etc.) occurring within the specified
time width, as shown in Fig. 1.
The magnitude of the nth bin of the Feynman histogram at the
specified time width τ is represented by the variable Cn (τ ) in Equation
(1). Standard multiplicity equations, in the form of Equations (1)–(9)
(Hutchinson et al., 2015b), are applied to calculate the singles (R1) and
doubles (R2 ) rates, as well as the leakage multiplication (ML ). Equation
(6) is a specific form of Equation (5) when the subscript is 2, which is
needed to calculate the doubles rate. Equations for the uncertainties in
R1, R2 , and ML can be found in reference (Hutchinson et al., 2015b). In
the following equations, the symbols λ, ε, νIi and νsi represent the
prompt neutron decay constant, detector absolute efficiency, ith moment of the induced fission multiplicity distribution, and ith moment of
the spontaneous fission multiplicity distribution, respectively. mr (τ ) is
the r th factorial moment of the Feynman histogram. Y2 is directly
2.1. Measurements at 0-power reactor
Nominally, a 0-power reactor is the ideal type of pool-type reactor
for conducting neutron multiplicity measurements. A substantial benefit of a 0-power reactor is the ability to directly adjust fuel rods as
desired. The detector system can be placed in close proximity to the
121
Progress in Nuclear Energy 106 (2018) 120–139
J. Arthur et al.
Fig. 1. The binning method used to generate Feynman histograms in this work.
proportional to the Feynman Y value, which is a measure of the deviation of the histogram from a Poisson distribution. The prompt neutron decay constant can be obtained by fitting the curve of Y2 versus
time width to the form of Equation (6). The most commonly used units
in this work for many of the variables presented in this section are listed
in Table 1.
pn (τ ) =
Cn (τ )
∞
∑n = 0 Cn (τ )
Table 1
Most commonly used units for many of the variables used in
this work for correlated neutron detection.
(1)
∞
mr (τ ) =
R1 (τ ) =
m1 (τ )
τ
(2)
μ−1
ωμ (λ, τ ) =
∑
K =0
ω2 (λ, τ ) = 1 −
R2 (τ ) =
ML =
C1 =
−C2 +
(13)
1 − e−λτ
λτ
(6)
Rossi data is a histogram of time differences between events in the
list-mode data, as shown in Fig. 2. The decay constant (Rossi-alpha
value) is obtained from a fit of the Rossi data versus time to Equation
(14). The prompt neutron decay constant λ in Equation (14) is traditionally represented as α, but in this work λ is being used to represent
the prompt neutron decay constant. The first term of Equation (14) is
the constant background of uncorrelated counts, while the second term
includes all correlated counts. A, B, and Δ are the coefficient of the
uncorrelated count contribution, the coefficient of the correlated count
contribution, and an infinitesimal time window, respectively. Type I
binning is used in this work, although other methods of Rossi binning
exist (McKenzie, 2014; Hansen et al., 1968; Degweker and Rudra,
2016).
(7)
C22 − 4C1 C3
(8)
(9)
2.2.2. Simulated data processing
Simulated results are produced by processing simulated list-mode
files in the same way as measured list-mode files are processed.
Simulated list-mode files are created by pulling the necessary information from the PTRAC output file of MCNP®6.21 (Goorley et al.,
2012). The PTRAC file contains information about all particle interactions that occurred during the MCNP simulation. In order to produce
list-mode data the MCNP input file must be run in analog mode, such
that the weights of all particles are always unity. Using a script from the
MCNPtools package (Solomon, 2014), the time and detector of interaction corresponding to each event is pulled from the PTRAC file and
input into a list-mode data file containing only those two pieces of
Equations (8) and (9) are true only if the (α, n) neutron emission
rate from the fission source is assumed to be negligible. Theoretically,
this would be the case in a system consisting of only a252Cf starter
source and low-enriched uranium fuel. However, the large contribution
to the measured signal from the RCF PuBe source (roughly 1E7 n in
s
strength) above the core renders this assumption inaccurate. Equations
(10)–(13) are used instead of the previous equations when the (α, n)
neutron contribution is not negligible. These equations also assume that
the (α, n) source and the fission source are coincident point sources;
i.e., a small sample of uranium or plutonium oxide. Therefore, they are
also not completely valid for this work. Appendix B details the method
that was used to calculate ML .
R1 = ε [b11 Fs + b12 Sα ]
R2 =
ε 2 [b
21 Fs
+ b22 Sα ]
s−1
unitless
unitless
M −1
M −1
b21 = ML2 ⎡νs2 + L
νs1 νI 2 ⎤ b22 = ML2 L
νI 2
⎢
⎥
νI 1 − 1
νI 1 − 1
⎣
⎦
(5)
R (τ ) νs1
νs1 νI 2
ν ν
, C2 = νs2 − s1 I 2 , C3 = − 2
νI 1 − 1
νI 1 − 1
R1 (τ ) ε
s−1
s−1
(4)
−λτK
⎛ μ − 1⎟⎞ (−1) K 1 − e
λτK
⎝ K ⎠
2C1
R2 (τ )
λ
(12)
⎜
Y2 (τ )
ω2 (λ, τ )
s
# of occurrences
b11 = ML νs1 b12 = ML
m2 (τ ) − 2 [m1 (τ )]2
τ
τ
Cn (τ )
R1 (τ )
(3)
1
Y2 (τ ) =
Units
ε
ML
∑n = 0 n (n − 1)…(n − r + 1) pn (τ )
r!
Variable
(10)
1
MCNP® and Monte Carlo N-Particle® are registered trademarks owned by Los Alamos
National Security, LLC, manager and operator of Los Alamos National Laboratory.
(11)
122
Progress in Nuclear Energy 106 (2018) 120–139
J. Arthur et al.
Fig. 2. The time differences between events used to generate Rossi data.
P (t )Δ = AΔ + Be−λt Δ
(14)
information. Finally, the list-mode data are converted into the correct
format to be processed by Momentum, alongside measured data, using
a PERL script (Temple, 2009).
3. Experiment
3.1. Experiment design
The CaSPER measurements at the RPI-RCF were designed to include
distinct configurations at various reactivity states ranging from subcritical to above delayed critical. Nine different configurations were
achieved by varying the control rod and water height in the reactor
core. The RCF core has low-enriched uranium (LEU) fuel in the form of
SPERT-type F-1 fuel pins at an enrichment level of 4.81% U-235 by
weight (Thompson et al., 2015). Fuel pins are encased in stainless steel
cladding and boron-impregnated iron rods serve as CR's. When the tank
is filled the water serves as a moderator. The large water tank containing the core is large enough to accommodate a sizable detector
system(s), including the standard Los Alamos National Laboratory
(LANL) 3He portable neutron multiplicity detector systems which were
retrofitted for water submersion.
The detector system used in CaSPER is the LANL Neutron
Multiplicity 3He Array Detector (NoMAD), which is a slightly modified
version of the state-of-the-art MC-15 neutron multiplicity counter (Moss
et al., 2016), and the state-of-the-art detection system for obtaining listmode data from highly multiplying systems. The NoMAD consists of 15
3
He tubes encased in polyethylene moderator. The thickness of moderator between each tube is optimized for detection efficiency. The
overall size and number of tubes contained in the detector system was
chosen as a trade-off between increasing efficiency and decreasing
portability. Every 3He tube has a pressure of 150 psia (10.13 bars) and
active dimensions of 0.97 × 15 in. (2.46 × 38.1 cm). The counter's fill
gas is a mixture of 3He with 2% CO2 as a quench gas (in atomic proportion). A removable cadmium shield can be placed on the front of the
NoMAD to preferentially capture thermal neutrons and is often used to
reduce contributions from neutrons that scatter from the environment
surrounding fast multiplying systems. Because the neutrons inside a
water-moderated reactor are predominantly thermal, the removable
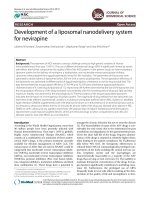
cadmium shield was not utilized for the CaSPER measurements. Representations of the NoMAD geometry, produced using the CAD software Solidworks® and the MCNP plotter, are shown in Fig. 3. In order to
protect the NoMAD during submersion under water and to hold it in
place, 1 in. thick aluminum housing and ratchet straps were used.
16
A photograph from the measurement campaign is shown in Fig. 4.
This photo shows 2 NoMAD systems, although only a single system was
used for these measurements. In addition, the aluminum housing and
ratchet straps are not shown. The distance between the 252Cf source,
located at the center of the core in place of the center fuel pin, and the
NoMAD is 48.5 cm. The vertical center of the NoMAD is level with the
vertical center of the core. The 252Cf source information is given in
Table 2. Both the initial assay activity and the calculated activity at the
Fig. 3. MCNP plotter and CAD representations of the NoMAD geometry.
123
Progress in Nuclear Energy 106 (2018) 120–139
J. Arthur et al.
time of the CaSPER campaign are shown.
During the design phase of the experiment, the MCNP model did not
include the RCF PuBe source in its above-core shielding, as it was expected that its contribution would be negligible. Simulations were run
with different 252Cf source-detector distances, source strengths, and
water and CR heights, with the goal of optimizing both the detector
system count rates and the goodness of the doubles fits (quantified by
the χ 2 value). The optimum count rate was considered to be between
1E3 and 1E5 s−1, which represents a balance between the need for good
statistical uncertainties and detector limitations. Based on these criteria
it was determined that the optimized CaSPER configuration consisted of
the NoMAD detector system at a distance of 35 cm from the center of
the RCF core, with the 252Cf source replacing the center fuel pin, and
varying water and CR heights. However, the layout of the RCF core
added some physical restrictions, and the NoMAD distance was changed
to 48.5 cm. A parametric study was conducted to determine if the RPIRCF water tank size would allow for placement of the NoMAD outside
of the tank. The position of the NoMAD in the CaSPER MCNP model, at
a water height of 67 in. and control rods fully withdrawn, was changed
from inside the reactor core tank, to just outside the tank. The tank
radius in the MCNP model was then set to be 30, 40, and 50 cm, while
keeping the NoMAD position to be just outside the tank. Count rates
were obtained at these distances and an exponential fit was used to
extrapolate the data out to a tank radius of 100 cm. Extrapolation of a
fit was used to generate the data at 60–100 cm because of the extensive
computation time that would have been required to obtain simulated
data at those tank radii. Equation (15) shows the exponential fit, and all
results are listed in Table 3. An exponential fit was used both because
exponential attenuation of neutrons in the water is expected to out1
weight the reduction in flux due to the
reduction in solid angle,
distance 2
and because an exponential fit followed the data trend well.
Fig. 4. Photograph of the CaSPER measurement campaign at the RPI-RCF with the water
drained from the core tank.
Table 2
252
Cf source information.
Date
6/1/2006
7/25/2016
Activity (Bq)
Strength (n/s)
1.54E7 ( ± 5.6%)
1.79E6
1.07E6
1.25E5
Table 3
NoMAD count rate as a function of reactor core tank radius. The date
for radii of 30–50 cm are from simulations, while the data for radii of
60–100 cm are from the extrapolated fit of the simulated data.
Tank radius (cm)
Singles rate (s−1)
30
40
50
60
70
80
90
100
3.27E+05
4.33E+04
8.13E+03
1.21E+03
1.90E+02
2.99E+01
4.70E+00
7.39E-01
y = 8∗107e−0.185x
(15)
Because the results of the parametric study indicate that the RCF
water tank is too large for a high enough neutron signal to be obtained
from outside of the tank, this detector system placement was not investigated further. The final experiment design included Monte Carlo
simulations of the full system: neutron multiplicity detector, 252Cf
source which was included to increase the number of fissions and associated count rate for statistical adequacy, the PuBe starter source that
is always located in a shielding container above the core, and the reactor configuration (fuel/rods/water). Ratchet straps were not included
in the model because it was assumed they would have negligible impact
Fig. 5. MCNP plotter representation of the CaSPER geometry as seen from above and the side. The 252Cf source is located in the center of the fuel region and the CR numbers are shown.
The light blue lines show the water level in relation to the NoMAD at 24 in., 30 in., 36 in., and 44 in. water height. (For interpretation of the references to colour in this figure legend, the
reader is referred to the Web version of this article.)
124
Progress in Nuclear Energy 106 (2018) 120–139
J. Arthur et al.
on the observables of interest. The standard simulation model is shown
in Fig. 5. The PuBe source spectrum used in the model was taken from
Anderson and Neff (1972).
Table 4
Completed measurement configurations.
Configuration #
Water
height
CR3
height
CR4
height
CR5
height
CR7
height
Intended
reactivity
1
2
3
4
5
6
7
8
24
30
36
44
67
67
67
67
in.
in.
in.
in.
in.
in.
in.
in.
36 in.
36 in.
36 in.
36 in.
0 in.
16 in.
20 in.
25 in.
36 in.
36 in.
36 in.
36 in.
0 in.
16 in.
20 in.
25 in.
36 in.
36 in.
36 in.
36 in.
0 in.
16 in.
20 in.
25 in.
36 in.
36 in.
36 in.
36 in.
0 in.
16 in.
20 in.
25 in.
9
67 in.
36 in.
36 in.
21 in.
21 in.
–
–
–
–
–
-$1.00
-$0.50
Delayed
critical
Delayed
critical
3.2. Experiment execution
The RCF core configuration at the time of the CaSPER experiment
was an octagonal lattice of 332 fuel pins, separated by a pitch of
1.63 cm. The center 333rd fuel pin was removed and the 252Cf source
was put in its place. The CR height can vary from 0 in., full insertion, to
36 in., full removal. During reactor operations in which the CR height is
above 0 in., the water height is allowed vary between 19.5 in. and 67
in. The equipment used in the measurements includes the NoMAD detector, along with the aluminum housing and aluminum stands used to
keep the detector water tight and in position within the tank, as well as
lead bricks strapped to the bottom of the NoMAD housing to prevent
Fig. 6. Normalized count rates per 3He tube for configurations 1–4.
125
Progress in Nuclear Energy 106 (2018) 120–139
J. Arthur et al.
Fig. 7. Normalized count rates per 3He tube for configurations 5–9.
126
Progress in Nuclear Energy 106 (2018) 120–139
J. Arthur et al.
Table 5
FOM values for simulated and measured count rates
per detector tube comparisons.
Configuration
FOM
1
2
3
4
5
6
7
8
9
69876
79135
66822
5717
3109
645
533
944
1094
Fig. 8. Row ratio vs. water height.
flotation. A summary of the completed measurement configurations,
excluding efficiency measurements, is presented in Table 4. The completed efficiency measurements, the purpose of which are to calculate
absolute detector efficiency by taking the ratio of the detected count
rate to the 252Cf source strength in a non-multiplying system, are
identical to the configurations listed in Table 4 but with all of the fuel
pins removed from the core.
Using the method presented in Equations (1)–(9), efficiency is required to calculate leakage multiplication. Ideally efficiency would
have been calculated from the no-fuel “efficiency measurements” in
which no fission is occurring and therefore the true absolute efficiency
is measured. However, due to the large contribution of the above-core
RCF PuBe starter source to the measured signal, this method is no
longer valid. Several different possible methods were investigated and
rejected, including taking a measurement of the CaSPER 252Cf source at
a 48.5 cm source-detector distance (the same distance as in the actual
CaSPER measurements) to determine efficiency, and defining the ratio
of the singles rate with fuel to the rate without fuel as ML . The method
that was chosen is explained in Appendix B.
Fig. 9. Feynman histograms for various water heights.
The variances of the ith bins in the simulated and experimental data are
represented by σ 2 (Si ) and σ 2 (Ei ) , respectively. The ideal FOM value is 1,
representing a deviation between simulated and experimental histogram results that is equal to the combined uncertainties.
4. Results
FOM =
The measured data are a novel set of subcritical neutron multiplicity
data that involves new and more complex spatial, material, and energy
regimes. Normalized count rates per detector tube are plotted in Figs. 6
and 7 for each completed measurement configuration. These data show
the normalized count rate observed in each of the 15 3He tubes that
make up the NoMAD detection system. Simulated results are also
plotted for comparison, and figure of merit (FOM) values quantifying
the deviations are listed in Table 5. The values are calculated according
to Equation (16) (Bolding, 2013). In Equation (16), N represents the
total number of bins in the histogram. Si and Ei are the values of the ith
normalized bins in the simulated and experimental data, respectively.
1
N−1
N
(S − E )2
∑ σ 2 (S i) + σi2 (E )
i=1
i
i
(16)
From visual inspection, it is clear that there is generally good
agreement between simulated and experimental normalized count rates
per 3He tube. According to the FOM values, best agreement (defined as
a FOM value closer to unity) is shown for the highest water height
configurations, namely configurations 6–9 (67 in.). This effect is most
likely due to the fact that these configurations are less affected by the
PuBe source, because of the water shielding neutrons from the PuBe
source as well as the increase in neutrons coming from the core at the
higher multiplication. The asymmetry in the count rate distributions for
127
Progress in Nuclear Energy 106 (2018) 120–139
J. Arthur et al.
Fig. 10. Feynman histograms for various water heights.
Fig. 11. Feynman histograms for various CR heights.
configurations 1–4 is caused by contributions from the non-centrally
located PuBe starter source for the RCF. If the PuBe source were not
present the outer tube pairs (1 and 7, as well as 8 and 13) would be
expected to have similar count rates to each other. However, because
the PuBe source is located towards the side of the MC15 containing
tubes 1 and 8, these tubes display much higher count rates than tubes 7
and 13.
The RCF PuBe starter source, which is located above the core within
a layer of paraffin wax shielding, was not well characterized at the time
of the CaSPER measurement. Neither the source strength nor the diameter of the hole containing the source inside the wax shielding was
well known. A series of simulations was therefore performed in order to
ascertain the PuBe strength and shielding specifications that gave the
best match to the CaSPER measurements. The details are summarized in
Appendix A.
Measured and simulated row ratios, the ratio of the number of
counts in the front row (tubes 1–7 in Fig. 3) of the NoMAD to the
number of counts in the middle row (tubes 8–13) of the NoMAD, are
plotted in Fig. 8 as a function of water height. As the neutron spectrum
becomes softer, the row ratio increases. This is expected because lower
energy neutrons require less moderation in the polyethylene before
reaching the energy range at which they can be detected by the 3He
tubes. Therefore, at lower energies the neutrons are more likely to interact with the front rather than the middle row of 3He tubes.
Measured and simulated Feynman histograms for various water and
CR heights are shown in Figs. 9–12. Poisson distributions constructed
using the mean of each measured histogram are plotted as well. A
measurement of a non-multiplying system would be expected to produce a Poisson-shaped Feynman histogram; the deviation from Poisson
is correlated with the multiplication of a system. A list of FOM values
for the Feynman histograms is shown in Table 6.
128
Progress in Nuclear Energy 106 (2018) 120–139
J. Arthur et al.
simulated and measured results were taken at the same gate width, this
is not a concern. It is interesting to note that Y2 reaches a larger
asymptote at a longer gate width as water height increases. Although
this behavior could be caused by other factors, in the case of the
CaSPER measurement the larger asymptote is most likely due to the
increase in multiplication, while the longer gate width is due to the
increase in moderation.
Measured and simulated, using MCNP6.2, singles and doubles rates
are plotted in Fig. 14 as functions of water height, in Fig. 15 as functions of control rod height, and in Fig. 16 for the delayed critical configurations.
The trends shown in Fig. 14 are the result of the trade-off between
increasing multiplication and shielding with increasing water height. As
the water height is increased from lower levels, both the singles (R1) and
doubles (R2 ) rates increase due to increasing multiplication. However,
as the water begins to shield the detector from the core (at 30 in. the
water has just begun covering the bottom of the NoMAD), the singles
rate decreases. This is because the increased shielding is now overcoming the increasing multiplication and fewer neutrons are reaching
the detector. The doubles rate does not seem to decrease within the
range of water heights measured, however. This is most likely due to
the fact that the doubles rate depends more heavily on multiplication,
as compared to the singles rate. A true doubles event can only come
from fission, and the fission rate is directly related to multiplication,
while singles events can occur in any system regardless of the multiplication. Additionally, the correlated neutrons are emitted at fast energies and require moderation to reach the energy range in which the
NoMAD is sensitive to neutrons.
Increasing CR height (removing CR's from the core) increases multiplication without increasing shielding. As expected, therefore, Fig. 15
shows trends of purely increasing singles and doubles rates with increasing CR height. Because multiplication is very high for configurations 5–9, small discrepancies in the model will lead to large differences
in simulated and measured singles and doubles rates. The measured
results for the delayed critical configurations in Fig. 16 are an order of
magnitude larger than the simulated results. The magnitude discrepancy is most likely due to the exponential increase in neutron population that occurred when the reactor was briefly brought to a delayed supercritical state during the approach to critical procedure. The
neutron population remained at this elevated level during the subsequent measurements at delayed critical, and because the supercritical
excursion was not modeled in MCNP, this behavior was not included in
the simulation. It is interesting to note that both simulated and experimental results are very similar between the two delayed critical
configurations, even though the CR setup was different for each.
Neutron lifetime, the inverse of the prompt decay constant, was
obtained from fits of the measured Rossi data. Rossi data plots are
shown in Figs. 20 and 21. Alternatively, lifetime could have been obtained from fits of the Y2 plots. However, the residuals trends displayed
much worse behavior than the corresponding Rossi residuals. See
Fig. 19 for a representative example. It is much more preferable to have
residual values center around zero with no increasing or decreasing
trends, as in the Rossi residual plot. Neutron lifetime, 1 , and leakage
λ
multiplication, ML , are plotted versus water and CR heights in Figs. 17
and 18. The method used to calculate ε, and therefore ML , is discussed
in Appendix B. Only measured Rossi data and lifetime fits were obtained, and these measured lifetimes were used to calculate simulated
doubles and leakage multiplication results.
Both neutron lifetime and leakage multiplication increase with increasing water and CR height, as expected. The increase in neutron
lifetime is due to the increased time the neutrons surrounded by water
spend in the slowing down range. It is interesting to note that neutron
lifetime and leakage multiplication follow similar trends as a function
of water height. This behavior has been previously observed for thermal
uranium systems (Hutchinson et al., 2015a).
In order to separate the multiplying system and detector lifetimes,
Fig. 12. Feynman histograms for 20 in. CR height.
Table 6
FOM values for simulated and measured Feynman
histogram comparisons.
Configuration
FOM
1
2
3
4
5
6
7
3975
1372
119
6834
20358
1845
21364
The Feynman histograms show an interesting trend with increasing
water height. Initially, the histogram begins to shift to higher multiplets. At a certain turning point at which increasing shielding outweighs
increasing multiplicity, the histograms begin to shift back to lower
multiplets. It is expected that measured and simulated histograms deviate more at the highest water heights, due to the increased multiplication. This is because as multiplication increases the variance
(width) of the histogram is also increasing. At high multiplication
neutrons are more likely to be detected in small bursts over short periods of time. Because multiplication is proportional to the deviation
from Poisson statistics, the Feynman histograms at higher multiplication also show more deviation from Poisson. The FOM values show
that 44 in. water height does indeed show more deviation between simulated and measured histograms than any of the lower water height
configurations. The data at 36 in. water height show the best agreement
according to the FOM values as expected due to the fact that the RCF
PuBe source configuration optimization (Appendix A) was conducted
using simulations of the 36 in. water height configuration. This configuration was chosen because it is a mid-level water height and
therefore the most representative of all of the measured configurations.
To simplify the PuBe source model optimization process, only this representative configuration was used.
Fig. 13 shows plots of Y2 vs. gate width (see Equation (4)). These
plots were used to determine at which gate width to obtain singles,
doubles, leakage multiplication, and Feynman histogram results. Ideally a gate width at which all Y2 plots have reached an asymptote is
chosen, because this yields the “true” count rates. A gate width of
τ = 3368 μs was chosen. Although not all configurations have reached
an asymptote at this gate width, data processing limitations did not
allow for a larger gate width to be chosen. Because comparisons between simulated and measured results are of primary interest, and both
129
Progress in Nuclear Energy 106 (2018) 120–139
J. Arthur et al.
Fig. 13. Y2 vs. gate width for various configurations.
double rather than single exponential fits were used to fit the Rossi data
for configurations 1–4. For the other configurations, the detector lifetime is small enough compared to the system lifetime that only a single
exponential fit is required.
Because of the difficulties determining efficiency and leakage multiplication in the CaSPER measurement, an efficiency-independent ratio
(Equation (17)) (Smith-Nelson and Hutchinson, 2014) is also plotted in
Fig. 22. It is encouraging that this efficiency-independent parameter
compares well between simulated and measured results.
Sm2 =
R2
R12
configuration 3 from Table 4. The resulting changes in singles and
doubles rates, per standard deviation change in the physical parameter,
are listed in Table 7.
It is apparent that singles and doubles rates are most sensitive to
changes in PuBe strength and NoMAD distance, followed by 252Cf
strength and water height, and are very insensitive to changes in CR
height. It is expected for the results to be much more sensitive to
changes in coarse (water) than fine (CR's) reactivity control. However,
it should be noted that the uncertainty analysis was carried out in a
fairly insensitive region of the CR reactivity worth curve. If configuration 6 or 7 were used instead of configuration 3, the sensitivities to CR
height would be expected to be larger. The fact that changes in PuBe
strength have the largest effect on the observables once again highlights
the fact that the RCF PuBe source was unwisely neglected during the
design phase of the CaSPER campaign.
It should also be noted that not all possible physical uncertainties
were investigated. There are uncertainties associated with fuel composition and density, water temperature, CR boron content, etc.
However, these parameters are expected to have smaller sensitivities
than the investigated parameters. Because this work is meant to be a
(17)
4.1. Physical uncertainties
In order to determine the sensitivity of simulated results to physical
parameter uncertainties (systematic uncertainties), perturbation analysis was carried out for various physical parameters of interest. For
each parameter of interest, the parameter was varied by an amount
equal to 5 times its uncertainty. This was performed using the model of
130
Progress in Nuclear Energy 106 (2018) 120–139
J. Arthur et al.
Fig. 14. R1 and R2 as functions of water height. The R1 trend illustrates the trade-off
between shielding and multiplication in a water moderated system.
Fig. 15. R1 and R2 as functions of CR height, for a water height of 67 in.
measurement campaign. A multiplying pool-type research reactor
system is not symmetric, a large amount of water reflection is used in
place of metal reflectors, the neutron spectra span a range between fast
and thermal at different water heights, etc. Many lessons were learned
throughout the execution of the CaSPER measurements, that helped
contribute to a modified protocol, and will be expounded upon here for
the benefit of future experimenters.
For the RCF, the water temperature is just over 80 °F, and the fuel
reaches the same temperature as the water in steady state. 80 °F is very
close to room temperature. Because water density and nuclear data may
vary at different temperatures, nuclear data libraries evaluations exist
at temperatures other than room temperature. However, the closest
evaluations are either below 0 °F or in the hundreds of ºF. Therefore, the
evaluation at room temperature was used in this work. For future
benchmark-quality pool-type research reactor measurements, however,
the temperature of the moderating water in the reactor core may need
to be taken account.
Additionally, one must be aware of the trade-off between shielding
and multiplication in a water moderated system. This trade-off is shown
in the trends of singles and doubles rates as functions of water height. In
starting point for future measurements rather than a benchmark itself,
an exhaustive uncertainty analysis was not carried out. Due to the
presence of an above-core starter source that is not well characterized, a
benchmark of the CaSPER measurements would be impossible.
4.2. Research reactor protocol
The Critical and Subcritical 0-Power Experiment at Rensselaer
(CaSPER) campaign was designed and executed to establish a protocol
for advanced subcritical research reactor measurements. For past subcritical benchmarks (Hutchinson et al., 2016; Richard and Hutchinson,
2014, 2016), protocol has consisted of measuring a multiplying system
(historically symmetric) with 3He multiplicity detectors around 50 cm
away on either side of the system. Measurements were taken both with
a bare multiplying system and with symmetric metallic reflectors. Data
analysis was conducted using the Hage-Cifarelli formalism based on the
Feynman Variance-to-Mean method. Even with various reflector materials, the neutron spectra remained predominantly epithermal. This
protocol does not particularly apply to a pool-type research reactor
131
Progress in Nuclear Energy 106 (2018) 120–139
J. Arthur et al.
Fig. 16. R1 and R2 for the delayed critical configurations.
Fig. 17. Neutron lifetime and multiplication as functions of water height.
Fig. 14, R1 first increases as a function of water height, reaches a turning
point, and then begins decreasing with further increases in water
height. While this turning point is not reached in the CaSPER measurement for R2 , perhaps future experimenters will be able to further
observe and predict this behavior.
Practically, an extremely robust watertight system must be made
available to protect the neutron multiplicity detector from water damage inside a water moderated reactor core if the detector is placed
directly in the core. Additional material (i.e., Pb blocks, straps) may be
required to lock the detection system into place and keep it from
floating or otherwise deviating from the desired measurement position.
In the CaSPER measurement, ratchet straps were used to tie the NoMAD
detector housing and a layer of Pb bricks to an aluminum stand that
held the detection system in place inside core. However, the detector
system does not always have to be placed directly inside the core in
pool-type research reactor measurements. If the core is small enough
that the water does not attenuate the neutron flux significantly, the
detector system can be placed outside the core. The detector system can
also be placed on a stand above the core. For CaSPER, the reactor core
was too large to allow for an acceptably large signal outside the core
(parametric study results indicate that this would have been possible if
the reactor tank radius had been less than 60 cm). In addition, both the
direct upward neutron streaming from the 252Cf source in the center of
the fuel rods and the presence of the above-core PuBe source caused the
above-core detector system placement option to be rejected. Sources
contained in and around the reactor that are normally neglected by
reactor operators (i.e., a PuBe startup source) cannot be neglected in
the case of neutron multiplicity measurements. Indeed, potential contributions from neglected external radiation sources have been an
Achilles heel for many experimentalists; for example, in the case of
bubble fusion, one of the main sources of contention was whether or not
the sources of neutrons had been properly characterized (Mullins,
2005).
In addition to comparing configurations at the same reactivity with
differing control rod heights (configurations 8 and 9), it would be interesting to obtain the same reactivity from different water and control
rod height combinations to determine if changing both the fine (control
rod) and coarse (water) reactivity controls would compare better or
132
Progress in Nuclear Energy 106 (2018) 120–139
J. Arthur et al.
has been observed in previous thermal subcritical measurements involving enriched uranium. It is also important to note that the extremely large discrepancies between simulated and measured results at
delayed critical, as seen in Fig. 16, were likely caused by a previous
excursion into a delayed supercritical state. As previously discussed, an
exponential increase in neutron population occurred when the reactor
was briefly brought to a delayed supercritical state during the approach
to critical procedure. The neutron population remained at this elevated
level during the subsequent measurements at delayed critical, and because the supercritical excursion was not modeled in MCNP, this behavior was not exhibited in the simulation. In future critical measurements, this discrepancy can be avoided by bringing the reactor down to
a subcritical state, after the approach to critical process, to allow the
neutron population to die down. The reactor can then be brought back
up to a critical state without the increase in neutron population caused
by the supercritical excursion.
Table 7 shows that the observables in this experiment are most
sensitive to changes in NoMAD distance and RCF PuBe source strength.
Conversely, singles and doubles rates are not very sensitive to changes
in control rod height. Therefore, for subcritical research reactor measurements of this type it is most desirable to be able to very accurately
measure both the core-detector distance and the characteristics of any
strong in-core starter source. However, larger uncertainties on fine reactivity control are allowable when operating in a generally insensitive
region of the fine reactivity control worth curves.
Part of the protocol determined during the CaSPER measurements is
related to data analysis. Applying a FOM (Equation (16)) to comparisons between simulated and measured Feynman histograms (Table 6)
is a useful method for quantifying the deviation between simulated and
measured histogram results, such as that are seen in Figs. 9 and 11,
rather than simply using qualitative inspection. The FOM also proves
useful when applied to comparisons between simulated and measured
counts-per-tube plots (Table 5), especially for determining an optimal
match between simulated and measured results (see Appendix A).
Several issues arose in determining both the prompt neutron decay
constant and the absolute detector efficiency required to calculate
leakage multiplication. Although the Hage-Cifarelli formalism based on
the Feynman Variance-to-Mean method can take into account contributions from (α, n) sources, there is no provision for (α, n) sources
that aren't coincident with the fission source (see Appendix B for how
this difficulty was addressed). Both the Y2 and the Rossi fitting method
were used to determine the prompt neutron decay constants for configurations 1–4. In order to separate the multiplying system and detector lifetimes, double rather than single exponential fits were used in
both cases. In typical fast SNM subcritical measurements, the detector
Fig. 18. Neutron lifetime and multiplication as functions of CR height.
worse than changing only the fine reactivity control. It is interesting to
note that, according to Fig. 17, leakage multiplication and system
neutron lifetime follow similar trends as a function of water height. This
Fig. 19. Regular residual plots for Rossi and Y2 fits at 36 in. water height, using double decay constant fits. The Rossi residual shows a much more desirable trend.
133
Progress in Nuclear Energy 106 (2018) 120–139
J. Arthur et al.
Fig. 20. Rossi data vs. Rossi time for measured configurations 1–4. Double exponential fits were used.
to be performed at a 0-power pool-type research reactor. This work
builds upon the previous years of collaborative subcritical experiments
and has helped establish a protocol for future subcritical neutron
multiplication inference measurements on pool-type reactor systems. In
the CaSPER campaign, the NoMAD detection system was placed inside
the RPI-RCF core and used to measure correlated neutron observables
of interest at various water and control rod heights. Measured and simulated observables such as Feynman histograms, singles rates, doubles rates, and leakage multiplication comparisons show overall good
agreement. As expected, larger discrepancies exist at configurations
with higher multiplication, especially at and near delayed critical. The
experimental observables of interest are the most sensitive to uncertainties in neutron multiplicity detector distance to the fuel and the
reactor starter source strength. Interesting trends of observables versus
water and control rod heights were observed and present opportunities
for further investigation. The singles rate initially increases with increasing water height, reaches a turning point, and begins to decrease
with further increases in water height. The doubles rate steadily increases with water height for the range of water heights measured in
lifetime is longer than the multiplying system lifetime. For CaSPER, the
experimenters consider the system to include everything inside the
reactor tank. In this case, the system lifetime is much longer than the
detector lifetime and results can be calculated, using the system lifetime, at large enough gate widths that the detector lifetime has died
out. By comparing residual plots of Y2 and Rossi fits (Fig. 19), it was
determined that Rossi alpha fitting is a better method to obtain neutron
lifetime in highly reflected and moderated systems, such as research
reactors. Measured doubles rates were calculated at τ = 32 μs , before
the detector lifetime had died out, and at τ = 3368 μs , after the detector
lifetime had died out, as shown in Fig. 23. It seems that in this case the
detector lifetime has a small effect on the results. This is most likely due
to the fact that for such a thermal system, the system neutron lifetime is
very long compared to the detector lifetime, and therefore the detector
lifetime can be neglected even at short times (small gate widths).
5. Conclusions
The CaSPER campaign is the first advanced subcritical measurement
134
Progress in Nuclear Energy 106 (2018) 120–139
J. Arthur et al.
Fig. 21. Rossi data vs. Rossi time for measured configurations 5–7. Single exponential fits were used.
Table 7
Change in observables, per standard deviation perturbation of the parameter of interest,
obtained using configuration 3.
Physical parameter
Standard
deviation
Singles sensitivity
Doubles sensitivity
Water height
1 in.
91s−1
7s−1
CR height
1 in.
2s−1
1s−1
NoMAD distance
2 cm
252s−1
25s−1
252
1860 s.f./s
112s−1
9s−1
PuBe strength
1.4E6 n/s
404s−1
26s−1
Cf strength
measurements, and associated simulations, that will further validate
multiplication inference techniques and Monte Carlo codes, as well as
identify and correct deficiencies in underlying nuclear data quantities,
such as ν . Although the CaSPER measurement itself cannot be a
benchmark, this work is paving the way towards an ICSBEP benchmarkquality experiment at the RPI-RCF, or other research reactor facilities.
The IPEN/MB-01 research reactor in Brazil (dos Santos et al., 2014), the
Sandia National Laboratory (SNL) research reactor (Harms, 2013), the
Fig. 22. Efficiency-independent ratio plotted for simulated and measured data.
this work, but it is expected that a turning point also exists at a higher
water height for the doubles rate. The CaSPER measurement will be the
first in a series of advanced subcritical neutron multiplication
135
Progress in Nuclear Energy 106 (2018) 120–139
J. Arthur et al.
Training Reactor in the Czech Republic (Crha, 2016) are other possible
future advanced subcritical low-power pool-type research reactor
benchmark measurement locations.
Acknowledgments
This material is based upon work supported in part by the
Department of Energy National Nuclear Security Administration under
the Consortium for Nonproliferation Enabling Capabilities (CNEC)
Fellowship, Award Number DE-NA0002576. This work was also supported in part by the DOE Nuclear Criticality Safety Program, funded
and managed by the National Nuclear Security Administration for the
Department of Energy.
The authors would like to thank Mark Smith-Nelson of LANL for his
invaluable help in operating the NoMAD detection system and conducting the CaSPER measurement.
Fig. 23. Measured R2 results before (τ = 32μs ) and after (τ = 3368 μs ) the detector lifetime dies out.
Minerve reactor at CEA Cadarache (Geslot et al., 2017), and the VR-1
Appendix A. RCF PuBe source
The PuBe shielding is a cylinder with outer dimensions of 12″×12”. It is known to be made of paraffin wax with a hole in the center in which the
source resides. It is assumed that the hole is cylindrical and extends from the top to the bottom of the shielding. According to RCF records, the source
strength is on the order of 1E7 n/s and the hole diameter is on the order of 1 in. Using this shielding configuration and source strength in the CaSPER
configuration 3 simulations did not yield a good match between simulated and measured results, as shown in Fig. 24. It was judged that either the
source strength, shielding, or both could not be correct.
The source strength and hole diameter were then varied until a good match between simulated and experimental results for configuration 3 was
found, as shown in Fig. 25. The optimized hole diameter and source strength are 3.8 in. and 1.4E7, respectively.
The PuBe source constitutes the largest contribution to the singles rate. Fig. 26 and Table 8 show only roughly 33–40% of singles are due to the
252
Cf source. Because this is simulated data it was possible to separate out the count rate due to 252Cf alone, by simply not modeling the PuBe source.
Fig. 24. Initial comparison between simulated and measured counts-per-tube histograms for configuration 3. The FOM value characterizing this comparison is 201686.
136
Progress in Nuclear Energy 106 (2018) 120–139
J. Arthur et al.
Fig. 25. Final comparison between simulated and measured counts-per-tube histograms for configuration 3. The FOM value characterizing this comparison is 49597.
Fig. 26. Simulated contribution of the RCF PuBe starter source to the singles rate at different water heights, as compared to the singles rate due to
Table 8
Comparison of percentage contributions of the RCF PuBe source and the
Cf alone.
252
Cf source.
Water height (in.)
252
PuBe % contribution
24
30
36
44
34
35
33
39
66
65
67
61
Cf % contribution
252
Table 9
Adjusted efficiencies for each water height.
Water height (in.)
Efficiency
Adjusted efficiency
24
30
36
44
67
0.0506
0.0530
0.0430
0.0149
0.0001
0.00759
0.00800
0.00645
0.00223
0.00002
Appendix B. Leakage multiplication calculations
Due to the large contribution of the above-core RCF PuBe starter source to the measured CaSPER signal, Equation (8) is no longer valid. Two new
methods for calculating leakage multiplication were primarily investigated. In method 1, it is assumed that ML = 1 at the 24 in. water height
configuration. Therefore, efficiency can be solved for at this configuration. This calculated efficiency is, as expected, very different from the value
obtained using the typical method of taking the ratio of the singles rate in the corresponding no-fuel measurement to the known 252Cf source
strength. The ratio of the “adjusted efficiency” to the typically calculated efficiency is then used as a multiplier to calculate adjusted efficiencies at all
137
Progress in Nuclear Energy 106 (2018) 120–139
J. Arthur et al.
Fig. 27. Neutron leakage multiplication as a function of water height.
Fig. 28. Neutron leakage multiplication as a function of CR height.
other water heights. Table 9 lists the original and adjusted efficiencies for each water height. These adjusted efficiencies are used to calculate leakage
multiplication.
It is clear that the original efficiencies are incorrect. From previous measurements with the NoMAD it is known that the absolute efficiency at a
distance of 50 cm away from a252Cf source in air is on the order of 1%. Because the source-detector distance is 48.5 cm and at 24 in. water height the
water level has not yet reached the bottom of the NoMAD, the efficiency value is expected to be much closer to 1% than 5%. Therefore, the adjusted
efficiency values are much more realistic.
In method 2, equations for R1 and R2 (Hutchinson et al., 2015b) are manipulated to separate the contributions from the 252Cf and PuBe sources.
Efficiency is assumed to be a constant multiplied by the relative contributions of each source. It is also assumed that ML = 1 at the 24 in. water height
configuration. As shown in Equations (18) and (19), this becomes a system of 2 equations and 2 unknowns (efficiency constant ε and (α,n) source
strength Sα ). Because the solution of this system of equations yields the PuBe source strength, 1.12E5 n (which is more of an effective source strength
s
that treats the shielded above-core PuBe source as an unshielded point source coincident in space with the 252Cf spontaneous fission source), this
value can be input into the system of equations in 20 and 22. Therefore, ε and ML can be solved for at all other configurations.
R1 = ε [fCf νs1 Fs + fPuBe Sα ]
(18)
2
Sα⎤
R2 = ε 2 ⎡fCf2 νs2 Fs + f PuBe
⎥
⎢
⎦
⎣
(19)
R1 = ε [fCf b11 Fs + fPuBe b12 Sα ]
(20)
b11 = ML νs1 b12 = ML
(21)
2
b22 Sα⎤
R2 = ε 2 ⎡fCf2 b21 Fs + f PuBe
⎥
⎢
⎦
⎣
(22)
M −1
M −1
b21 = ML2 ⎡νs2 + L
νs1 νI 2 ⎤ b22 = ML2 L
νI 2
⎢
⎥
ν
−
1
νI 1 − 1
I1
⎣
⎦
(23)
Both methods of calculating leakage multiplication yield reasonable results for configurations 1–4, as seen in Fig. 27. However, method 2 shows
an unreasonable trend versus CR height for configurations 5–7, as shown in Fig. 28. Therefore, method 1 was used to calculate final leakage
138
Progress in Nuclear Energy 106 (2018) 120–139
J. Arthur et al.
multiplication results for this work. This complication with efficiency and leakage multiplication calculation is one of the reasons why the CaSPER
measurements cannot be a benchmark. Additional measurements taken during the execution of CaSPER may have provided better estimates of
efficiency.
Hutchinson, J., Sood, A., Myers, W., Smith-Nelson, M., Dinwiddie, D., 2013b. Comparison
of HEU measurements using measured and simulated data. Trans. Am. Nucl. Soc. 106,
487–489.
Hutchinson, J., Smith-Nelson, M.A., Sood, A., Goda, J.M., Bounds, J.A., 2014. Joint
LANL/CEA measurements on Godiva IV. In: American Nuclear Society Annual
Meeting, Reno NV.
Hutchinson, J., Nelson, M.A., Sood, A., hayes, D.K., Sanchez, R.G., 2015a. Neutron noise
measurements on HEU foils moderated by lucite. In: American Nuclear Society
Annual Meeting, San Antonio TX.
Hutchinson, J.D., Smith-Nelson, M.A., Cutler, T.E., Richard, B.L., Grove, T.J., 2015b.
Estimation of uncertainties for subcritical benchmark measurements. In:
International Conference on Computing, Networking and Communications.
Hutchinson, J., Mustafa, B., Smith-Nelson, M.A., Myers, W., Cutler, T.E., Solomon, C.J.,
Sood, A., Dinwiddie, D.R., Grove, T.J., 2016. Subcritical multiplication experiments &
simulations: overview and recent advances. In: Advances in Nuclear Nonproliferation
Technology and Policy Conference.
Mattingly, J., 2009. Polyethylene-reflected Plutonium Metal Sphere: Subcritical Neutron
and Gamma Measurements, Sandia National Laboratory Report SAND2009–5804.
McKenzie, G., 2014. Modern Rossi Alpha Measurements. M.S. Thesis. University of
Illinois at Urbana-Champaign.
Miller, E.C., Mattingly, J.K., Dennis, B.D., Clarke, S.D., Pozzi, S.A., 2010. Simulations of
Neutron Multiplicity Measurements with MCNP-PoliMi, Technical Report
SAND2010–6830, Sandia National Laboratory.
Moss, C., Sorenson, E., Nelson, M., 2016. Multiplicity Counter-15 (MC-15) User Manual,
Los Alamos National Laboratory, LA-UR-16–27099.
Mullins, J., 2005. Pop!. N. Sci. 38, 40–44.
Richard, B., Hutchinson, J., 2014. Nickel Reflected Plutonium Metal Sphere Subcritical
Measurements, International Handbook of Evaluated Criticality Safety Benchmark
Experiments NEA/NSC/DOC/(95)03/I. FUND–NCERC–PU–HE3–MULT–001.
Richard, B., Hutchinson, J., 2016. Tungsten-reflected Plutonium-metal-sphere Subcritical
Measurements, International Handbook of Evaluated Criticality Safety Benchmark
Experiments NEA/NSC/DOC/(95)03/I. FUND–NCERC–PU–HE3–MULT–002.
Smith-Nelson, M., 2015. Momentum: Version 0.36.3, LANL Software.
Smith-Nelson, M.A., Hutchinson, J.D., 2014. The Sm2 Ratio for Evaluating Neutron
Multiplicity Models, Los Alamos National Laboratory Report, LA-UR-14–29047.
Solomon, C., 2014. The Mcnptools Package, Tech. rep., LA-UR-14–27075.
Sood, A., Solomon, C.J., Hutchinson, J.D., Bahran, R., November 2014. A review of recent
R&D efforts in sub-critical multiplication measurements and simulations. Trans. Am.
Nucl. Soc. 111, 799–802.
Temple, B., 2009. User's Manual for the convert.Pl PERL Script, LA-UR-09–05257.
Thompson, N., Bahran, R., Winters, G., Frantz, E., Gazda, R., McDermott, B., Wei, J.,
Caracappa, P., Trumbull, T., Thompson, J., Danon, Y., 2015. Nuclear engineering
education at the RPI walthousen reactor critical facility. In: Proceedings of the
Institute of Nuclear Materials Management 56th Annual Meeting.
Trahan, A., 2016. Utilization of the differential die-away self-interrogation technique for
characterization of spent nuclear fuel. Ph.D. thesis. University of Michigan.
Uyttenhove, W., Baeten, P., Kochetkov, A., den Eynde, G.V., Vittiglio, G., Wagemans, J.,
Lathouwers, D., Kloosterman, J., van der Hagen, T., Billebaud, A., Chabod, S.,
Mellier, F., Lecouey, J., Lecolley, F., Lehaut, G., Marie, N., Doligez, X., Carta, M.,
Becares, V., Villamarin, D., 2014. Static Modal Analysis of the Current-to-flux
Subcriticality Monitor for Accelerator-driven Systems, PHYSOR. The Role of Reactor
Physics toward a Sustainable Future.
Wagemans, C., 1991. The Nuclear Fission Process. CRC Press, Boca Raton.
References
Anderson, M.E., Neff, R.A., 1972. Neutron energy spectra of different size 239Pu-Be(α, n)
sources. Nucl. Instrum. Meth. 99, 231–235.
Arthur, J.A., Bahran, R.M., Hutchinson, J.D., Rising, M.E., Pozzi, S.A., 2016. Comparison
of the performance of various correlated fission multiplicity monte carlo codes. In:
Transactions of the American Nuclear Society Winter Meeting and Technology Expo.
Bahran, R., Hutchinson, J., 2016. Subcritical copper-reflected α-phase plutonium (SCRαP)
integral experiment design. Trans. Am. Nucl. Soc. 114, 527–529.
Bahran, R., Hutchinson, J., Richard, B., Sood, A., 2014a. List-mode simulations of the
Thor core benchmark sensitivity experiments. Transactions of the American Nuclear
Society Annual Meeting 111, 805–808.
Bahran, R., Croft, S., Hutchinson, J., Smith, M., Sood, A., 2014b. A survey of nuclear data
deficiences affecting nuclear non-proliferation. In: INMM Annual Meeting, Atlanta
GA, Proceedings of the.
Bolding, S., 2013. Design of a Neutron Spectrometer and Simulations of Neutron
Multiplicity Experiments with Nuclear Data Perturbations. M.S. thesis. Kansas State
University.
Bolding, S.R., Solomon, C.J., 2013. Simulations of multiplicity distributions with perturbations to nuclear data. Trans. Am. Nucl. Soc. 109, 251–254.
Briggs, J., Bess, J., Gulliford, J., 2014. Integral benchmark data for nuclear data testing
through the ICSBEP & IRPhEP. Nucl. Data Sheets 118, 396–400.
Chabod, S., Billebaud, A., Lecolley, F., Lecouey, J., Lehaut, G., Marie, N., Ban, G., Doligez,
X., Kochetkov, A., Baeten, P., Krasa, A., Uyttenhove, W., Vittiglio, G., Wageman, J.,
Mellier, F., Villamarin, D., 2014. Reactivity Measurements at Guinevere Facility
Using the Integral Kp Method, PHYSOR. The Role of Reactor Physics Toward a
Sustainable Future.
Cifarelli, D., Hage, W., 1986. Models for a three-parameter analysis of neutron signal
correlation measurements for fissile material assay. Nucl. Instrum. Meth. 251,
550–563.
Crha, J., 2016. Neutron imaging on the VR-1 reactor. J. Phys. 746 Conference Series.
Degweker, S., Rudra, R., 2016. On the relation between Rossi alpha and Feynman alpha
methods. Ann. Nucl. Energy 94, 433–439.
dos Santos, A., de Andrade e Silva, G.S., Diniz, R., Yamaguchi, M., Mura, L.F.L., Fuga, R.,
Gonnelli, E., Lee, S.M., Jerez, R., 2014. Subcritical Loading Configurations of the
IPEN/MB-01 Reactor, International Handbook of Evaluated Criticality Safety
Benchmark Experiments NEA/NSC/DOC/(95)03/IV. SUB–LEU–COMP–THERM–002.
Dulla, S., Nervo, M., Ravetto, P., 2014. A Method for Reactivity Monitoring in Subcritical
Source-driven Systems, PHYSOR. The Role of Reactor Physics toward a Sustainable
Future.
Geslot, B., Gruel, A., Walczak, P., Leconte, P., Blaise, P., 2017. A hybrid pile oscillator
experiment in the Minerve reactor. Ann. Nucl. Energy 108, 268–276.
Goorley, T., James, M., Booth, T., Brown, F., Bull, J., et al., 2012. Initial MCNP6 release
overview. Nucl. Technol. 180, 298–315.
Hansen, G., Helmick, H., Orndoff, J., 1968. Neutron Counting Statistics in Basic Fast
Critical Assemblies, Transactions of a Japan-United States Seminar on Nuclear
Reactor Noise Analysis.
Harms, G.A., 2013. Water-moderated Square-pitched U(6.90)O2 Fuel Rod Lattices with
0.52 Fuel-to-water Volume Ratio (0.855 Cm Pitch), International Handbook of
Evaluated Criticality Safety Benchmark Experiments NEA/NSC/DOC/(95)03/IV.
LEU–COMP–THERM–078.
Hutchinson, J., Rooney, B., Myers, W., Sood, A., Smith-Nelson, M., 2013a. CALIBAN
measurements near delayed critical using subcritical measurement methods. In:
American Nuclear Society Winter Meeting, Washington DC.
139