APERTRACK: A particle-tracking model to simulate radionuclide transport in the Arabian/Persian Gulf
Bạn đang xem bản rút gọn của tài liệu. Xem và tải ngay bản đầy đủ của tài liệu tại đây (6.4 MB, 13 trang )
Progress in Nuclear Energy 142 (2021) 103998
Contents lists available at ScienceDirect
Progress in Nuclear Energy
journal homepage: www.elsevier.com/locate/pnucene
APERTRACK: A particle-tracking model to simulate radionuclide transport in
the Arabian/Persian Gulf
R. Periáđez
Dpt Física Aplicada I, ETSIA, Universidad de Sevilla, Ctra Utrera km 1, 41013 Sevilla, Spain
ARTICLE
INFO
ABSTRACT
Keywords:
Arabian/Persian Gulf
Tide
Baroclinic circulation
Radionuclide
Transport
Sediment
A Lagrangian rapid-response model for simulating the transport of radionuclides in the Arabian (or Persian)
Gulf is described. The model is based on a tide model including five constituents, which was solved in
advance, and baroclinic circulation was obtained from HYCOM operational ocean model. The radionuclide
model includes physical transport (advection and diffusion), radioactive decay and geochemical processes
(interactions of radionuclides between water and sediments, described in a dynamic way). The model can
lead with instantaneous or continuous releases. Some hypothetical releases from a coastal nuclear power plant
were simulated. Results show that the moment of release affects the fate of radionuclides due to the temporal
variability of baroclinic currents. Also, comparing results for releases of Cs and Pu, it was seen how the
geochemical behaviour of the radionuclide clearly affects the further radionuclide distributions. It is easy to
setup the model for a particular release and it provides a fast response; thus the present model is an appropriate
tool to support decision-making after a nuclear accident.
1. Introduction
In addition, commercial and subsistence fisheries provide a living for a
large sector of the coastal population (Abdi et al., 2006).
The coastal environment of the APG has been exposed to various
sources of radioactive pollution (Al-Ghamdi et al., 2016), including
desalination plants (which are the main source of radium in the brine
discharged to the sea) and phosphate industry (radium in phosphogypsum waste). Oil spills are relatively common in the APG, in addition
to the massive oil releases during the 1991 Gulf War, which have
both added natural radionuclides into the local marine environment.
A review on radioactivity levels in the APG may be seen in Uddin et al.
(2020).
In addition to what it is commented above, the APG, Strait of
Hormuz and Gulf of Oman are one of the most important waterways in
the world, thus exposed to pollution incidents due to shipping activities
(mainly potential oil spills). But recently, there has been concern about
the nuclear power plants which are now operating along the APG coasts
(Kamyab et al., 2018). There are two operational NPPs in the region,
Bushehr in Iran and Barakah in UAE, whose unit 1 was connected to the
power grid in summer 2020. About seventeen more are planned in the
Kingdom of Saudi Arabia, with the intention that they are operational
by 2030 (Uddin et al., 2020).
Consequently, it is relevant to have a numerical model able to assess
the effects of radioactive releases into the APG from such NPPs (or
from a ship transporting nuclear wastes for instance). Discharges could
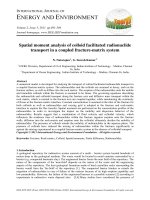
The Arabian (or Persian) Gulf, from now on APG, is a shallow water
body with a mean depth of 36 m (Alosairi and Pokavanich, 2017). It
is connected to the Gulf of Oman (Indian Ocean) through the Strait
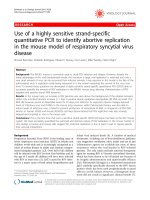
of Hormuz, thus it is a semi-enclosed marginal sea (Fig. 1). Countries
which surround the APG are the United Arab Emirates, Saudi Arabia,
Qatar, Bahrain (which consists of more than 30 islands in the APG),
Kuwait, Iraq and Iran (this last in the eastern side).
Circulation in the APG is forced by both winds and thermohaline
(density driven) forcing. Given the excess of evaporation over precipitation and river inflow, a inverse estuarine circulation results; with
the high salinity waters leaving the APG through a deep layer of the
Strait of Hormuz and being replaced by a fresher surface inflow from
the Indian Ocean (Kämpf and Sadrinasab, 2006). This inflow occurs
along the Iranian coast (Johns et al., 2003). Tides in the Gulf form
standing waves, being dominant the semidiurnal and diurnal tides. The
dimensions of the Gulf lead to a resonance of both tides, with one
amphidromic point in the case of the diurnal and two in the case of
the semidiurnal ones (Hyder et al., 2013).
Desalination plants are the main freshwater source to the APG
countries (Alosairi and Pokavanich, 2017). For instance, in Abu Dhabi
in 2007 desalination plants produced more than 2.3 million cubic metre
of fresh water per day, which accounted for 36% of the total water
production (Environmental Agency Abu Dhabi, 2009) in such country.
E-mail address:
/>Received 17 February 2021; Received in revised form 5 October 2021; Accepted 8 October 2021
Available online 21 October 2021
0149-1970/© 2021 The Author.
Published by Elsevier Ltd.
This is an open
( />
access
article
under
the
CC
BY-NC-ND
license
Progress in Nuclear Energy 142 (2021) 103998
R. Periáñez
Table 1
Model availability.
Program name
Developer
Contact
Hardware
Program code
Cost
Availability
equations (see for instance Periáñez, 2012; a summary is presented in
Appendix A) are solved for each constituent and tidal analysis is carried
out for each constituent as well. The Eulerian residual transport is
calculated, according to the procedure described in Periáñez (2012) and
summarized in Appendix A, to obtain tidal residual currents. Boundary
conditions to solve the equations consist of specifying water surface
elevations and phases, from measured tidal constants, along the open
boundaries of the domain. Measurements were obtained from Pous
et al. (2012). The model domain extends from 47◦ E to 57◦ E in
longitude and from 23◦ N to 31◦ N in latitude (Fig. 1). Resolution is
the same as HYCOM model, 0.08◦ (see Section 2.2).
Once that amplitudes and phases (adapted phase, i.e., for the local
time meridian) for each grid cell and constituent (calculated from the
tidal analysis) are known, the tidal prediction equation is used to
evaluate the exact tidal state during each time step of the radionuclide
simulation and location in the APG. The procedure is described in
Parker (2007) and Boon (2011) and summarized in Appendix A.
The tidal model is two-dimensional, thus it provides averaged currents over the water column. A three-dimensional current field is
generated using a standard current profile, since currents decrease from
sea surface to the bottom because of friction. Details may be seen in
Pugh (1987) and Periáñez and Pascual-Granged (2008).
The present tidal model was successfully tested for several regions
at quite different spatial scales (Periáñez, 2007, 2009, 2012; Periáñez
et al., 2013; Periáñez and Abril, 2014; Periáñez, 2020a).
APERTRACK
R. Periáñez, University of Sevilla
Desktop PC
Fortran
Free
/>
be due to the normal operation of the plants or to acute accidental
releases. A significant conclusion from IAEA (International Atomic
Energy Agency) MODARIA and MODARIA-II (Modelling and Data for
Radiological Impact Assessments) programmes (Periáñez et al., 2019a,
2016a; IAEA, 2019) was the need to have site specific models which
are carefully adapted to the region and made available for any marine
area potentially exposed to a radionuclide release. This would help the
decision-making process after an accident. Recent studies describing
marine radionuclide transport models applied to other areas potentially
exposed to nuclear accidents are, for instance, those of Periáñez et al.
(2021) for the northern Indian Ocean and Tsabaris et al. (2021) for
the eastern Mediterranean Sea. A review of models applied to simulate
Fukushima releases in the Pacific Ocean may be seen in Periáñez et al.
(2019a).
Some models are described in literature concerning the dispersion of
oil spills in the APG (Proctor et al., 1994; Faghihifard and Badri, 2016;
Al-Rabeh et al., 2000); however this is not the case with radionuclides.
A radionuclide transport modelling work for the APG which could be
found is that of Kamyab et al. (2018). These authors applied CROM1
model to simulate a hypothetical accident at Bushehr NPP; but CROM
is essentially a Gaussian model based on the generic models described
in IAEA (2001) suitable for steady conditions at a local scale, not
able to deal with spatio-temporal variations of currents due to tidal
oscillations and thermohaline forcing, thus its applicability in this case
is questionable. Hassanvand and Mirnejad (2019) calculate tides in the
northern APG and describe their effects in transporting radionuclides
released from Bushehr in a qualitative way (without applying a transport model). They again use CROM to estimate transport and doses.
The purpose of this paper is to fill such gap, presenting a radionuclide
transport model for the APG which could be used for both chronic
and accidental releases, including realistic descriptions of tidal and
baroclinic currents, and finally including interactions of radionuclides
between water and sediments; in line with recommendations in IAEA
(2019). Moreover, the model is able to provide a fast response, thus
it would be useful to support the decision-making process after an
accident. Availability of the model is summarized in Table 1.
The model is described in Section 2, where hydrodynamic methods (for tides and baroclinic circulation) and radionuclide transport
description are presented separately. Results are presented in Section 3;
first results of the tidal and baroclinic models are described (Section 3.1). Next some examples of simulations of radionuclide releases
in the APG are presented (Section 3.2).
2.2. Baroclinic circulation
HYCOM (Hybrid Coordinate Ocean Model, (Bleck, 2001)) model
was used to obtain baroclinic circulation in the APG. HYCOM is a
primitive equation general circulation model with 40 vertical layers
increasing in thickness from the surface to the sea bottom and 0.08◦
horizontal resolution in both latitude and longitude. Examples of HYCOM model applications over the world are presented in the model web
page ( Actually, this model has already been
used to study circulation in the APG (Yao and Johns, 2010a,b). Daily
currents were downloaded from HYCOM data server for the APG (the
same domain specified above for the tidal model). Note that the tidal
model is required since tides are not included in HYCOM.
2.3. Radionuclide transport
The model is Lagrangian as commented before, thus the radionuclide release into the sea is simulated by means of a number of particles.
Each particle is equivalent to a number of units (for instance Bq), and
trajectories are calculated during the simulated period. The transport
model considers physical transport (advection due to water currents
and mixing due to turbulence) plus radioactive decay and interactions
of radionuclides with bed sediments (adsorption/desorption reactions).
Radionuclide concentrations are obtained from the number of particles
within each grid cell and compartment (surface water, deep water and
sediment as explained in Appendix B) and the number of units (Bq)
which corresponds to each particle.
Turbulent mixing, radioactive decay and exchanges of radionuclides
between water and sediment are described through a stochastic method
(Periáñez and Elliott, 2002; Kobayashi et al., 2007; Periáñez et al.,
2019a). A dynamic method is applied to describe water/sediment
interactions, thus a kinetic coefficient 𝑘1 describes the transfer of
radionuclides from water to sediment and a coefficient 𝑘2 governs the
inverse process. A summary of the involved equations may be seen in
Appendix B. As in other works, 𝑘1 is derived from the radionuclide
equilibrium distribution coefficient 𝑘𝑑 (provided for instance in (IAEA,
2004)) and a standard experimental value for 𝑘2 (Periáñez, 2009;
Periáñez et al., 2013, 2016b). Equations are summarized in Appendix B.
2. Model description
2.1. Tidal modelling
A two dimensional depth-averaged model was used to simulate tides
in the APG. Calculated elevations and currents are treated through
standard tidal analysis (Pugh, 1987, Chapter 4) and tidal constants (amplitudes and phases) are then calculated and stored for each grid cell
in the computational domain. Five constituents were considered: three
semidiurnal (𝑀2 , 𝑆2 and 𝑁2 ) and two diurnal (𝐾1 and 𝑂1 ). Tidal model
1
/>2
Progress in Nuclear Energy 142 (2021) 103998
R. Periáñez
Fig. 1. Map of the APG, which corresponds to the present model domain. Isobaths of 20, 40, 60, 80 and 100 m are drawn. The locations of Bushehr and Barakah NPPs are also
shown.
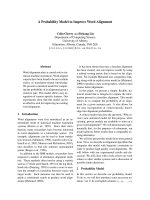
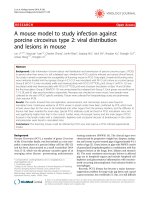
Fig. 2. General scheme of the modelling procedure. The user must specify only release data and other. Equilibrium arguments and nodal factors for year 2021 are set as default
option.
and simulation time, radionuclide properties (decay constant and equi-
2.4. Model input
librium distribution coefficient (which may be obtained from IAEA
(2004) as mentioned above), and, finally, an optional wind forecast
A number of files specify the release characteristics (date, time,
(see next paragraph) and components of the currents to be used: tidal
position in geographic coordinates, depth, magnitude and duration)
currents and residuals may be individually switched on and off (to
3
Progress in Nuclear Energy 142 (2021) 103998
R. Periáñez
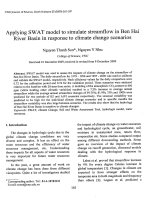
Fig. 3. Comparison between calculated and observed amplitudes for the semidiurnal (left) and diurnal (right) constituents considered in the model. The map in the top shows
points where tidal constants were measured (black dots).
Table 2
Input files which must be modified for each specific simulation. It is required to modify
tide-data.dat only if a simulation for other year than 2021 is to be carried out.
allow comparisons if they are included or not in the simulations or to
speed them up by removing tides in the calculations). These switches
are provided in a specific file named input.dat. The file tidedata.dat contains equilibrium arguments and nodal factors of the
5 tidal constituents for year 2021, set as default, as explained in
Appendix A. Thus, this file should be modified only if a simulation for
a different year is to be carried out. Equilibrium arguments and nodal
factors for the corresponding year should then be used. A list of the
input files which should be modified for a particular simulation is given
in Table 2.
In the case of a simulation to assess the effects of an acute release
due to an accident, for instance, it may be relevant to include a local
wind, which is considered uniform in the release area. Wind data are
provided in a file as a number of different ‘‘wind episodes’’ (any number
can be used with a maximum of 100), each one characterized by a wind
speed, direction and start and end times measured in hours after the
pollutant release beginning. This time-evolving wind conditions may be
obtained from weather forecasts. It should be commented that HYCOM
calculations already include atmospheric forcing. However, the present
tide-data.dat
release.dat
RN.dat
input.dat
wind.dat
Equilibrium arguments and nodal factors
Release data and simulation time
Contaminant properties (decay constant and 𝑘𝑑 )
Switches to include or not tidal circulation
Local wind data
definition of ‘‘wind episodes’’ gives the opportunity of describing transport in case that an accident occurs, for instance, during a local storm
which is not described in HYCOM. The need of adding this local
wind in some oil spill simulations in the Red Sea was clearly shown
in Periáñez (2020a) and was also used in a radionuclide transport
model for the same sea (Periáñez, 2020b). The wind-induced current
is considered to decrease logarithmically to zero from the surface. The
mathematical form of this profile may be seen in Pugh (1987), for
instance. It should be clearly pointed out that using this ‘‘local wind’’ is
4
Progress in Nuclear Energy 142 (2021) 103998
R. Periáñez
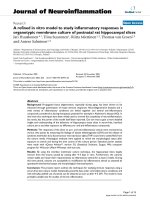
Fig. 4. Calculated chart for the 𝑀2 tide. Phases are given with respect to the local time meridian (adapted phases).
Fig. 5. Calculated chart for the 𝑂1 tide. Phases are given with respect to the local time meridian (adapted phases).
optional and should be included only if a wind forecast is known and
it includes unusual weather conditions. Otherwise atmospheric forcing
already included in HYCOM calculations is enough for the transport
calculations.
thick sediment layer. In addition, the model provides the position of
particles (both in the water column and in sediments) at the end of the
simulation. All this information may be drawn with the Octave scripts
which are provided with the model.
A general scheme of the modelling procedure is presented in Fig. 2.
All required inputs are in blue boxes. The marine data is pre-computed
and does not require any action by the user, which only needs to modify
the release data and other. Once input is defined, the transport code
(pink) performs the calculations and provides output (green).
The number of particles used in the model is 200 000. A simulation
over three months takes about 10 min on a desktop PC working over
Ubuntu 18.04 operating system. All the required codes were written in
Fortran.
2.5. Model output
The model output consists of radionuclide concentrations over the
model domain in two water layers: a surface layer whose thickness is
defined as 10 m, but can be changed by the user in the code, and a deep
layer which extends from the bottom of the surface layer to the seabed.
Actually, the model provides the radionuclide inventory in units/m2 in
the deep layer. Concentrations in bed sediments are provided in a 5 cm
5
Progress in Nuclear Energy 142 (2021) 103998
R. Periáñez
Fig. 6. Water circulation as downloaded from HYCOM model at the end of four months of the year for the sea surface. Only one of each 16 vectors is drawn for more clarity.
(53◦ E, 25◦ N) approximately. In contrast, diurnal tides show a single
one. In case of the 𝑂1 tide it is located approximately at (52◦ E, 27◦ N).
These locations are in agreement with those presented in Akbari et al.
(2016).
Fig. 6 presents a few examples of surface water circulation as
calculated by HYCOM model at the end of the indicated months. Circulation is essentially cyclonic in January and anticyclonic in September,
showing the well-known surface inflow of Indian Ocean waters along
the Iranian coast (Johns et al., 2003). A cyclonic eddy is also apparent
in the northern part in July. Actually, it was found, through numerical
simulations, that in summer the north-westward coastal current flowing
along Iran evolves into a series of mesoscale anticyclonic eddies with
typical diameter about 120 km. One of these eddies was apparent in
the northern region of the Gulf (Thoppil and Hogan, 2010).
3. Results
3.1. Hydrodynamics
The tidal model was calibrated changing the bed friction coefficient
until the best agreement between calculated and observed (from Pous
et al. (2012)) tidal elevations was achieved. Such agreement was
measured as 𝜒 2 , according to the equation (Glover et al., 2011):
𝜒2 =
𝑁
𝑜𝑏𝑠
𝑐𝑎𝑙 2
1 ∑ (𝑍𝑖 − 𝑍𝑖 )
𝑁 𝑖=1
𝜎2
(1)
𝑖
where 𝑁 is the number of observations, 𝑍𝑖𝑜𝑏𝑠 and 𝑍𝑖𝑐𝑎𝑙 are observed
and calculated elevations respectively, and finally 𝜎𝑖 is the uncertainty
in each measurement, taken as 0.01 m according to the observations
presented in Pous et al. (2012). A comparison between observed and
calculated elevations for the five constituents may be seen in Fig. 3.
Although agreement is generally good, there are stations where higher
discrepancies appear. Most likely it is due to the relatively coarse
resolution of the model: tides where simulated using the same grid
as HYCOM, which is 0.08◦ . Using a finer grid would improve results,
but this would be overcome by errors and difficulties in interpolating
currents from one grid to the other in order to deal simultaneously with
tidal and baroclinic currents.
As a couple of examples, tidal charts for one semidiurnal (𝑀2 ) and
one diurnal (𝑂1 ) tide are respectively presented in Figs. 4 and 5. These
charts are in good agreement with earlier calculations made for the APG
(Pous et al., 2012; Hyder et al., 2013; Akbari et al., 2016). Thus, in the
case of the 𝑀2 tide there are two amphidromes, at (50◦ E, 28◦ N) and
3.2. Radionuclide dispersion
The model can be applied to any radionuclide, simply using its
specific distribution coefficient and radioactive decay constant. Here
we present some examples with 137 Cs and 239,240 Pu, which have very
different geochemical behaviours: the first is quite conservative while
plutonium presents a high affinity to be fixed to sediment particles. A
summary of model runs which were carried out is presented in Table 3.
An hypothetical accident occurring at Bushehr NPP (coordinates
50.88◦ E, 28.82◦ N) was simulated. A 137 Cs release was supposed to
last 90 days, with a total activity released equal to 1 PBq. This is just an
example, but it is the same order of magnitude as the direct release from
Fukushima into the Pacific Ocean during the first three months after the
6
Progress in Nuclear Energy 142 (2021) 103998
R. Periáñez
Fig. 7. 137 Cs concentrations (logarithmic scale) in surface water (Bq/m3 ) and bed
sediments (Bq/kg) after 90 days of a release starting in March 21 in Bushehr NPP
(run 1). Details of the hypothetical accident are given in the text.
Fig. 8. 137 Cs concentrations (logarithmic scale) in surface water (Bq/m3 ) and bed
sediments (Bq/kg) after 90 days of a release starting in June 21 (run 2). Details of the
hypothetical accident are given in the text.
Table 3
Summary of model runs. Starting time of the releases was 12:00 h local time in all
cases (year 2021). Local wind was not included in any case and all tidal constituents
and residuals were considered. Release magnitude was 1 PBq during 90 days in all
runs.
Run
Run
Run
Run
Run
Run
Run
1
2
3
4
5
6
7
Radionuclide
Location
137
Bushehr
Bushehr
Bushehr
Bushehr
Bushehr
Bushehr
Barakah
Cs
137
Cs
137
Cs
137 Cs
137 Cs
239,240
137
Cs
Pu
NPP
NPP
NPP
NPP
NPP
NPP
NPP
Simulated time
Starting time
90 days
90 days
90 days
90 days
1 year
90 days
90 days
March 21
June 21
September 21
December 21
March 21
March 21
March 21
s−1 (half life of 30.17 year). The release was supposed to occur at
the sea surface and simulation time was 90 days. Four simulations
were carried out with different starting times: 21 March, 21 June, 21
September and 21 December. All releases were finally supported to start
at 12:00 h local time. The optional local winds are not included in these
calculations, but only the atmospheric forcing already described within
HYCOM model. The five tidal constituents and their residuals were
included (all switches in file input.dat set to 1). The simulations
shown as examples are relatively long (90 days) simply to illustrate
general transport patterns in the APG. In the case of an accident it may
be relevant to carry out short term (few days) simulations to support
decision-making and undertake preventing actions in the region around
the accident.
Maps of 137 Cs in surface water, taken as a 10 m thick layer, and
bed sediments after the simulations were obtained, which are presented
in Figs. 7 to 10. It seems clear that the starting time of the release
2011 tsunami (Kobayashi et al., 2013). The 137 Cs 𝑘𝑑 was fixed as 4.0
m3 /kg, which is the established value for coastal waters by IAEA (2004)
and radioactive decay constant for this radionuclide is 7.29 × 10⁻¹⁰
7
Progress in Nuclear Energy 142 (2021) 103998
R. Periáñez
Fig. 9. 137 Cs concentrations (logarithmic scale) in surface water (Bq/m3 ) and bed
sediments (Bq/kg) after 90 days of a release starting in September 21 (run 3). Details
of the hypothetical accident are given in the text.
Fig. 10. 137 Cs concentrations (logarithmic scale) in surface water (Bq/m3 ) and bed
sediments (Bq/kg) after 90 days of a release starting in December 21 (run 4). Details
of the hypothetical accident are given in the text.
affects the subsequent radionuclide distributions due to the temporal
variability of baroclinic circulation. Thus, if the release starts with
spring (Fig. 7) radionuclides move to the north and to the central
APG, then travelling to the south along the western side. Sediments
are contaminated as waters containing 137 Cs move over them. Since
the water/sediment interaction model is dynamic, sediments buffer
radionuclides which are later released as water above them is cleaned.
Thus, the concentration map for surface water is an instantaneous
picture of the radionuclide distribution at exactly that time; but the
map for sediments integrate the whole path followed by the release.
If the release starts with summer (Fig. 8), the sediment map indicates that transport has been predominantly directed to the north, while
it is directed to the south if the release starts with fall (Fig. 9). In this
case there is also some transport to the south along the western side, as
in Fig. 7. Finally, if the release starts with winter (Fig. 10) radionuclides
remain close to Bushehr NPP; transport is mainly directed to the south
along the Iranian coast and radionuclides do not reach the western
coast of the APG in the simulated temporal frame.
As a conclusion, it seems evident that the moment when an accident
occurs determines the fate of the released radionuclides and the portion
of the APG coast which is potentially contaminated. However, the four
simulations show that radionuclides do not reach the north extreme of
the APG. It can be probably attributed to the freshwater input from
Shatt Al Arab river (Tigris and Eufrates) at the Gulf head, although it
should be noted that the present day inflow is much smaller than it
once was because of dam projects in Turkey (Hyder et al., 2013).
The accident starting in March (Fig. 7) has been simulated during
one year and results are presented in Fig. 11; where 137 Cs concentrations in surface water, bed sediment and inventory of radionuclides in
the bottom water layer (from 10 m depth to the seabed), in Bq/m2 ,
may be seen. If the simulation time is extended, a significant amount of
radionuclides reach the bottom water layer and are able to contaminate
8
Progress in Nuclear Energy 142 (2021) 103998
R. Periáñez
Fig. 12. 239,240 Pu concentrations (logarithmic scale) in surface water (Bq/m3 ) and bed
sediments (Bq/kg) after 90 days of a release starting in March 21 (run 6). Details of
the hypothetical accident are given in the text.
but supposing that the released radionuclide was 239,240 Pu, whose recommended 𝑘𝑑 value is 100 m3 /kg according to IAEA (2004). Thus,
it is much more reactive than 137 Cs, presenting a higher affinity to
be fixed to the sediment. This can be clearly seen comparing Fig. 12,
which shows the plutonium results, with the previous Fig. 7: 239,240 Pu
is quickly fixed to the sediments in the release area, thus presents low
mobility in a shallow marine environment like the APG is.
Fig. 11. Same as Fig. 7 but for a one year long simulation (run 5). Inventory (Bq/m2 )
of 137 Cs in the bottom water layer is also shown. Note the different colour scales for
waters. Details of the hypothetical accident are given in the text.
As a final example, exactly the same accident as shown in Fig. 7 was
simulated for 137 Cs but occurring in Barakah NPP (coordinates 52.23◦
E, 23.97◦ N) in UAE. Thus, details on the release are presented above.
Concentrations resulting from this Barakah NPP release can be seen
in Fig. 13. In this case the released 137 Cs moves towards the Strait
of Hormuz, but currents in this region of the APG are weaker and
the extension of the contaminated area is much smaller than for the
previous simulation.
the bed sediments. Actually, virtually all the sediments of the APG
contain 137 Cs (Fig. 11). Radionuclides in the bottom water layer reach
the Strait of Hormuz, travelling with the deep outflow water, and will
leave the APG entering the Gulf of Oman.
The geochemical behaviour of the radionuclide affects the fate of
the release. For instance, the experiment shown in Fig. 7 was repeated
9
Progress in Nuclear Energy 142 (2021) 103998
R. Periáñez
sediments. These processes are described in a dynamic way using a
stochastic method. Tidal currents are obtained from a tide model which
is run and tested in advance; then tidal analysis is carried out and tidal
constants are stored in files which are later read by the transport model.
Thus, the tidal state at any time and position is obtained. Baroclinic
currents were downloaded from the well-known HYCOM ocean model.
The transport model is easy to setup for any situation since just requires the modification of a few input files specifying the radionuclide
and release characteristics. Running times are short (a few minutes for
a several day long simulation) even on a desktop PC, which makes it
appropriate for a rapid assessment of a hypothetical accident occurring
in the APG.
Some examples of radionuclide releases were simulated to illustrate
the functioning of the model. However, it was interesting to find that
even for a relatively long accident (three months), the moment when
releases start will affect the fate of the discharged radionuclides due
to the variability of baroclinic currents. As occurs in the Red Sea
(Periáñez, 2020a), the relevance of tides depends on the area of the
accident since tidal currents increase in straits and also depend on the
location of amphidromes. As shown in Section 3.1 tides are significant
in the APG and should be described within a transport model. Finally,
results for Cs and Pu are very different due to the different geochemical
behaviours of these radionuclides: Pu is very reactive, thus it is quickly
fixed to bed sediments and presents a low mobility in a shallow marine
environment, in comparison with Cs. Consequently, it is essential to
include water/sediment interactions in marine radionuclide transport
models if they are to be applied to some radionuclides.
The present model only provides radionuclide concentrations in
abiotic compartments (surface and deep waters and sediments). A
further step would be to incorporate a foodweb model which could
describe the adsorption of radionuclides by fish. Advances in this topic
are described in Maderich et al. (2014); Vives i Batlle et al. (2016) and
de With et al. (2021).
Declaration of competing interest
The authors declare that they have no known competing financial interests or personal relationships that could have appeared to
influence the work reported in this paper.
Acknowledgement
This work was partially supported by the Spanish Ministerio de
Ciencia, Innovación y Universidades project PGC2018-094546-B-I00
and Junta de Andalucía (Consejería de Economía y Conocimiento),
Spain project US-1263369.
Appendix A. Tidal model equations
The 2D depth-averaged barotropic hydrodynamic equations describing tide propagation are the following [see for instance (Kowalik and
Murty, 1993)]:
𝜕𝜁
𝜕
𝜕
+
(𝐻𝑢) +
(𝐻𝑣) = 0;
𝜕𝑡
𝜕𝑥
𝜕𝑦
𝜏
𝜕𝜁
𝜕𝑢
𝜕𝑢
𝜕𝑢
+𝑢
+𝑣
+𝑔
− 𝛺𝑣 + 𝑢 = 𝐴
𝜕𝑡
𝜕𝑥
𝜕𝑦
𝜕𝑥
𝜌𝐻
Fig. 13. 137 Cs concentrations (logarithmic scale) in surface water (Bq/m3 ), inventory
in the deep layer (Bq/m2 ) and concentration in bed sediments (Bq/kg) for a release
occurring in Barakah NPP (run 7). Details of the hypothetical accident are given in the
text.
𝜏
𝜕𝜁
𝜕𝑣
𝜕𝑣
𝜕𝑣
+𝑢
+𝑣
+𝑔
+ 𝛺𝑢 + 𝑣 = 𝐴
𝜕𝑡
𝜕𝑥
𝜕𝑦
𝜕𝑦
𝜌𝐻
(2)
(
(
𝜕2 𝑢 𝜕2 𝑢
+
𝜕𝑥2 𝜕𝑦2
𝜕2 𝑣 𝜕2 𝑣
+
𝜕𝑥2 𝜕𝑦2
)
;
(3)
,
(4)
)
where 𝑢 and 𝑣 are the depth averaged water velocities along the 𝑥
and 𝑦 axis respectively, ℎ is the undisturbed water depth, 𝜁 is the
displacement of the water surface with respect to the mean sea level,
due to tides, measured upwards, 𝐻 = ℎ+𝜁 is the total water depth, 𝛺 is
the Coriolis parameter (𝛺 = 2𝜔 sin 𝜆, where 𝜔 is the rotational angular
velocity of the Earth and 𝜆 is latitude), 𝑔 is gravity acceleration, 𝜌 is
seawater density and 𝐴 is the horizontal eddy viscosity. 𝜏𝑢 and 𝜏𝑣 are
4. Conclusions
A model which simulates the transport of radionuclides in the
Arabian/Persian Gulf was presented. The model is Lagrangian and
includes physical transport (advection by currents and diffusion due to
turbulence) plus radioactive decay and radionuclide interactions with
10
Progress in Nuclear Energy 142 (2021) 103998
R. Periáñez
scheme (Cushman-Roisin and Beckers, 2011). Actually, several Lagrangian radionuclide transport models were applied to the Pacific
Ocean (Periáñez et al., 2019b), some of them with constant and some
with Smagorinsky diffusivities, providing very similar results. Moreover, the horizontal diffusivity may be related to the grid spacing
according to a standard equation (Periáñez, 2005). Such equation leads
to a value equal to 7.4 m2 /s for the 0.08◦ resolution used in this model.
Thus 10 m2 /s is an appropriate value for the present resolution.
A first order accuracy scheme was used to describe advection. Nevertheless, Elliott and Clarke (1998) did not find improvements in results
using a second order accuracy scheme. Moreover, turbulence masks
small errors in the advection scheme in marine transport processes
(Elliott and Clarke, 1998).
The maximum size of the horizontal step given by the particle due
to turbulent mixing, 𝐷ℎ , is (Proctor et al., 1994; Periáñez and Elliott,
2002):
√
𝐷ℎ = 12𝐾ℎ 𝛥𝑡
(10)
friction stresses written, as usual, in terms of the following quadratic
law:
√
𝜏𝑢 = 𝑘𝜌𝑢 𝑢2 + 𝑣2 ;
√
(5)
𝜏𝑣 = 𝑘𝜌𝑣 𝑢2 + 𝑣2 ,
where 𝑘 is the bed friction coefficient, set after calibration.
All the equations were solved using explicit finite difference schemes
(Kowalik and Murty, 1993) with second order accuracy. Particularly,
the MSOU (Monotonic Second Order Upstream) was used for nonlinear terms in the momentum equations. Time step was fixed as 20
s to ensure numerical stability. As mentioned in the main body of the
paper, measurements in Pous et al. (2012) were used as open boundary
conditions.
Tidal sea surface elevation for the corresponding instant of time 𝑡 at
a given location, 𝑍(𝑡), is obtained from the calculated tidal amplitudes
and phases using the tidal prediction equation, which is (Parker, 2007;
Boon, 2011):
𝑍(𝑡) = 𝐻0 +
5
∑
𝐺𝑖 𝑓𝑖 cos(𝑤𝑖 𝑡 − 𝑔𝑖 + 𝑉𝑖 )
(6)
in the direction 𝜃 = 2𝜋𝑅𝐴𝑁, where 𝑅𝐴𝑁 is an uniform random number
between 0 and 1 and 𝛥𝑡 is time step in the Lagrangian model. This
equation gives the maximum size of the step. The real size at a given
time and for a given particle is obtained multiplying the equation
by another independent random number. This procedure is required
to ensure that a Fickian diffusion process (Proctor et al., 1994) is
simulated. Time step used to integrate the Lagrangian model was set
as 𝛥𝑡 = 600 s.
Similarly, the size of the vertical step is (Proctor et al., 1994;
Periáñez and Elliott, 2002):
√
𝐷𝑣 = 2𝐾𝑣 𝛥𝑡
(11)
𝑖=1
where 𝐻0 is the location datum, 𝑤𝑖 is frequency of constituent 𝑖, 𝐺𝑖
and 𝑔𝑖 are amplitude and phase (adapted phase, i.e., for the local time
meridian) for the corresponding location (these quantities are obtained
from the tidal analysis), 𝑓𝑖 is nodal factor and 𝑉𝑖 the equilibrium
argument of the constituent at Greenwich. Note that the sum extends
to 5 since this is the number of included constituents. Nodal factors and
equilibrium arguments for year 2021 are used. This implies that 𝑡 = 0
is at the beginning of this year, although values for any other year may
be used. As usual in this type of models (Proctor et al., 1994; Elliott
et al., 2001; Periáñez and Pascual-Granged, 2008) the same treatment
is given to tidal currents.
The tidal residual current is evaluated from the following equation
(Delhez, 1996):
𝑞⃗𝑟 =
⟨𝑞𝐻⟩
⃗
⟨𝐻⟩
given either upward or downward. 𝐾𝑣 is the vertical diffusion coefficient, set as 1.0 × 10⁻⁵ m2 /s (Elliott et al., 2001).
Radioactive decay is solved with a stochastic method (Periáñez and
Elliott, 2002). Decay probability is defined as:
(7)
𝑝𝑑 = 1 − 𝑒−𝜆𝛥𝑡
where 𝑞⃗𝑟 is the residual current vector (actually evaluated as a tidal
residual transport), 𝑞⃗ is the instantaneous tidal velocity vector and ⟨⟩
means time averaging over a tidal cycle.
where 𝜆 is the radioactive decay constant. A new random number is
generated. If 𝑅𝐴𝑁 ≤ 𝑝𝑑 the particle decays and is removed from the
computation.
A stochastic method is also applied to describe interactions between
dissolved radionuclides and the bed sediments. These interactions are
described in terms of a kinetic adsorption rate 𝑘1 and a desorption rate
𝑘2 (Section 2.3). The probability that a dissolved particle is adsorbed
by the sediment is:
Appendix B. Lagrangian transport model equations
Advection in a Lagrangian model is computed solving the following
equation for each particle:
𝜕𝐾ℎ
𝛥𝑡
𝜕𝑥
𝜕𝐾ℎ
𝛥𝑦 = 𝑉 𝛥𝑡 +
𝛥𝑡
𝜕𝑦
𝛥𝑥 = 𝑈 𝛥𝑡 +
(12)
(8)
𝑝𝑎 = 1 − 𝑒−𝑘1 𝛥𝑡
(9)
(13)
If a new generated independent random number is 𝑅𝐴𝑁 ≤ 𝑝𝑎 , then the
particle is adsorbed by the sediment. The probability that a particle
which is fixed to the sediment is redissolved is written as:
where 𝛥𝑥 and 𝛥𝑦 are the changes in particle position (𝑥, 𝑦); 𝑈 and 𝑈 are
water velocity components at the particle position and depth and for
the corresponding calculation time step, since currents change in time.
These currents are the simple addition of baroclinic currents (downloaded from HYCOM model) and tidal currents and residuals derived
from the tidal model described in Appendix A, since both models run
over the same computational grid. Note that daily HYCOM currents
are used for the baroclinic ones while tidal currents are deduced from
analytical functions in the form of Eq. (6) as explained in Appendix A.
Derivatives of the horizontal diffusion coefficient (𝐾ℎ ) prevent the
artificial accumulation of particles in regions were diffusion coefficients
are lower (Proehl et al., 2005). Nevertheless, these terms are not
relevant here since uniform values for 𝐾ℎ are used in this model.
Actually, a value equal to 10 m2 /s (the same as horizontal eddy viscosity in the tidal model) was used. The use of constant diffusivities is
just a simplification to speed up calculations, although more complex
descriptions could be implemented. An example is the Smagorinsky
𝑝𝑟 = 1 − 𝑒−𝑘2 𝜙𝛥𝑡
(14)
and the same procedure follows. 𝜙 is a correction factor that takes into
account that part of the sediment surface is hidden by surrounding
sediments. Thus, this part is not interacting with water.
The number of units corresponding to each particle, 𝑅 is deduced
from the number of particles in the simulation (𝑁𝑃 = 200 000 as
mentioned in Section 2.5) and the magnitude of the release 𝑀:
𝑀
(15)
𝑁𝑃
Then the concentration of radionuclides in the surface water layer of
each grid cell 𝐶𝑠𝑢𝑟𝑓 (𝑖, 𝑗) is:
𝑅=
𝐶𝑠𝑢𝑟𝑓 (𝑖, 𝑗) =
11
𝑅𝑁𝑠𝑢𝑟𝑓 (𝑖, 𝑗)
𝛥𝑥𝛥𝑦𝑑𝑝𝑖𝑐
(16)
Progress in Nuclear Energy 142 (2021) 103998
R. Periáñez
where 𝛥𝑥𝛥𝑦 gives the cell surface, 𝑁𝑠𝑢𝑟𝑓 (𝑖, 𝑗) is the number of particles in the surface layer of cell (𝑖, 𝑗) and 𝑑𝑝𝑖𝑐 is the surface layer
thickness (thus we consider only particles at depth less than 𝑑𝑝𝑖𝑐 ). The
radionuclide inventory in the deep water layer is given by:
𝐼𝑑𝑒𝑒𝑝 =
𝑅𝑁𝑑𝑒𝑒𝑝 (𝑖, 𝑗)
𝛥𝑥𝛥𝑦
IAEA, 2001. Generic Models For Use In Assessing The Impact Of Discharges Of
Radioactive Substances To The Environment. Safety Reports Series 19, Vienna.
IAEA, 2004. Sediment Distribution Coefficients and Concentration Factors for Biota in
the Marine Environment. Technical Reports Series 422, Vienna.
IAEA, 2019. Modelling Of Marine Dispersion And Transfer Of Radionuclides
Accidentally Released From Land Based Facilities. IAEA-TECDOC-1876, Vienna.
Johns, W.E., Yao, F., Olson, D.B., Josey, S.A., Grist, J.P., Smeed, D.A., 2003. Observations of seasonal exchange through the Straits of Hormuz and the inferred
freshwater budgets of the Persian Gulf. J. Geophys. Res. 108 (C12), 3391. http:
//dx.doi.org/10.1029/2003JC001881.
Kämpf, J., Sadrinasab, M., 2006. The circulation of the Persian Gulf: a numerical study.
Ocean Sci. 2, 27–41.
Kamyab, A., Azad, M.T., Sadeghi, M., Akhound, A., 2018. Dispersion simulation of
cesium-137 released from a hypothetical accident at the Bushehr nuclear power
plant in Persian Gulf. Int. J. Coastal Offshore Eng. 2 (3), 13–17.
Kobayashi, T., Nagai, H., Chino, M., Kawamura, H., 2013. Source term estimation of
atmospheric release due to the Fukushima Dai-ichi Nuclear Power Plant accident by
atmospheric and oceanic dispersion simulations. J. Nucl. Sci. Technol. 50, 255–264.
Kobayashi, T., Otosaka, S., Togawa, O., Hayashi, K., 2007. Development of a nonconservative radionuclide dispersion model in the ocean and its application to
surface cesium-137 dispersion in the Irish Sea. J. Nucl. Sci. Technol. 44, 238–247.
Kowalik, Z., Murty, T.S., 1993. Numerical Modelling of Ocean Dynamics. World
Scientific, Singapore.
Maderich, V., Bezhenar, R., Heling, R., With, G.de., Jung, K.T., Myoung, J.G., Cho, Y.K.,
Qiao, F., Robertson, L., 2014. Regional long-term model of radioactivity dispersion
and fate in the northwestern Pacific and adjacent seas: application to the Fukushima
Dai-ichi accident. J. Environ. Radioact. 131, 4–18.
Parker, B.B., 2007. Tidal Analysis and Prediction. NOAA Special Publication NOS
CO-OPS 3.
Periáñez, R., 2005. Modelling the Dispersion of Radionuclides in the Marine
Environment. an Introduction. Springer.
Periáñez, R., 2007. Chemical and oil spill rapid response modelling in the Strait of
Gibraltar-Alborán Sea. Ecol. Model. 207, 210–222.
Periáñez, R., 2009. Environmental modelling in the Gulf of Cadiz: heavy metal
distributions in water and sediments. Sci. Total Environ. 407, 3392–3406.
Periáñez, R., 2012. Modelling the environmental behavior of pollutants in Algeciras
Bay (south Spain). Mar. Pollut. Bull. 64, 221–232.
Periáñez, R., 2020a. A Lagrangian oil spill transport model for the Red Sea. Ocean Eng.
/>Periáñez, R., 2020b. Models for predicting the transport of radionuclides in the red
sea. J. Environ. Radioact. />Periáñez, R., Abril, J.M., 2014. A numerical modelling study on oceanographic conditions in the former Gulf of Tartessos (SW Iberia): tides and tsunami propagation.
J. Mar. Syst. 139, 68–78.
Periáñez, R., Bezhenar, R., Brovchenko, I., Duffa, C., Iosjpe, M., Jung, K.T.,
Kobayashi, T., Liptak, L., Little, A., Maderich, V., Min, B.I., Nies, H., Osvath, I.,
Suh, K.S., With, G.de., 2019a. Marine radionuclide transport modelling: Recent
developments, problems and challenges. Environ. Model. Softw. 122, 104523.
Periáñez, R., Bezhenar, R., Brovchenko, I., Duffa, C., Jung, K.T., Kobayashi, T.,
Lamego, F., Maderich, V., Min, B.I., Nies, H., Osvath, I., Outola, I., Psaltaki, M.,
Suh, K.S., With, G.de., 2016a. Modelling of marine radionuclide dispersion in IAEA
MODARIA program: lessons learnt from the Baltic Sea and Fukushima scenarios.
Sci. Total Environ. 569/570, 594–602.
Periáñez, R., Bezhenar, R., Brovchenko, I., Jung, K.T., Kamidara, Y., Kim, K.O.,
Kobayashi, T., Maderich, V.Liptak.L:., Min, B.I., Suh, K.S., 2019b. Fukushima137 Cs
releases dispersion modelling over the Pacific Ocean. Comparisons of models with
water, sediment and biota data. J. Environ. Radioact. 198, 50–63.
Periáñez, R., Elliott, A.J., 2002. A particle tracking method for simulating the dispersion
of non conservative radionuclides in coastal waters. J. Environ. Radioact. 58,
13–33.
Periáñez, R., Min, B.I., Suh, K.S., 2021. The transport, effective half-lives and age
distributions of radioactive releases in the northern Indian Ocean. Mar. Pollut.
Bull. 169, 112587.
Periáñez, R., Pascual-Granged, A., 2008. Modelling surface radioactive, chemical and
oil spills in the Strait of Gibraltar. Comput. Geosci. 34, 163–180.
Periáñez, R., Suh, K.S., Min, B.I., 2016b. The behaviour of137 Cs in the North Atlantic
Ocean assessed from numerical modelling: Releases from nuclear fuel reprocessing
factories, redissolution from contaminated sediments and leakage from dumped
nuclear wastes. Mar. Pollut. Bull. 113, 343–361.
Periáđez, R., z, M.Casas-R., Bolí var, J.P., 2013. Tidal circulation, sediment and
pollutant transport in Cádiz Bay (SW Spain): a modelling study. Ocean Eng. 69,
60–69.
Pous, S., Carton, X., Lazure, P., 2012. A process study of the tidal circulation in the
Persian Gulf. Open J. Marine Sci. 2, 131–140.
Proctor, R., Flather, R.A., Elliott, A.J., 1994. Modelling tides and surface drift in the
Arabian Gulf: application to the Gulf oil spill. Cont. Shelf Res. 14, 531–545.
Proehl, J.A., Lynch, D.R., McGuillicuddy, D.J., Ledwell, J.R., 2005. Modeling turbulent
dispersion on the North Flank of Georges Bank using Lagrangian particle methods.
Cont. Shelf Res. 25, 875–900.
Pugh, D.T., 1987. Tides, Surges and Mean Sea Level. Wiley, Chichester, p. 472.
(17)
where 𝑁𝑑𝑒𝑒𝑝 (𝑖, 𝑗) is the number of particles in cell (𝑖, 𝑗) at depth larger
than 𝑑𝑝𝑖𝑐 . Finally, radionuclide concentration in the bed sediment of
cell (𝑖, 𝑗) is:
𝐶𝑠𝑒𝑑 (𝑖, 𝑗) =
𝑅𝑁𝑑𝑒𝑒𝑝 (𝑖, 𝑗)
𝛥𝑥𝛥𝑦𝐿𝜌𝑠
(18)
where 𝑁𝑠𝑒𝑑 (𝑖, 𝑗) is the number of particles in the bed sediment of cell
(𝑖, 𝑗), 𝐿 is sediment thickness (set as 0.05 m as mentioned in Section 2.5)
and 𝜌𝑠 is sediment bulk density:
𝜌𝑠 = 𝜌𝑚 (1 − 𝑝𝑜𝑟)
(19)
where 𝜌𝑚 = 2600 kg∕m3 is mineral particle density and 𝑝𝑜𝑟 is sediment
porosity. A number of parameters are defined within the code, whose
values are selected from standard ones or previous works. Thus, porosity is set as 𝑝𝑜𝑟 = 0.6, the desorption kinetic rate as 𝑘2 = 1.16 × 10⁻⁵
s−1 , the sediment correction factor as 𝜙 = 0.1 and the water surface
layer thickness as 𝑑𝑝𝑖𝑐 = 10 m. Of course, these values may be changed
if desired.
References
Abdi, M.R., Faghihian, H., Kamali, M., Mostajaboddavati, M., Hasanzadeh, A., 2006.
Distribution of natural radionuclides on coasts of Bushehr, Persian Gulf, Iran. Iran.
J. Sci. Technol. Trans. A 30 (A3), 259–269.
Akbari, P., Sadrinasab, M., Chegini, V., Siadatmousavi, M., 2016. Tidal constituents
in the Persian Gulf, Gulf of Oman and Arabian Sea: a numerical study. Indian J.
Geo-Marine Sci. 45 (8), 1010–1016.
Al-Ghamdi, H., Al-Muqrin, A., El-Sharkawy, A., 2016. Assessment of natural radioactivity and137 Cs in some coastal areas of the Saudi Arabian gulf. Mar. Pollut. Bull.
104, 29–33.
Al-Rabeh, A.H., Lardner, R.W., Gunay, N., 2000. Gulfspill version 2.0: a software
package for oil spills in the Arabian Gulf. Environ. Model. Softw. 15, 425–442.
Alosairi, Y., Pokavanich, T., 2017. Seasonal circulation assessments of the Northern
Arabian/Persian Gulf. Mar. Pollut. Bull. 116, 270–290.
Batlle, J.Vives.i., Beresford, N., Beaugelin-Seiller, K., Bezhenar, R., Brown, J.,
Cujic, M.Jing-Jy.Cheng., Dragovic, S.S., Duffa, C., Fievet, B., Hosseini, A.,
Jung, K.T., Kamboj, S., Kobayashi, T.Dong-Kwon.Keum., Kryshev, A., Poire, D.Le.,
Maderich, V., Periáñez, R.Byung.Il.Min., Sazykina, T., Suh, K.S., Yu, C., Wang, C.,
Heling, R., 2016. Inter-comparison of dynamic models for radionuclide transfer to
marine biota in a fukushima accident scenario. J. Environ. Radioact. 153, 31–50.
Bleck, R., 2001. An oceanic general circulation model framed in hybrid
isopycnic-Cartesian coordinates. Ocean Model. 4, 55–88.
Boon, J.D., 2011. Secrets of the Tide. Woodhead Publishing, USA.
Cushman-Roisin, B., Beckers, J.M., 2011. Introduction To Geophysical Fluid Dynamics.
Elsevier.
de With, G., Bezhenar, V., Maderich, Y., Yevdin, M., Iosjpe, F., Qiao, R., Periáñez, R.,
2021. Development of a dynamic food chain model for assessment of the radiological impact from radioactive releases to the aquatic environment. J. Environ.
Radioact. 233, 106615.
Delhez, E.J.M., 1996. On the residual advection of passive constituents. J. Mar. Syst.
8, 147–169.
Elliott, A.J., Clarke, S., 1998. Shallow water tides in the firth of forth. Hydrograph. J.
87, 19–24.
Elliott, A.J., Wilkins, B.T., Mansfield, P., 2001. On the disposal of contaminated milk
in coastal waters. Mar. Pollut. Bull. 42, 927–934.
Environmental Agency Abu Dhabi, 2009. Abu Dhabi Water Resources Master Plan.
Environmental Agency Abu Dhabi, Abu Dhabi.
Faghihifard, M., Badri, M.A., 2016. Simulation of oil pollution in the Persian Gulf near
Assaluyeh oil terminal. Mar. Pollut. Bull. 105, 143–149.
Glover, D.M., Jenkins, W.J., Doney, S.C., 2011. Modeling Methods for Marine Science.
Jenkins, W, J Doney, S.C Cambridge University Press, UK.
Hassanvand, M., Mirnejad, Z., 2019. Hydrodynamic model of radionuclide dispersion
during normal operation and accident of Bushehr nuclear power plant. Prog. Nucl.
Energy 116, 115–123.
Hyder, P., While, J., Arnold, A., O’Dea, E., Furner, R., Siddorn, J., Martin, M., Sykes, P.,
2013. Evaluating a new NEMO-based Persian/Arabian Gulf tidal operational model.
J. Oper. Oceanograph. 6 (1), 3–16.
12
Progress in Nuclear Energy 142 (2021) 103998
R. Periáñez
Thoppil, P.G., Hogan, P.J., 2010. A modeling study of circulation and eddies in the
Persian Gulf. J. Phys. Oceanogr. 40 (9), 2122–2134.
Tsabaris, C., Tsiaras, K., Eleftheriou, G., Triantafyllou, G., 2021.137 Cs ocean distribution
and fate at East Mediterranean Sea in case of a nuclear accident in Akkuyu Nuclear
Power Plant. Prog. Nucl. Energy 139, 103879.
Uddin, S., Fowler, S.W., Behbehani, M., Al-Ghadban, A.N., Swarzenski, P.W., AlAwadhi, N., 2020. A review of radioactivity in the Gulf region. Mar. Pollut. Bull.
159, 111481.
Yao, F., Johns, W.E., 2010a. A HYCOM modeling study of the Persian Gulf: 1. Model
configurations and surface circulation. J. Geophys. Res. 115 (C11017).
Yao, F., Johns, W.E., 2010b. A HYCOM modeling study of the Persian Gulf: 2. Formation
and export of Persian Gulf water. J. Geophys. Res. 115 (C11018).
13