Simultaneous authentication of species identity and geographical origin of shrimps: Untargeted metabolomics to recurrent biomarker ions
Bạn đang xem bản rút gọn của tài liệu. Xem và tải ngay bản đầy đủ của tài liệu tại đây (1.92 MB, 10 trang )
Journal of Chromatography A, 1599 (2019) 75–84
Contents lists available at ScienceDirect
Journal of Chromatography A
journal homepage: www.elsevier.com/locate/chroma
Simultaneous authentication of species identity and geographical
origin of shrimps: Untargeted metabolomics to recurrent
biomarker ions
Niladri S. Chatterjee a,b,∗ , Olivier P. Chevallier a,c , Ewa Wielogorska a,d,e , Connor Black a ,
Christopher T. Elliott a
a
Institute for Global Food Security, School of Biological Sciences, Queen’s University Belfast, United Kingdom
ICAR-Central Institute of Fisheries Technology, Cochin, India
c
Mass Spectrometry Core Technology Unit, Queen’s University Belfast, United Kingdom
d
School of Pharmacy, Queen’s University Belfast, United Kingdom
e
University of Chemistry and Technology, Department of Food Analysis and Nutrition, Prague, Czech Republic
b
a r t i c l e
i n f o
Article history:
Received 2 November 2018
Received in revised form 18 February 2019
Accepted 1 April 2019
Available online 3 April 2019
Keywords:
Untargeted metabolomics
Chemometrics
Biomarker identification
Shrimp fraud
Species authentication
a b s t r a c t
Mandatory disclosure of the species identity, production method, and geographical origin are embedded in the regulations and traceability systems, governing international seafood trade. A high-resolution
mass spectrometry-based metabolomics approach could simultaneously authenticate the species identity and geographical origin of commercially important shrimps. The highly innovative approach spared
the need for multiple testing methods which are in routine use currently. A robust chemometric model,
developed using the metabolite fingerprint dataset, could accurately predict the species identity of the
shrimp samples. Subsequently, species-specific biomarkers were discovered and a tandem mass spectrometry method for authentication of the species was developed. Two other chemometric models from
the metabolomics experiment accurately predicted the geographical origin of king prawns and tiger
prawns. The study has shown for the first time that food-metabolomics along with chemometrics can
simultaneously check for multiple seafood fraud issues in the global seafood supply-chain.
© 2019 The Authors. Published by Elsevier B.V. This is an open access article under the CC BY license
( />
1. Introduction
Fisheries and aquaculture products are a major source of livelihood and sustenance for billions of people globally. The Food and
Agriculture Organisation of the United Nations (FAO) has estimated
the annual export trade of seafood alone to US$150 billion [1].
Unfortunately, seafood is also one of the most prominent food categories associated with food fraud, undermining the credibility of
the whole seafood supply chain [2,3]. Seafood fraud not only threatens health and safety of consumers, also puts our oceans and other
water resources at risk [4]. Shrimps and prawns are considered as
a valuable seafood product that accounts for about 15% of the total
value of internationally traded fishery and aquaculture products
amounting to about US$43 billion [5]. Scandals, such as fraudulent
∗ Corresponding author at: ICAR-Central Institute of Fisheries Technology, Cochin28, Kerala, India.
E-mail addresses: niladri ,
(N.S. Chatterjee).
labeling of low value species as premium species of shrimps and
labeling aquaculture white leg shrimp (Litopenaeus vannamei) as
premium wild caught shrimp have been reported by international
environmental nonprofit groups [6]. Disturbing reports of slave
labour in Thailand shrimp industry have surfaced in the media,
prompting the food industry giant Nestle to initiate stringent measures to prevent human rights abuses in the seafood supply chain
in Thailand [7].
International laws entitle consumers to know the commercial
identity of the species, production method (wild caught or farmed)
and geographical origin for all categories of fishery and aquaculture
products. Together, these three pieces of information constitute
the “Traceability” of a seafood product [8,9]. DNA profiling based
techniques are considered gold standard for species authentication of seafood. However, success of the approach heavily relies
on the availability of comprehensive reference sequence libraries.
Authentication of geographical origin and production method using
DNA based techniques is highly challenging and reports of such
application are very few [10–12]. Similarly proteomics strategies are mostly suitable for authentication of species identity and
/>0021-9673/© 2019 The Authors. Published by Elsevier B.V. This is an open access article under the CC BY license ( />
76
N.S. Chatterjee et al. / J. Chromatogr. A 1599 (2019) 75–84
detecting adulteration of ingredients [13–15]. Among the techniques used to determine the geographical origin and production
method of seafood, multi-element and stable isotope ratio analysis
approaches are the most successfully employed [5,16]. However,
these different analytical techniques often require complex sample preparation, different types of analytical platforms and often
long assay run times. This is a significant disadvantage while trying
to manage traceability in a fast-moving, complex supply chain of
perishable seafood.
The complete set of metabolites synthesized in a biological
system constitute its ‘metabolome’ and is directly linked to an
organism’s genetic make-up, food intake and changes in the environment, it lives in [17]. The targeted metabolomics approach
emphasizes on detection and quantification of a few classes of
compounds, mostly using a unit resolution mass spectrometer.
Unit resolution mass spectrometer with triple quadrupole mass
analyzer has the advantage of using selective reaction monitoring (SRM) or multiple reaction monitoring (MRM) mode,
detecting the target compounds at trace level in complex matrices. Untargeted metabolomics which intends to study the global
‘metabolite fingerprint’ of a sample have several advantages
over targeted approach such as combining targeted and untargeted screening, novel biomarker discovery and retrospective
data analysis. Over the last five years, high-resolution mass
spectrometer (HRMS) has established itself as the preferred analytical choice in untargeted metabolomics research, driven by
increased affordability, unsurpassed sensitivity and high resolution [18–20]. HRMS based untargeted metabolomics coupled with
the power of chemometrics data analysis can potentially investigate multiple authenticity issues within a single experiment
[21,22].
HRMS based metabolite fingerprinting and chemometrics have
been used for authentication of seafood/fish only on two previous instances. Metabolite fingerprinting on a two dimensional gas
chromatography and time of flight mass spectrometry was used to
distinguish two bivalve species [23]. A Rapid evaporative ionisation
mass spectrometry (REIMS) based metabolomics profile approach
was reported recently for accurate identification of species identity
of five different white fish fillet [24]. To our knowledge, HRMS based
untargeted metabolomics approach has not been so far applied to
test multiple food fraud issues in a single metabolomics experiment.
In this study, we aim to explore the feasibility of authenticating species identity, geographical origin, and production method of
commercially important shrimps and prawns in a single untargeted
metabolomics experiment.
2. Materials and methods
2.1. Samples collection
Authentic samples were collected either directly from aquaculture farms linked to the ICAR-Central Institute of Fisheries
Technology in India or through a number of supermarket supply chains in the United Kingdom. Five commercially important
species of shrimps; tiger prawn (Penaeus monodon), king prawn
(Litopenaeus vannamei), Indian white shrimp (Fenneropenaeus indicus), Indian pink shrimp (Metapenaeus monoceros) and Argentinian
red shrimp (Pleoticus muelleri) were considered for developing
chemometric models for species authentication. The tiger prawn
samples included wild caught prawns from India and Madagascar; and farmed prawns from Vietnam and Sri Lanka. Farmed king
prawns were obtained from India, Thailand, Vietnam, and Honduras. The samples were transported to the laboratory within 24 h
in insulated polystyrene boxes with dry ice and stored frozen at
−80 ◦ C following removal of the head and outer shell. The samples
were freeze-dried immediately afterwards and stored in labelled
polypropylene containers at −80 ◦ C.
2.2. Samples preparation
Ten individual shrimp samples were pooled together to obtain
one representative sample for a class of shrimp, labeled based on
species identity and country of origin. Likewise, for a particular
class of shrimp three representative samples were obtained. As
pre-treatment, the freeze-dried samples were homogenized in a
planetary ball mill (Retsch GmbH PM 200, Haan, Germany). Then,
0.05 g (±1%) of pulverized samples was weighed out on a Discovery DV215CD Analytical Balance (Ohaus Europe GmbH, Nanikon,
Switzerland) into 1.5 mL micro centrifuge tubes. Next, the samples were extracted with 1 mL of aqueous methanol containing one
part ultra-pure water (18.2 M /cm, Merck Millipore, Billerica, USA)
and four parts LC–MS grade Chromasolv methanol (Sigma-Aldrich,
St Louis, MO, USA) by mixing at 2500 rpm with DVX-2500 Multitube Vortexer (VWR International, Lutterworth, UK) for 10 min,
followed by sonication for 30 min at maximum frequency in a
camSonix C1274 water bath sonicator (Camlab, Cambridge, UK) at
room temperature. After centrifugation at 10,000×g for 10 min at
4 ◦ C in a MIKRO 200R centrifuge (Hettich UK, Salford, UK), 0.8 mL
of the supernatant was transferred into a fresh microcentrifuge
tube and dried overnight in a miVac QUP-23050-A00 (Genevac,
Ipswich, UK) centrifugal sample concentrator. The dry extracts
were then reconstituted in 0.8 mL of ultra-pure water and filtered
through a 0.22 m Costar® cellulose acetate Centrifuge Tube Filter by centrifugation at 10,000xg, 4 ◦ C for 10 min. Filtered extracts
were transferred into LC vials (Waters, Manchester, UK) for LC–MS
analysis.
2.3. Untargeted LC-HRMS analysis
Analyses were carried out on a Waters Acquity UPLC I-Class
system (Milford, MA, USA) coupled to a Waters Xevo G2-S QToF
mass spectrometer (Manchester, UK) with an electrospray ionisation source operating in a positive or negative mode with lock-spray
interface for real time accurate mass correction. Instrument settings were as follow: source temperature was set at 120 ◦ C, cone gas
flow at 50 L h−1 , desolvation temperature at 450 ◦ C, and desolvation
gas flow at 850 L h−1 . The capillary voltage was set at 1.0 kV in positive mode and 0.5 kV in negative mode, respectively. Source offset
was 80 (arbitrary unit). Mass spectra data were acquired in continuum mode using MSE function (low energy: 4 eV; high energy:
ramp from 20 to 30 eV) over the range m/z 100–1200 with a scan
time of 0.1 s A lock-mass solution of Leucine Enkephalin (1 ng mL−1 )
in methanol/water containing 0.1% formic acid (1:1, v/v) was continuously infused into the MS via the lock-spray at a flow rate of
10 L min−1 . The chromatographic separation was conducted on a
Waters Cortecs T3 column (100 mm × 2.1 mm, 1.6 m). The column
oven temperature was set at 45 ◦ C, injection volume at 3.5 L and
flow rate at 0.4 mL min−1 . The mobile phase consisted of (A) water
with 0.1% formic acid and (B) methanol with 0.1% formic acid. The
gradient was set as follows: 2.0 min of 99% (A) followed by a linear
increase from 1% to 99% (B) over 16 min, isocratic cleaning step at
99% (B) for 0.5 min, then returned to initial conditions 99% (A) over
0.1 min and column equilibration step at 99% (A) for 1.4 min. Each
sample was injected three times in order to assure reproducibility.
At the beginning of the experiment, 10 pooled conditioning samples
(QCs) were injected. For quality control, QCs were also injected at
intervals of every 10 samples throughout the entire experiment to
determine the chromatographic reproducibility of retention times
and peak intensities [25].
N.S. Chatterjee et al. / J. Chromatogr. A 1599 (2019) 75–84
2.4. Chemometric data analysis
Raw data generated were imported to Progenesis QI 2.0 software
(Waters, Newcastle, UK). After data conversion to the appropriate
format using a filter set at 1.5, data were aligned to the best QC
sample selected and peak picking from 0.6 to 18 min was carried
out with sensitivity set at absolute ion intensity of 1000 (arbitrary unit) and chromatographic peak width to 0.08 min A data
matrix of detected metabolite features and corresponding normalised abundance was generated and then exported to SIMCA
14 (Umetrics, Malmo, Sweden) for multivariate analysis. To assess
the general quality of the acquired spectral data (univariate/Pareto
scaled) principal component analysis (PCA) and model assessment
were performed. Next, data were mean centred, either Pareto
or univariate scaled and grouped into respective classes prior to
orthogonal partial least square discriminant analysis (OPLS-DA).
The variable importance in projection (VIP) plots of the metabolite
features associated with OPLS-DA, and subsequent cross-checking
of the features in Progenesis QI for peak quality and intensity
ensured selection of reliable metabolite features. R2 (cumulative),
Q2 (cumulative) values and RMSECV were used to determine the
validity of the models, with R2 (cum) employed as an indicator of
the variation described by all components in the model and Q2 &
RMSECV as measures of how accurately the model can predict class
membership.
2.5. Biomarker discovery and method transfer to LC–MS/MS
The discovery of characteristic biomarkers for each shrimp
species was achieved by generating individual OPLS-DA models
during binary species comparison. Associated S-plots and variable
importance in projection (VIP) plots enabled identification of a set
of most promising ions in both ionisation modes responsible for
class separation among all species. Selected ions were thoroughly
investigated in both the raw data and Progenesis QI 2.0 for the
peak quality and intensity as well as selectivity between assessed
species. Accurate mass of the biomarker ions was searched against
the metabolite databases ChemSpider, LipidBlast, Metlin, Human
Metabolome Database and FooDB to reveal putative identities.
Biomarkers, which were selective to the species identity were
further investigated by targeted analysis. The retention time of
biomarkers was confirmed on a Xevo TQ-S LC–MS/MS in selected
ion monitoring mode applying the same chromatographic conditions (described in Section 2.3.) as in the untargeted analysis. Next,
the fragmentation spectrum obtained in daughter ion scan was
compared to respective spectrum acquired on Q-ToF to confirm
markers chemical identity. After optimising collision energies by
repeated on-column injections, the most prominent fragment(s) of
each biomarker’s precursor were selected for its respective MRM
window and chromatographic conditions adjusted to decrease
analysis time. None of these selected biomarkers were successfully
identified; nevertheless, the minimal requirements of reporting
for unknown metabolites (retention time, prominent ion and fragment ion) specified by the Chemical Analysis Working Group
within Metabolomics Standards Initiative (MSI) have been fulfilled [26]. To assure correct identification up to three fragment
ions were included in the final MS method, however, some of the
selected markers only yielded one fragment ion, thus decreasing
their reliability due to lack of possibility of ion ratios monitoring
[27].
2.6. Targeted LC–MS/MS analysis
The analysis was performed on an Acquity UHPLC I-Class system
(Waters, Milford, MA, USA) coupled to Xevo TQ-S triple quadrupole
mass analyser (Waters, Manchester, UK) operating in positive elec-
77
trospray ionisation mode. The following settings were applied:
capillary voltage was set at 1.0 kV, the desolvation and source temperatures were set at 450 and 130 ◦ C, respectively, while nitrogen
cone and desolvation flow rates were set to 145 and 1000 L/h.
Argon was employed as a collision gas, with a flow of 0.15 mL/min,
yielding a collision cell pressure of 2.4 × 10⁻³ mBar. Inter-scan and
-channel delays were both set to 3 ms while dwell times ranged
from 20 to 163 ms.
Analytes’ separation was performed on a Waters Cortecs T3 column (100 mm × 2.1 mm, 1.6 m), maintained at 45 ◦ C with a 5 L
injection of a sample extract. The pump was operated at a flow
rate of 0.4 mL/min with mobile phases consisting of A, 0.1% formic
acid in water and B, 0.1% formic acid in methanol. The final gradient was isocratic 0–1.0 min 80% A, linear 1.0–2.0 min 75% A, linear
2.0–4.0 min 20% A, linear 4.0–6.5 min 10% A, linear 6.5–7.0 min 1%
A for column flush, going back to initial conditions during 0.1 min
and finishing with isocratic column equilibration 7.1–9.0 min. After
each injection, the needle was washed with 0.1% formic acid in
H2 O/MeCN/MeOH (2:1:1) and purged mobile phase A.
LC–MS/MS method assessment was performed by analysing test
samples, representing each sample class, on three different days.
An initial run consisted of 33 samples - three samples per class
while last two runs consisted of 55 samples – five samples per class.
Samples were randomized in each run with ‘solvent-QC-solvent’
sequence injected every 8 samples to monitor for possible carryover, ion ratios alteration or sensitivity loss throughout the run. The
initial test samples were part of the authentic samples collected
but were not used in developing the chemometric models. Test
samples, purchased from local supermarkets were tested using the
targeted assay and authenticated against the label claim.
The relative abundance of the species specific markers of king
prawn and tiger prawn, varying with geographical origin, was
evaluated. Raw data were processed by Target Lynx v.4. (Waters,
Milford, MA, USA) while statistical analysis (one-way ANNOVA,
based on absolute response) and associated graphs were prepared
in GraphPad Prism 5.01 (GraphPad Software, Inc., La Jolla, USA).
A linear discriminant analysis (LDA) model for prediction of geographical origin, using the Unscrambler X software (Camo), was
developed for the specific markers of king prawns. The model was
evaluated to predict the geographical origin of 60 test samples of
king prawns which were part of the authentic samples gathered for
the project.
3. Results and discussion
3.1. High resolution mass spectrometry data processing and
quality valuation
Liquid chromatography hyphenated to a QToF mass spectrometer, with data acquired in continuum mode, is a powerful tool for
unbiased record of accurate mass data of every single detectable
metabolite in complex biological samples. However, the major
bottleneck in such “global metabolomics” experiments is the
unmanageable amount of data generated which necessitates the
employment of robust tools for data visualization, pre-processing
and metabolite identification to ensure quality and reproducibility of the data [28,29]. The untargeted metabolomics experiments,
in positive and negative ionisation mode, generated more than
1200 gigabytes of raw data each. The data was imported into the
Progenesis QI software and was checked for quality by reviewing
the retention time alignment of each sample against a randomly
selected QC sample. Alignment scores of the samples ranged from
82.9 to 98.2% and 88.5 to 98.0% in positive and negative ionisation mode respectively; indicating excellent reproducibility of
the data for the entire duration of the mass spectrometry exper-
78
N.S. Chatterjee et al. / J. Chromatogr. A 1599 (2019) 75–84
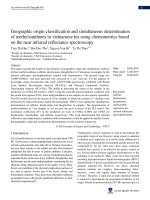
Fig. 1. Eleven different types of shrimps and pool QC samples clustering on PCA scores plot in ESI+ (A) and ESI (B) mode.
iment. Various “minimum intensity” values for the “absolute ion
intensity” filter were tried to optimise peak peaking sensitivity
of the Progenesis QI software. This optimisation was important
to ensure that the detected molecular features are authentic and
at the same time relevant features are not missed. For each setting, the data matrix for all eleven different types of shrimps was
imported in SIMCA 14 software for PCA analysis and subsequent
evaluation. A minimum intensity value of 1000, both in positive
and negative ionisation mode was found to be optimum. Nevertheless, a total of 24,411 molecular features were detected in
positivie ionisation mode whereas in negative ionisation mode a
total of 4921 molecular features were detected. All QCs were found
to be tightly clustered within the centre of respective PCA scores
plots. PCA scores plot in ESI+ and ESI mode showed clear indication of separation between different classes of shrimp, using
second & fourth and second & fifth principal components respectively (Fig. 1A, B). The first six principal components explained
80 and 81% of variation in positive and negative ionisation mode
respectively.
Though, farmed king prawn samples from different geographical origin grouped close by, there were clear indication of
discrimination based on geographical origin. Similarly, there was
clear indication of separation between farmed and wild caught tiger
prawns. The recorded high values of R2X (cum) and Q2 (cum) for
the PCA models (Table 1; No. 1 and 2) in the ESI+ and ESI mode,
indicate well explained cumulative variation of the data by the principal components and excellent prediction capability of the models
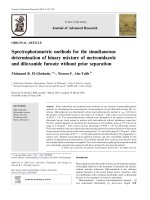
[30]. Representative total ion chromatograms (TICs) of QC samples
in ESI+ and ESI mode, presented in the Fig. 2., show the extent
of complex and rich information obtained from the untargeted
metabolomics experiment.
3.2. Chemometric models for shrimp species authentication
For building the models for shrimp species authentication, samples of the species originating from different geographical origin
and harvesting method was grouped as one species class. This
resulted in total five species classes of shrimps. The datamatrix was
exported to SIMCA 14 and exploratory PCA and OPLS-DA models
were built using either univariate or Pareto scaling. The VIP values
of the molecular features in an OPLS-DA plot was used to select
the most relevant features. Metabolite ions with a VIP > 1 generally
represent those features carrying the most relevant information
for class discrimination [31]. Hence, the molecular features with
VIP score of more than 1.5 was tagged and re-imported to Progenesis QI software to crosscheck the peak quality and intensity of the
features. A number of rounds of such filtering of the detected molecular features ensured selection of most relevant metabolite features
that contribute in classification of different classes of shrimp.
Finally, PCA (No. 3 & 4) models were generated considering
4914 and 900 molecular features in positive and negative ionisation
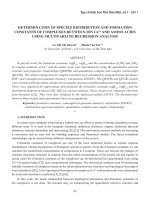
mode respectively (Table 1). The PCA scores plots (Fig. 3A, B), both
in positive and negative ionisation mode, showed clear separation
based on the species identity of the shrimp samples. The species
class of “Black tiger prawn” and “King prawn” represent samples
of different origin or production method. Despite this variability
of origin/production method, the samples of king prawn and black
tiger prawn formed distinctive clusters in the PCA plots. Whilst first
four components accounted for around 80% cumulative variation in
the data, separation was mostly achieved along PC1 and PC2. The
better values of R2X and Q2 for the PCA models (No. 3 & 4) as compared to the PCA models No 1 and 2 (Table 1), indicated reliable
selection of most relevant features.
N.S. Chatterjee et al. / J. Chromatogr. A 1599 (2019) 75–84
79
¯ mode showing extent of metabolite signature obtained from the shrimp
Fig. 2. Representative total ion chromatograms (TICs) of pool QC samples in ESI+ (A)and ESI(B)
samples.
¯ mode; OPLS-DA scores plot of species discrimination of shrimp
Fig. 3. Five different shrimp species and pool QC samples clustering on PCA scores plot in ESI+ (A) and ESI(B)
¯ mode.
in ESI+ (C) and ESI(D)
80
N.S. Chatterjee et al. / J. Chromatogr. A 1599 (2019) 75–84
Table 1
Values of different statistical parameters for developed chemometric models from detected metabolite features in positive and negative ionisation mode, where “A” is number
of multivariate component, “N” is number of samples, “R2X” is the fraction of the variation of the X variables explained by the model, “R2Y” is the fraction of the variation of
the Y variables explained by the model, Q2 is the fraction of the variation of the X and Y variables that denotes the prediction ability of the model.
No.
Type
A
N
R2X (cum)
1.
2.
3.
4.
5.
6.
7.
8.
9.
10.
PCA-X
PCA-X
PCA-X
PCA-X
OPLS-DA
OPLS-DA
OPLS-DA
OPLS-DA
OPLS-DA
OPLS-DA
12
17
12
16
4 + 1+0
5 + 2+0
3 + 1+0
3 + 1+0
3 + 1+0
3 + 1+0
125
125
125
121
99
99
36
36
36
36
0.962
0.985
0.988
0.995
0.911
0.927
0.925
0.975
0.966
0.989
R2Y (cum)
Q2 (cum)
Description
0.996
0.989
0.998
0.994
0.999
0.997
0.944
0.975
0.982
0.991
0.995
0.988
0.998
0.993
0.999
0.996
Positive mode; Univariate scaling; All classes of shrimp
Negative mode; Univariate scaling; All classes of shrimp
Positive mode; Univariate scaling; Species of shrimp
Negative mode; Univariate scaling; Species of shrimp
Positive mode; Univariate scaling; Discrimination of Species
Negative mode; Univariate scaling; Discrimination of Species
Positive mode; Univariate scaling; Discrimination of Tiger Prawn origin
Negative mode; Pareto scaling; Discrimination of Tiger Prawn origin
Positive mode; Univariate scaling; Discrimination of King Prawn origin
Negative mode; Pareto scaling; Discrimination of King Prawn origin
For predictive analysis, an OPLS-DA model (No. 5) was then autofitted with four predictive X-Y components and one orthogonal
components, which resulted in R2X = 91.1%, R2Y = 99.6%, Q2 = 99.5%
and RMSECV of 4% for the ESI+ data (Table 1). Another OPLSDA model (No 6) with five predictive X-Y components and two
orthogonal components was generated with resulting R2X = 92.7%,
R2Y = 98.9%, Q2 = 98.8% and RMSECV of 5.2% for the ESI data
(Table 1). A high value for R2Y and Q2 (closer to 1) indicate high
explained variation and predictive ability of an OPLS-DA model
respectively. Whereas, a lower value of RMSECV indicate better
predictive ability of an OPLS-DA model [25]. The different classes of
shrimp species appeared as better separated and tightly grouped
clusters in the OPLS-DA scores plots in ESI+ as compared to ESI
mode (Fig. 3C, D), in accordance to the better statistical parameters
obtained in ESI+ mode.
3.3. Chemometric models for shrimp origin authentication
OPLS-DA models for the dataset in ESI+ than ESI mode were
developed for prediction of geographical origin of the “Tiger
prawns” and the “King prawns”. A similar strategy, followed for
species authentication of shrimp samples, was adopted for selection of the most relevant molecular features that contribute to
discrimination of geographical origin of tiger prawns and king
prawns. The OPLS-DA models for tiger prawns in ESI+ than
ESI mode were finally built on datasets containing 1602 and
2081 molecular features respectively. The OPLS-DA models in ESI+
mode was autofitted with three predictive X-Y components and
one orthogonal component resulting in R2X (cum) = 92.5%, R2Y
(cum) = 99.8%, Q2 (cum) = 99.8% and RMSECV = 2.5%. The OPLSDA
model in ESI mode, fitted with similar numbers of predictive and orthogonal components resulted in equally good values
of R2X (cum) = 97.5%, R2Y (cum) = 99.4%, Q2 (cum) = 99.3% and
RMSECV = 4% (Table 1, No 7 & 8). Interestingly, the samples of wild
caught tiger prawns from India and Madagascar clustered closer
together (shown within ellipse) in the OPLS-DA scores plots in
ESI+ and ESI mode (Fig. 4A, B); strongly indicating discrimination
based on harvesting method. Samples of wild caught and farmed
tiger prawns from the same country of origin were not available
to further explore such discrimination in detail. Similarly, OPLS-DA
scores plots for king prawns displayed well separated and tightly
grouped clusters of king prawns originated from India, Thailand,
Vietnam and Honduras (Fig. 4C, D). Again, the values of R2Y (cum)
and Q2 (cum) was close to 1 establishing strong predictive capabilities of the models in ESI+ and ESI mode (Table 1. No 9 & 10).
3.4. Validation of the chemometric models
The recognition ability for all the classification models both in
positive and negative ionisation mode was 100% as presented in the
corresponding misclassification tables (Supplementary material
Figure S1). A misclassification table which provides a quantitative measure of the performance of a class or discriminant analysis
model is a summary of the number of correctly classified observations, with known class belonging. All the OPLS-DA classification
models were then validated using the response permuatation
option in SIMCA. The Y-data in the training set is permuted by
randomly shuffling their position while the numeric value remain
same. The permutation procedure can be repeated a number of
times between 20 and 100. The R2Y and Q2Y values of the derived
models from the permuted Y-data are then compared with the R2Y
and Q2Y values of the real model to check the validity of the classification model. The permutation plots for the OPLS-DA models
presented in supplementary material Figure S2-S4 summerizes the
result of response permutation testing. It can be observed that even
after 100 permutations, the R2Y and Q2Y values of the developed
OPLS-DA models are substantially higher than the corresponding
permuted values indicating validity of the models. The R2Y intercept below 0.3 and Q2Y intercept below 0.05 for the developed
OPLS-DA models are another strong indication of the validity of
the models. To further confirm the prediction ability of the developed models, 20 percent of the samples from the original training
set was taken out and used as test sample set in the corresponding
refitted model. It can be observed in the classification list (Supplementary Table S1-S6) that all the test samples of known class
identity was recognised accurately. The untargeted metabolomics
experiment was repeated three times with fresh sample sets and
each time rugged chemometric models were derived establishing
reproducibility of the approach.
3.5. Biomarker discovery and putative identification
A total of 36 biomarkers were putatively identified in ESI+ mode
¯
while a total of 33 ions were putatively identified in ESImode
based on various accurate mass database search (Supplementary
Table S7-S8). Putative identification of metaboloite corresponds
to Identification Level 3 of metabolomics standard initiative [26].
A metabolite may produces multiple accurate mass signals corresponding to isotopes (12C, 13C), adducts ([M+H]+, [M + Na]+),
multimers ([2M+H]+), charges ([M+2 H]2+), and neutral loss fragments ([M+H-H2O]+) in a HRMS. Signal annotation was performed
in Progenesis QI software clustering isotopes, based on the isotopic
pattern of a given molecule. The adducts of a molecule sharing the
same retention time was clustered and translated into one value
(molecular ion). However, where only one adduct is available for
a feature the m/z value of the pseudo molecular ion was reported.
These accurate masses can be searched against database(s) within a
defined window to retrieve potential candidates. An in-built search
engine in Progenesis QI was used to search the accurate masses
against various databases. A mass error of less than 2 ppm and
isotope similarity of more than 80% was considered as criteria
for reporting identity. A meta-library developed within Progen-
N.S. Chatterjee et al. / J. Chromatogr. A 1599 (2019) 75–84
81
¯ mode; OPLS-DA scores plot for
Fig. 4. OPLS-DA scores plot for discrimination of tiger prawn originated from India, Madagascar, Srilanka, and Vietnam in ESI+ (A) and ESI(B)
¯ mode.
discrimination of king prawn originated from Honduras, India, Thailand, and Vietnam in ESI+ (C) and ESI(D)
esis QI using the identified biomarkers was successfully used to
identify the metabolites in shrimp samples during subsequent
metabolomics experiments. A set of 34 biomarkers exclusive to the
species identity of a shrimp samples were discovered following the
workflow presented in supplementary material Figure S5. Presence
of these exclusive biomarkers were further confirmed by analysing
the individual raw data files in Masslynx 4.1 software and was further investigated in LC–MS/MS for developing a targeted method
of shrimp authentication. Unfortunately identity of these exclusive
biomarkers could not be established with reasonable confidence by
accurate mass database search.
3.6. LC–MS/MS targeted method for shrimp authentication
During the development and assessment of LC–MS/MS targeted
method 34 markers were initially evaluated for selectivity in the
first run. Overall, 17 biomarkers were deemed species specific
(Table 2). Due to lack of full chemical identification, all biomarkers were assigned arbitrary IDs stemming from the species names
and a consecutive number in which they were analysed. For each
of the analysed shrimps species at least one specific molecule was
selected i.e. king prawn (KP1), tiger prawn (TP1, TP 4–7), Indian
pink shrimp (IPS1 and 4), Indian white shrimp (IWS4, 5, 7, 11) and
Argentinian red shrimp (ARS 5 and 6). Nevertheless, other, less specific markers were also included in the method due to relatively low
cross-talk or to aid geographical origin elucidation i.e. KP2 and 3 for
king prawn and TP3 for tiger prawn (Table 2).
The selective markers provided a species specific response
throughout three assessment runs, whereby sample’s species was
assigned only in the presence of all assigned markers transitions with compliant ion ratios. The LC–MS/MS method proved
to be robust with no carry-over or sensitivity loss (QCs response
RSD < 10% for all markers, for 100 injection runs). Additionally, ion
ratios were in the range of ±20% of the mean QCs value for the
three analytical runs. Representative XIC of selected species specific
markers have been presented in supplementary material Figure S6.
To trial the assay with market place samples, three additional blind
runs consisting of total 76 samples of king prawns, 10 samples of
tiger prawns and 3 samples of each Argentinian red shrimp, Indian
white shrimp, and Indian pink shrimp were performed. Species of
the samples were correctly predicted for all the species assessed
yielding 0% false positives and negatives rate.
Three markers for king (KP1, KP2, and KP3) and tiger prawns
(TP3, TP4 and TP6) showed significant (p < 0.001) differences in
response between geographical origin within the assessed species
groups (Fig. 5a–f). The difference in relative response of the said
markers based on geographical origin is a strong indication that
it might be also possible to employ those markers for geographical origin authentication of shrimp on a unit resolution triple
quadrupole mass spectrometer platform.
Over the years the sensitivity of high resolution mass spectrometers has improved tremendously, enabling detection of even low
concentration compounds. However, a sizable number of recurrent molecular features in any metabolomics experiment remain
unknown. Chromatographic isolation of these unknown components for identification is often not practical due to low abundance.
Guessing the identity and then synthesizing the compound for
confirmation might also fail and is an expensive affair [32]. Defining these recurrent unidentified metabolites with accurate mass
and fragment ions/spectra is a practical solution to these problem.
In this study we have demonstrated that a class specific recurrent unidentified biomarker can be used successfully to develop
food authentication assays. The success of this approach was also
demonstrated for detection of adulteration in oregano [33].
4. Conclusions
The level of fraud in fisheries globally is a huge issue. There are
many measures in place and initiatives being developed to try and
lessen the impact this has on the integrity of seafood that is a staple in the diet of billions of citizens around the world. In terms of
the laboratory testing methods that support traceability systems,
there are quite a number of these and while they are fit for purpose
in terms of uncovering particular aspects of fraudulent practise
they can only provide evidence that one particular form of malpractice may have occurred. Here we report a highly innovative
approach using high resolution mass spectrometry and chemometrics that can distinguish the species identity and geographical
origin of shrimp in a single metabolomics experiment. Recurrent
species specific exclusive markers were identified from the untar-
82
Table 2
Details of the LC–MS/MS method for the 18 markers employed in species and geographical origin elucidations. Where: a cone voltage for all the compounds was set to 20 V, * markers deemed exclusive to the associated species.
Species
King Prawn
Marker
Retention Time [min]
Accurate mass [m/z]
Molecular ion [m/z]
1.73
820.4384
820.5
KP2
4.34
292.1575
292.2
KP3
0.91
310.1377
310.0
TP1*
3.18
967.4512
967.5
TP3
5.48
518.3234
518.3
TP4*
2.96
543.2995
543.3
TP5*
TP6*
TP7*
2.13
3.16
3.53
549.2211
726.1178
855.1091
549.2
726.1
855.1
IPS1*
2.22
804.4489
804.4
IPS4*
4.19
864.965
864.9
IWS4*
3.53
569.3147
569.3
IWS5*
3.85
599.0004
599.0
IWS7*
3.09
702.3815
702.4
IWS11*
3.11
1016.9582
1017
ARS5*
3.40
449.592
449.6
ARS6*
3.67
485.3513
485.3
Tiger Prawn
Indian Pink
Shrimp
Indian White
Shrimp
Argentinian
Red Shrimp
398.2
416.0
513.3
140.0
143.1
132.1
120.1
615.0
734.0
633.0
184.1
104.2
131.0
159.0
235.3
247.2
401.5
315.8
382.2
499.0
400.1
416.2
172.8
213.0
120.1
268.9
240.2
309.0
369.2
515.9
666.1
129.1
199.0
157.8
175.1
Dwell time [sec]
0.063
0.065
0.108
0.016
0.108
0.016
0.044
0.016
0.014
0.044
0.027
0.014
0.027
0.016
0.016
0.014
0.163
Collision Energy a [V]
40
40
40
20
20
20
20
40
30
40
20
20
20
20
20
20
20
20
40
40
30
20
20
20
20
20
20
20
20
20
20
20
20
20
20
Ion ratios
0.551
0.0022
N/A
0.261
0.212
0.471
0.159
0.959
0.237
0.231
N/A
N/A
N/A
0.947
0.650
N/A
0.605
0.329
0.344
0.258
0.920
0.203
0.832
N.S. Chatterjee et al. / J. Chromatogr. A 1599 (2019) 75–84
KP1*
Transitions [m/z]
N.S. Chatterjee et al. / J. Chromatogr. A 1599 (2019) 75–84
83
Fig. 5. Box plots representing differences in response of king prawn (a, b, c) and tiger prawn (d, e, f) markers depending on the geographical origin of the samples. Box plots
with median of the absolute response measured in five samples per each region and whiskers at 5th and 95th percentile. Significance levels: ***<0.001 and **<0.01.
geted metabolomics study and a LC–MS/MS assay was developed
for rapid authentication of species identity of the shrimps. The assay
was tested on unknown shrimp samples from the market and all
the samples tested were accurately classified based on the species
identity. Even though the identity of the recurrent exclusive markers could not be established, the markers were reproducible and the
MSI requirement for reporting an unknown metabolite was satisfied. Mislabelling of species identity and geographical origin are the
most prevalent forms of fraud in the seafood sector and cut across
many issues about the economics around fraud. The need to ensure
food being consumed around the world is not linked to the use of
modern day slavery and child labour is of critical importance. While
the presented method will not directly show if shrimps have been
produced using such practises but can provide invaluable evidence
that claims being made are false and may lead back to supply chains
that use such abhorrent practises. The models developed have been
shown to be very robust but can be considered as a first proof of
principle. A wide range of species of shrimps originated from many
regions are now required to build a unique database that can be
used as a tool by industry and regulatory agencies to police the
world shrimp trade.
Conflicts of interest
There are no conflicts of interest to report.
Acknowledgements
The authors gratefully acknowledge financial support received
from Science and Engineering Research Board (SERB) government
of India; in the form of SERB overseas postdoctoral fellowship No.
SB/OS/PDF-011/2015-16.
Appendix A. Supplementary data
Supplementary material related to this article can be found, in
the online version, at doi: />04.001.
References
[1] The State of World Fisheries and Aquaculture, 2018 (Accessed July 2018)
/>[2] M.Á. Pardo, E. Jiménez, B. Pérez, Villarreal, Misdescription incidents in seafood
sector, Food Control 62 (2016) 277–283, />2015.10.048.
[3] S.M. van Ruth, P.A. Lunging, I.C.J. Silvis, Y. Yang, W. Huisman, Differences in
fraud vulnerability in various food supply chains and their tiers, Food Control
84 (2018) 375–381, />[4] J. He, From country-of-origin labelling (COOL) to seafood import monitoring
program (SIMP): how far can seafood traceability rules go? Mar. Policy 96
(2018) 163–174, />[5] I. Ortea, J.M. Gallardo, Investigation of production method, geographical
origin and species authentication in commercially relevant shrimps using
stable isotope ratio and/or multi-element analyses combined with
chemometrics: an exploratory analysis, Food Chem. 170 (2015) 145–153,
/>[6] Shrimp: Oceana Reveals Misrepresentation of America’s Favourite Seafood,
2019 (Accessed January 2017) />reports/shrimpfraud.
[7] Thai Seafood Action Plan March, 2016 (accessed November 2017) https://
www.nestle.com/media/news/progress-in-tackling-seafood-supply-chainabuses.
[8] M. Bailey, S.R. Bush, A. Miller, M. Kochen, The role of traceability in
transforming seafood governance in the global South, Curr. Opin. Environ.
Sustain. 18 (2016) 25–32, />[9] L. Tinacci, D. Stratev, I. Vashin, I. Chiavaccini, F. Susini, A. Guidi, A. Armani,
Seafood labelling compliance with European legislation and species
84
[10]
[11]
[12]
[13]
[14]
[15]
[16]
[17]
[18]
[19]
[20]
[21]
[22]
[23]
N.S. Chatterjee et al. / J. Chromatogr. A 1599 (2019) 75–84
identification by DNA barcoding: a first survey on the Bulgarian market, Food
Control 90 (2018) 180–188, />˜
I. Ortea, A. Pascoal, B. Canas,
J.M. Gallardo, J. Barros-Velázquez, P. Calo-Mata,
Food authentication of commercially-relevant shrimp and prawn species:
from classical methods to Foodomics, Electrophoresis 33 (2012) 2201–2211,
/>D.I. Ellis, H. Muhamadali, D.P. Allen, C.T. Elliott, R. Goodacre, A flavour of
omics approaches for the detection of food fraud, Curr. Opin. Food Sci. 10
(2016) 7–15, />Y.T. Lo, P.C. Shaw, DNA-based techniques for authentication of processed food
and food supplements, Food Chem. 240 (2018) 767–774, />1016/j.foodchem.2017.08.022.
M.F. Mazzeo, R.A. Siciliano, Proteomics for the authentication of fish species, J.
Proteomics 147 (2016) 119–124, />007.
I. Ortea, G. O’Connor, A. Maquet, Review on proteomics for food
authentication, J. Proteomics 147 (2016) 212–225, />j.jprot.2016.06.033.
P. Ferranti, The future of analytical chemistry in foodomics, Curr. Opin. Food
Sci. 22 (2018) 102–108, />M. Costas-Rodríguez, I. Lavilla, C. Bendicho, Classification of cultivated
mussels from Galicia (Northwest Spain) with European protected designation
of origin using trace element fingerprint and chemometric analysis, Anal.
Chim. Acta 664 (2010) 121–128, />O. Fiehn, Metabolomics-the link between genotypes and phenotypes, Plant
Mol. Biol. 48 (2002) 155–171, />D. Cavanna, L. Righetti, C. Elliott, M. Suman, The scientific challenges in
moving from targeted to non-targeted mass spectrometric methods for food
fraud analysis: a proposed validation workflow to bring about a harmonized
approach, Trends Food Sci. Technol. 80 (2018) 223–241, />1016/j.tifs.2018.08.007.
K. Böhme, P. Calo-Mata, J. Barros-Velázquez, I. Ortea, Recent applications of
omics-based technologies to main topics in food authentication, Trends
Analyt. Chem. 110 (2019) 221–232, />005.
M. Castro-Puyana, R. Pérez-Míguez, L. Montero, M. Herrero, Application of
mass spectrometry-based metabolomics approaches for food safety, quality
and traceability, Trends Analyt. Chem. 93 (2017) 102–118, />10.1016/j.trac.2017.05.004.
S. Esslinger, J. Riedl, C. Fauhl-Hassek, Potential and limitations of non-targeted
fingerprinting for authentication of food in official control, Food Res. Int. 60
(2014) 189–204, />G.P. Danezis, A.S. Tsagkaris, V. Brusic, C.A. Georgiou, Food authentication:
state of the art and prospects, Curr. Opin. Food Sci. 10 (2016) 22–31, http://dx.
doi.org/10.1016/j.cofs.2016.07.003.
S.M. Rocha, R. Freitas, P. Cardoso, M. Santos, R. Martins, E. Fi gueira, Exploring
the potentialities of comprehensive two-dimensional gas chromatography
[24]
[25]
[26]
[27]
[28]
[29]
[30]
[31]
[32]
[33]
coupled to time of flight mass spectrometry to distinguish bivalve species:
comparison of two clam species (Venerupi sdecussata and Venerupis
philippinarum), J. Chromatogr. A 1315 (2013) 152–161, />1016/j.chroma.2013.09.049.
C. Black, O.P. Chevallier, S.A. Haughey, J. Balog, S. Stead, S.D. Pringle, M.V.
Riina, F. Martucci, P.L. Acutis, M. Morris, D.S. Nikolopoulos, Z. Takats, C.T.
Elliott, A real time metabolomic profiling approach to detecting fish fraud
using rapid evaporative ionisation mass spectrometry, Metabolomics 13
(2017) 153, />C. Black, S.A. Haughey, O.P. Chevallier, P. Galvin-King, C.T. Elliott, A
comprehensive strategy to detect the fraudulent adulteration of herbs: the
oregano approach, Food Chem. 210 (2016) 551–557, />1016/j.foodchem.2016.05.004.
L.W. Sumner, A. Amberg, D. Barrett, M.H. Beale, R. Beger, C.A. Daykin, T.W.M.
Fan, O. Fiehn, R. Goodacre, J.L. Griffin, T. Hankemeier, N. Hardy, J. Harnly, R.
Higashi, J. Kopka, A.N. Lane, J.C. Lindon, P. Marriott, A.W. Nicholls, M.D. Reily,
J.J. Thaden, M.R. Viant, Proposed minimum reporting standards for chemical
analysis Chemical Analysis Working Group (CAWG) Metabolomics Standards
Initiative (MSI), Metabolomics 3 (2007) 211–221, />s11306-007-0082-2.
Commission decision of 12 August 2002 implementing council directive
96/23/EC concerning the performance of analytical methods and the
interpretation of results (2002/657/EC), Off. J. Eur. Commun. 221 (2002) 8–36.
T. Kind, M. Scholz, O. Fiehn, How large is the metabolome? A critical analysis
of data exchange practices in chemistry, PLoS One 4 (2009) 440, .
org/10.1371/journal.pone.0005440.
G.A. Theodoridis, H.G. Gika, E.J. Want, I.D. Wilson, Liquid
chromatography–mass spectrometry based global metabolite profiling: a
review, Anal. Chim. Acta 711 (2012) 7–16, />2011.09.042.
L. Eriksson, P.L. Andersson, E. Johansson, M. Tysklind, Megavariate analysis of
environmental QSAR data. Part II – investigating very complex problem
formulations using hierarchical, non-linear and batch-wise extensions of PCA
and PLS, Mol. Divers. 10 (2006) 187–205, />H.W. Cho, S.B. Kim, M.K. Jeong, Y. Park, N. Gletsu, T.R. Ziegler, D.P. Jones,
Discovery of metabolite features for the modelling and analysis of
high-resolution NMR spectra, Int. J. Data Min. Bioinform. 2 (2008) 176–192.
S. Stein, Mass spectral reference libraries: an ever-expanding resource for
chemical identification, Anal. Chem. 84 (2012) 7274–7282, />10.1021/ac301205z.
E. Wielogorska, O. Chevallier, C. Black, P. Galvin-King, M. Delêtre, C.T.
Kelleher, S.A. Haughey, C.T. Elliott, Development of a comprehensive
analytical platform for the detection and quantitation of food fraud using a
biomarker approach. The oregano adulteration case study, Food Chem. 239
(2018) 32–39, />