Integration of three-phase microelectroextraction sample preparation into capillary electrophoresis
Bạn đang xem bản rút gọn của tài liệu. Xem và tải ngay bản đầy đủ của tài liệu tại đây (1.03 MB, 8 trang )
Journal of Chromatography A 1610 (2020) 460570
Contents lists available at ScienceDirect
Journal of Chromatography A
journal homepage: www.elsevier.com/locate/chroma
Integration of three-phase microelectroextraction sample preparation
into capillary electrophoresis
Amar Oedit a, Bastiaan Duivelshof a, Peter W. Lindenburg a,b,∗, Thomas Hankemeier a
a
b
Division of Systems Biomedicine and Pharmacology, Leiden Academic Centre for Drug Research, Einsteinweg 55, 2300 RA Leiden, the Netherlands
University of Applied Sciences Leiden, Faculty Science & Technology, Research Group Metabolomics, Mailbox 382, 2300 AJ, Leiden, the Netherlands
a r t i c l e
i n f o
Article history:
Received 11 July 2019
Revised 25 September 2019
Accepted 25 September 2019
Available online 26 September 2019
Keywords:
Electromembrane extraction
Electroextraction
Sample preparation
Capillary electrophoresis
Sample enrichment
Electrophoresis
a b s t r a c t
A major strength of capillary electrophoresis (CE) is its ability to inject small sample volumes. However,
there is a great mismatch between injection volume (typically <100 nL) and sample volumes (typically
20–1500 μL). Electromigration-based sample preparation methods are based on similar principles as CE.
The combination of these methods with capillary electrophoresis could tackle obstacles in the analysis of
dilute samples.
This study demonstrates coupling of three-phase microelectroextraction (3PEE) to CE for sample
preparation and preconcentration of large volume samples while requiring minimal adaptation of CE
equipment. In this set-up, electroextraction takes place from an aqueous phase, through an organic filter
phase, into an aqueous droplet that is hanging at the capillary inlet. The first visual proof-of-concept for
this set-up showed successful extraction using the cationic dye crystal violet (CV). The potential of 3PEE
for bioanalysis was demonstrated by successful extraction of the biogenic amines serotonin (5-HT), tyrosine (Tyr) and tryptophan (Trp). Under optimized conditions limits of detection (LOD) were 15 nM and
33 nM for 5-HT and Tyr respectively (with Trp as an internal standard). These LODs are comparable to
other similar preconcentration methods that have been reported in conjunction with CE. Good linearity
(R2 > 0.9967) was observed for both model analytes. RSDs for peak areas in technical replicates, interday
and intraday variability were all satisfactory, i.e., below 14%. 5-HT, Tyr and Trp spiked to human urine
were successfully extracted and separated. These results underline the great potential of 3PEE as an integrated enrichment technique from biological samples and subsequent sensitive metabolomics analysis.
© 2019 The Authors. Published by Elsevier B.V.
This is an open access article under the CC BY-NC-ND license.
( />
1. Introduction
Sample preparation is a crucial aspect of bioanalysis. The main
objectives of sample preparation are to purify and enrich analytes
prior to separation and detection. Commonly used sample preparation techniques are protein precipitation and partitioning based
techniques, e.g., solid phase extraction (SPE) and liquid–liquid
extraction [1,2]. In the past years, electromigration-based extraction methods have gained increased attention [3–5]. The main
principle behind electromigration-based techniques is the use of
an electric field to extract ions from a donor phase (optionally
through intermediate phases) to an acceptor phase. The migration
speed depends on the electrophoretic mobility of the analyte and
the electric field. The electric field strength is typically low in the
∗
Corresponding author.
E-mail addresses: ,
(P.W. Lindenburg).
acceptor phase and thereby leads to stacking and preconcentration of analytes. Electromigration-based techniques offer several
advantages over partitioning-based techniques, such as being able
to handle small sample volumes, enhanced extraction speeds (due
to the electric field being the driving force rather than partitioning
between phases) and ease of automation [4–6].
The combination of electromigration-based sample pretreatment with CE offers two main benefits. First, both approaches are
based on electromigration, so compounds that can be extracted are
also suited for CE separation. Second, electromigration-based techniques can help overcome one of the drawbacks of CE: there is a
great mismatch between the injected volume (typically <100 nL)
and the sample volume (typically 20–1500 μL). In order to overcome this mismatch miniaturized inserts have been developed [7].
However, when samples are too dilute and compounds fall below
detection limits this does not provide a solution. Electromigrationbased sample preparation can help overcome the mismatch that
is often present between injection volumes and sample volumes
/>0021-9673/© 2019 The Authors. Published by Elsevier B.V. This is an open access article under the CC BY-NC-ND license. ( />
2
A. Oedit, B. Duivelshof and P.W. Lindenburg et al. / Journal of Chromatography A 1610 (2020) 460570
in CE analysis and can offer significant advantages in loadability
compared to in-line stacking methods. On-line SPE-CE, where SPE
is coupled to the capillary, could also serve as a solution for enhancing the loadability, but has thus far only been demonstrated
for more apolar compounds on apolar cartridges [8]. Moreover, to
the best of our knowledge, no commercial solutions for SPE-CE are
available and setting them up is complex.
In electromembrane extraction (EME) a supported liquid membrane (SLM) is used to separate the donor from the acceptor phase.
The analytes are extracted through the SLM into the acceptor
phase using an electrical potential. Several set-ups in which EME
was coupled off-line to CE-UV and applied to bioanalysis have been
reported [6,9–15].
Off-line, at-line, as well as in-line coupling of EME to CE-UV
has been reported on several occasions. An off-line process consists of two steps (e.g. sample preparation followed by separation).
An at-line process combines the two steps via an automated
handler (e.g. a robot). An in-line process takes place within the
separation system (e.g. SPE-CE with sorbent inside the capillary).
An on-line process takes place right before the sample stream
enters the separation system, but does take place within the
analytical instrument (e.g. SPE-CE with sorbent outside the capillary) [16]. An example of on-line coupling of EME to CE-UV, is
nano-EME, for preconcentration and analysis of drugs. Here, basic
drugs were extracted from a sample volume of 200 μL, through a
membrane over a cracked capillary, into an acceptor of ∼8 nL. A
single SLM could last for more than 200 extractions. Enrichment
factors (EFs) ranging between 25 and 196 were reported for basic
drug compounds, corresponding to recoveries of 0.1% and 0.79%.
Under different conditions, higher EFs were obtained, up to 500
for loperamide [17]. Moreover, EME-CE for preconcentration and
analysis of basic drugs was reported. Here, an SLM was formed
between two conical polypropylene units and extraction took
place from the device, which was used as a vial insert. Extraction took place from a 40 μL donor compartment over the SLM
into an acceptor compartment of 40 μL and therefore it only
served for sample cleanup and not for sample preconcentration.
Recoveries ranging from 37% to 84% were obtained [18]. However,
the device requires reassembly for each new experiment, which
hampers automated analysis. Chui et al. integrated the free liquid
membrane (FLM) in an electrokinetic supercharging (EKS) method
in-line to further improve detection limits in CE. In this approach,
a small plug of immiscible organic solvent in the capillary was
used as filter during the electrokinetic sample injection to enhance
stacking efficiency. Analysis of cationic herbicides in environmental
water samples were used to evaluate the on-line preconcentration efficiency and results showed detection limit enhancements
of over 1500 times. EKS over an FLM using CE for analysis on
real-world samples has only been demonstrated on river water
samples, a relatively clean matrix. Since the donor phase is drawn
partially into the capillary, protein-rich samples could cause
reproducibility problems due to absorption to the fused silica
capillaries [19].
EME can be used without SLM. This offers several advantages,
such as not requiring reassembly and regeneration of the SLM. In
this case the technique is referred to as EME over an FLM [20] or
3PEE [21]. Off-line coupling of a EME-FLM extraction to CE-UV was
successfully demonstrated for analysis of charged basic drugs (nortriptyline, haloperidol and loperamide) in human urine and blood
[22].
Two-phase electroextraction (EE) is a process where charged
analytes are transferred from an organic donor phase into an aqueous acceptor phase using an electric field [23–25]. EE coupled to
CE was first reported in conjunction with isotachophoresis by Van
der Vlis et al. in 1994 [26].
Previously, we have reported 3PEE as a powerful preconcentration technique. Herein, we propose integration of this system into
a CE set-up for on-line sample clean-up and preconcentration. Raterink et al. demonstrated the extraction of acylcarnitines from a
50 μL donor phase, through a filter phase into a 2 μL acceptor
phase that was formed by a conductive pipet tip prior to direct
analysis with high-resolution mass spectrometry. In 3PEE, altering
the organic filter phase composition influences the selectivity and
enables selective extraction of desired analytes [21].
In this article, we demonstrate a proof-of-principle of a novel
on-line analytical system in which electromigration-based sample
preparation technique, i.e., 3PEE, is directly hyphenated to CE-UV.
Our method offers several advantages: automation, sample preconcentration and the ability to extract analytes from salt-rich matrices without sample preparation. In order to enable 3PEE the
electrode configuration of a commercially available CE apparatus
was modified. This modification entails placing an insulating sleeve
over the electrode whilst leaving the bottom part of the electrode
exposed. 3PEE-CE-UV permits automated on-line selective analyte
extraction and enrichment, directly from a dilute sample. In this
set-up the analytes are extracted from a sample vial containing a
two-phase liquid-liquid system, i.e., the aqueous sample and an
organic filter phase. Extraction takes place into a droplet of acceptor phase hanging at the capillary inlet in the organic filter
phase.
In a first series of experiments the process was visualized using the cationic dye CV to assess the stability of the droplet of acceptor phase during 3PEE. Then, the proposed method was evaluated using selected biogenic amine model compounds to evaluate its potential for bioanalysis of polar metabolites. In order to
enhance the CE separation, pH-mediated stacking was included
in the system. Consecutively, important extraction parameters (EE
voltage and EE time) and selectivity of the developed 3PEE-CEUV method were investigated to optimize extraction. Then, the
analytical performance of 3PEE-CE-UV was compared to conventional CE-UV. Finally, the performance of 3PEE-CE-UV as a sample preparation procedure for polar compounds in salt-rich biological samples was investigated by analysis of spiked human
urine samples in order to show its applicability for metabolomics
analyses.
2. Materials and methods
2.1. Chemicals and reagents
Sodium chloride (NaCl), CV, ammonium hydroxide (>25%), 5HT, Tyr and Trp were obtained from Sigma-Aldrich (Steinheim, Germany). Ethyl acetate (EtOAc) was obtained from Actu-All (Oss, The
Netherlands). Formic acid (FA) was obtained from Acros Organics
(Geel, Belgium). Sodium hydroxide was obtained from VWR (Amsterdam, The Netherlands). All solutions were of HPLC grade or
higher. Water was prepared using a Milli-Q R Advantage A10 R system (Billerica, MA, USA).
2.2. Samples and stock solutions
Aqueous stock solutions of analytes (2 mM) were stored at
−20 °C until use. Sample solutions were prepared at the desired
concentration by dissolving the aqueous stock solutions in 1 M FA
(pH 1.8) and were, at maximum, kept at 4 °C for 1 week. Human
urine was provided by a healthy volunteer and stored at −20 °C.
Prior to analysis, urine was thawed and centrifuged for 15 min at
10,0 0 0 rpm, the urine was spiked with the model analytes in the
desired concentration and FA was added until 1 M was reached in
urine.
A. Oedit, B. Duivelshof and P.W. Lindenburg et al. / Journal of Chromatography A 1610 (2020) 460570
2.3. Equipment and techniques
2.3.1. Capillary electrophoresis
Analyses were performed using a Beckman Coulter P/ACE MDQ
(Fullerton, CA, USA) CE apparatus using UV diode array detection.
A fused silica capillary of 50 μm I.D. and 365 μm O.D. with a total length of 60 cm was used (Polymicro Technologies, USA). New
capillaries were sequentially rinsed at 1379 mbar with MeOH for
10 min, 1 M NaOH for 10 min, water for 5 min and background electrolyte (BGE) for 20 min. Between runs, the capillaries were flushed
for 5 min with BGE.
Separation was performed using 1 M FA (pH 1.8) as the BGE
buffer using a separation voltage of +17.5 kV. The capillary cartridge temperature was set at 20 °C. Detection was set at 195 nm
to maximize the number and response of metabolites that can be
detected with a reference at 400 nm.
2.3.2. Software
32 Karat (Beckman Instruments, Fullerton, CA, USA) was used
for controlling the CE-UV system and for data acquisition. Injection
volumes as well as the volumes of the acceptor droplet formed
by reversed pressure were calculated using Sciex CE Expert V2.2
(Framingham, MA, USA).
3. Results and discussion
3.1. Modification of the CE instrument for three-phase
electroextraction
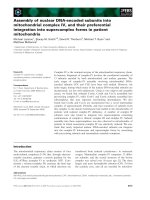
In order to enable 3PEE using a Beckman Coulter CE apparatus the electrode configuration was modified by replacing the existing electrode with a longer platinum electrode of 4 cm (Fig. 1B).
From the bottom 2.8 cm of the electrode was isolated using a polytetrafluoroethene (PTFE) sleeve, leaving only a tip of 2 mm of the
electrode exposed. This modification enables an electric field from
3
the donor phase through the FLM into the acceptor droplet. The
septa of the inlet vials were removed to ensure that the modified
electrode, which had a slightly increased thickness due to the PTFE
sleeve, could still reliably enter the vial.
In order to visually monitor the extraction process a USB-pen
video camera was mounted inside the CE machine and focused on
the capillary inlet. Debut Video Capture (NCH Software, Greenwood
Village, CO, USA) was used to record the extraction videos.
3.2. Three-phase electroextraction procedure
Prior to placing the sample vials in the CE system, 375 μL donor
solution was pipetted in conventional CE vials (1.5 mL). Based on
previous EE works the donor solution was acidified to 1 M FA,
which has proven to be a good donor solvent [23–25]. This was followed by 725 μL organic filter phase consisting of water-saturated
EtOAc, which is crucial for the electric field and thereby the transfer of ions through the organic filter layer [21]. Fig. 1 graphically
depicts a typical 3PEE experiment in the CE instrument. First, the
capillary was rinsed with FA. Then ammonium hydroxide solution
was injected, followed by an injection of BGE. After inserting the
capillary in the sample vial, a hanging droplet of 100 nL is created
in the organic filter phase by applying a pressure of −69 mbar for
1 min from the BGE outlet vial. Then, electroextraction was performed by applying the extraction voltage, after which the enriched droplet was retracted into the capillary. At last, the capillary
inlet was inserted into a BGE vial and separation was carried out.
In order to visualize the electroextraction procedure, the cationic
dye CV was added to the donor phase.
3.3. Visualization of on-line three-phase electroextraction
The setup for 3PEE hyphenated to CE-UV was based on the
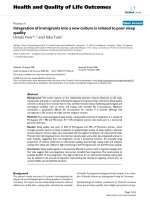
previously reported 3PEE-DI-MS [21]. In a visual proof-of-concept
10 μM CV was electroextracted at 3.5 kV from 375 μL donor phase
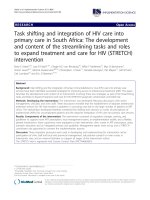
Fig. 1. (a) Schematic representation of the 3PEE setup, and (b) actual set-up incorporating the modified electrode configuration used during experiments (bottom of vial
not visible). (c) Schematic representation of the key steps in the extraction procedure in the CE-UV system: (1) injection of ammonium hydroxide, (2) injection of BGE, (3)
application of negative pressure, (4) application of voltage, (5) retraction of droplet using pressure, (6) vial switch to BGE and start of CE separation.
4
A. Oedit, B. Duivelshof and P.W. Lindenburg et al. / Journal of Chromatography A 1610 (2020) 460570
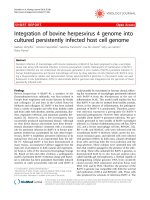
Fig. 2. Visualization of 3PEE coupled CE using CV. Video stills of: (A) initial conditions with sample vial containing 375 μL crystal violet (10 μM) and 725 μL watersaturated ethyl acetate; (B) end of droplet formation (∼100 nL, 1 M FA), outline of
droplet barely visible; (C) start 3PEE by application of 3 kV; (D) end of 3PEE after
10 min.
into ∼100 nL acceptor phase (Fig. 2A–C). The liquid-liquid interface
is not visible in the sample tray (see Supporting Information S1
for vial outside of sample tray). Prior to application of the extraction voltage, no CV can be observed in the droplet. This indicates
that the contribution of partitioning to the process is minimal. After 10 min electroextraction, the droplet was enriched dramatically
with CV (Fig. 2D).
These results indicate that the developed set-up is successfully
extracting CV from the donor phase into the pendant acceptor
phase.
3.4. On-line three-phase electroextraction coupled to capillary
electrophoresis
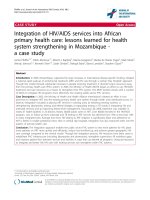
3.4.1. Effect of pH-mediated stacking
The 3PEE-CE-UV was investigated using the biogenic amines
Tyr, Trp and 5-HT. The BGE consisted of 1 M FA (pH 1.8) to ensure
compounds were cationic during analysis. In a first experiment,
500 nM model analytes were extracted for 6 min at 3 kV and the
droplet was partially retracted at 34 mbar for 5 s, followed by CE
separation at 17.5 kV for 30 min. In Fig. 3A it can be observed that
Trp and Tyr have poorly resolved peaks, with 5-HT overlapping.
The peak areas are higher despite reduced injection time compared
to Fig. 3B. This is caused by migration of analytes from the donor
phase through the droplet into the capillary (see Supporting Information S2). This can possibly be explained by peak broadening during 3PEE caused by electrophoresis and EOF, which is still
present to some extent, even at a low pH. In order to focus the
broad sample zone and thereby improve separation, a pH-mediated
stacking was included. By adding a plug of basic BGE after to the
acceptor phase, the acidic BGE titrates the sample solution to create a neutral zone. In this zone a higher field is present causing
increased migration speed of analytes and eventually stacking at
the interface between the neutral zone and BGE. This pH-mediated
stacking was created by injecting 15% ammonium hydroxide solution for 17 s at 34 mbar and followed by 1 M FA for 1.1 min at
69 mbar to ensure that the droplet consisted fully of BGE. The
biogenic amines were extracted at a concentration of 500 nM for
8 min at 3 kV. The droplet could now be retracted much longer
(1.5 min at 34 mbar) while the separation resolution improved as
shown in Fig. 3B.
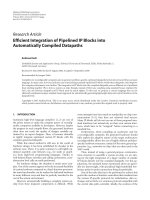
3.4.2. Optimization of extraction voltage and extraction time
The method was optimized in order to obtain the highest possible area under the curve (AUC) for the analytes. In the first series of experiments (n = 3) the extraction time was kept constant
at 5 min and the extraction voltage was varied (1, 1.5, 2, 2.5, 3, 4
and 5 kV). In these experiments 250 nM Trp, Tyr and 5-HT were
used. When 0 kV was used no analytes were detected (Fig. 4A).
This indicates that analyte migration from the donor phase to the
acceptor phase is solely driven by electric potential. Moreover, increasing the voltage up to 3 kV significantly enhanced signals for
Tyr, Trp and 5-HT compared to lower voltages (Fig. 4B and C). Voltages beyond 3 kV resulted in loss of current and droplet instability
(data not shown).
Subsequently, the extraction time was optimized while keeping
the extraction voltage constant at the optimal value of 3 kV. Extractions were performed for 2, 4, 6, 8 and 10 min. It was shown that
increasing the extraction time increased enrichment and thereby
peak areas of the analytes. Beyond 8 min of extraction caused frequent current losses during CE.
In summary, the optimized 3PEE procedure was as follows. First, the capillary was flushed with 1 M FA for 5 min
at 1378 mbar, followed by a 17 s 34 mbar injection of 15%
ammonium hydroxide and subsequent 1.1 min 69 mbar injection of 1 M FA. Then, a droplet was formed using 1 min
69 mbar, after which electroextraction was carried out at 3 kV for
8 min. Finally, the enriched droplet was retracted using 1.5 min
34 mbar and CE-UV separation was performed for 35 min at
17.5 kV.
3.4.3. Analytical figures of merit
Table 1 shows the analytical performance of the optimized
method for the biogenic amines 5-HT and Tyr in comparison with
conventional CE-UV. Trp was used as internal standard.
The aforementioned conditions were used to evaluate the extraction of 5-HT and Tyr using different concentrations (0, 0.05, 0.1,
0.5, 1, 5 μM; n = 3) resulting in a linear range of 0.01–5 μM, yielding regression coefficients (R2 ) of 0.9967 and 0.9995, respectively
(Table 1). LODs were estimated using signal-to-noise (S/N) ratios
of triplicate measurements at 50 nM and extrapolated to S/N = 3.
Detection limits of 15 nM and 33 nM were observed for 5-HT and
Tyr, respectively.
For comparison, calibration curves were constructed with
identical electrophoresis conditions using hydrodynamic injection
without pH-mediated stacking injecting 80 nL (similar to the retracted volume using the optimized 3PEE-CE-UV method) using
different concentrations (0, 1, 5, 10, 25, 50 μM; n = 3) of 5-HT
and Tyr with 25 μM Trp as internal standard. Since CE-UV could
not reach the nM range of 3PEE-CE-UV the examined range was
adjusted to a micromolar range to be able to construct a calibration curve (Table 1). Regression analysis yielded high R² values (exceeding >0.999) for 5-HT and Tyr with conventional CEUV and observed LODs for 5-HT and Tyr were 5 μM and 1 μM, respectively. The LODs for the 3PEE-CE-UV method were improved
∼333 × and ∼30 × for 5-HT and Tyr, respectively. Moreover, compared to conventional CE-UV, linear range of 3PEE-CE-UV was
extended an order of magnitude downwards to the 50–100 nM
range.
3.4.4. Repeatability and technical replicates
Intra- and inter-day variability of the method were determined
using optimized conditions at 500 nM. As shown in Table 2, intraday variability analysis showed good repeatability, as RSDs for AUC
values ranged from 4.7% for Tyr up to 6.9% for 5-HT. For inter-day
variability, RSD values ranged between 7.9% for Tyr and 13.8% for
5-HT, indicating good repeatability of the developed method. The
increased RSD values obtained compared to conventional CE can
be partially explained by the added steps, including droplet formation and extraction vs. hydrodynamic injection.
Technical replicates of a single sample vial showed similar variability. It was shown that five consecutive extractions could be performed successfully and resulted in RSD values of 6.6% for 5-HT
and 10% for Tyr, comparable to the 3PEE-CE-UV inter- and intraday variability (Table 2). Migration time repeatability of the new
method was comparable to hydrodynamic CE (Supporting Information S4).
A. Oedit, B. Duivelshof and P.W. Lindenburg et al. / Journal of Chromatography A 1610 (2020) 460570
5
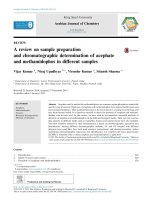
Fig. 3. Stacking effects in 3PEE coupled to CE-UV. Top figures show the current profile of extraction of 500 nM 5-HT (1), Trp (2) and Tyr (3) from 375 μl donor phase using
3PEE-CE-UV as well as the corresponding electropherograms. (A) retracting for 0.5 min at 6.9 mbar and (B) retracting for 1.5 min at 34 mbar with pH-mediated stacking.
A
B
2
1
3
C
60000
A U C o f a n a ly te s
A U C o f a n a ly te s
50000
50000
40000
30000
20000
10000
40000
30000
20000
10000
3
.5
0
E x t r a c t io n v o lt a g e ( k V )
8
6
4
2
2
2
.5
1
1
0
E x t r a c t io n t im e ( m in )
Fig. 4. 3PEE voltage and time optimization. Extractions were performed using 250 nM 5-HT (1), Trp (2) and Tyr (3) in 1 M FA. Electropherograms are shown for: (A) 0 kV
3PEE voltage and (B) 3 kV 3PEE voltage. (C) Results of voltage and time optimization for 3PEE coupled online to CE-UV. Error bars represent standard deviation of n = 3.
6
A. Oedit, B. Duivelshof and P.W. Lindenburg et al. / Journal of Chromatography A 1610 (2020) 460570
Table 1
Comparison the analytical performance of 3PEE-CE-UV and conventional CE-UV in neat solutions. AUCs were corrected using Trp as internal standard.
Analyte
5-HT
Tyr
Linear range (μM)
Sensitivity ± SD (×10− 2 AU/μM)
Intercept ± 95% CIa (×10− 2 AU/μM)
CE
3PEE
CE
3PEE
CE
5–50
1–50
0.05–5
0.1–5
2.54 ± 0.01
9.65 ± 0.06
102.2 ± 1.3
76.8 ± 2.6
−0.40 (−2.5–2.5)
1.67 (−3.5–6.9)
Linearity (R²)
LODb (μM)
3PEE
CE
3PEE
CE
3PEE
−2.10 (−11.6–7.4)
5.98 (−12.8–24.8)
>0.9999
0.9999
0.9995
0.9967
5
1
0.015
0.033
Note: for repeatability see Table 2.
a
No significant intercept values were observed (p < 0.05).
b
Extrapolation towards S/N of 3 from lowest measured concentration.
Table 2
Intra- and interday repeatability and technical replicates of 3PEE-CE-UV analysis of target compounds. AUCs were corrected using Trp as internal standard.
Analyte
5-HT
Tyr
a
3PEE-CE-UV intraday (n = 3)
CE-UV intraday (n = 3)
3PEE-CE-UV interday (n = 6)
3PEE-CE-UV technical replicatesa (n = 5)
Mean AUC ratio
RSD area ratio (%)
Mean AUC ratio
RSD area ratio (%)
Mean AUC ratio
RSD area ratio (%)
Mean AUC ratio
RSD area ratio (%)
0.34
0.44
6.9
4.7
0.12
0.50
1.85
0.87
0.35
0.43
13.8
7.9
0.41
0.43
6.6
10.0
Obtained from 5 consecutive extractions from a single sample vial.
3.4.5. Enrichment and recovery
In order to assess the performance of 3PEE-CE-UV correctly, the
extraction recovery (ER) and EF were calculated [6].
These results show that even though the EFmax is much greater,
enrichment was limited. Tyr in the acceptor phase was around 8
times more concentrated than the donor phase after extraction
(Supporting information S3). It was observed that the enrichment
factor of 5-HT was 41.4 and therefore five times higher than for
Tyr. A possible explanation for this is the lack of the carboxylic
acid moiety (pKa = 2.38) in 5-HT, thereby enabling more efficient
transfer from the FA containing donor phase. Likewise, a lower recovery was observed for Tyr (0.2%) than for 5-HT (1.1%) after extraction which correlates with the EF values. The improvements in
LOD in Table 1 differ from the obtained EF values as the developed method included both stacking through on-line electroextraction (increasing loading) and in-line stacking through a dynamic
pH-mediated stacking (improving peak shapes). Both techniques
are essential to the final method and therefore the final method
was compared to a simple hydrodynamic injection method (thus
without dynamic pH-mediated stacking). These results show that
the extraction process is not exhaustive and is a soft extraction
method, which offers several advantages such as opening up the
possibility of studying (bio)chemical reactions and concentrationtime monitoring without disturbing the overall system. EF and ER
can be further improved by reducing the volume (and thereby
height) of the organic phase to enhance the electric field distribution to be more favorable towards analyte extraction. Moreover,
the composition of the organic phase can be modified to enhance
EF and ER as well [21].
3.4.6. Comparison to other set-ups
A comparison of 3PEE-CE-UV method to other sample extraction techniques that were hyphenated directly to CE and reported
in literature is shown in Table 3 and Supporting Information S5.
Single drop micro-extraction (SDME) techniques have been coupled to CE [27,28] with EFs ranging between 130–150 and EME has
been coupled on-line to capillaries [17] with reported EFs ranging between 25–196, with loperamide reaching an EF of up to 500
under optimal conditions. On-line back extraction field amplified
sample injection relies on both partitioning between an organic
chloroform donor phase and an aqueous acceptor phase and simultaneous depletion of the acceptor phase via electrokinetic injection
into the capillary [29]. 3PEE-CE-UV bears similarities to the electrokinetic supercharging over FLM set-up, but differs in two ways:
(1) preconcentration takes place at the capillary inlet into a pendant droplet rather than inside the capillary, and (2) the electroki-
netic supercharging over FLM set-up incorporates a t-ITP step to
further enhance stacking of the analytes rather than pH-mediated
stacking. Most preconcentration set-ups in Table 3 are coupled to
CE are reported for analysis of apolar basic drug compounds, with
the exception electrokinetic supercharging over an FLM [19], which
was used polar herbicides. Unlike electrokinetic supercharging over
an FLM, 3PEE-CE-UV does not require removal of FLM from the
capillary, which can be a convoluted procedure and requires reoptimization for each new organic FLM phase.
3PEE-CE-UV has a relatively long total analysis time compared
to the discussed set-ups. However, as this is a proof-of-principle,
separation parameters such as separation voltage and capillary
length could still be optimized to yield shorter analysis times. The
obtained EFs of 3PEE-CE-UV were 1–2 orders of magnitude lower
than other reported methods. However, due to the combination
with dynamic pH-mediated stacking similar LODs were obtained.
A probable explanation for this is the fact that we studied the potential of our method for polar metabolites, while in other work
apolar drugs, which are more easily extracted are studied. Transfer
of polar molecules, such as the biogenic amines in this work, has
always been a challenging endeavor in EME and tuning of composition and size of the organic phase remains at the forefront
of interest [10]. The developed 3PEE-CE-UV has LODs in the low
nM range, which is similar to other techniques in Table 2, despite
having lower EFs likely due to its higher injection volume combined with in-capillary stacking. The low recoveries of 3PEE-CE-UV
make it suitable as a soft extraction technique. Moreover, on-line
methods such as described in Table 3 are more suited for analysis of large dilute samples as these can handle larger sample sizes
compared to high nL range samples in in-line methods. Finally, as
3PEE-CE-UV is not exhaustive it can be used to measure technical
replicates (i.e. repeat analyses of the same sample vial).
3.4.7. Proof of concept: urine bioanalysis
The potential of on-line 3PEE as sample cleanup procedure for
metabolomics analyses was investigated by analyzing human urine
with 5-HT, Trp and Tyr spiked to it. Analyte stocks were dissolved
in urine and acidified to 1 M FA (pH 1.8) prior to electroextraction. Field amplified stacking is reduced when analytes are dissolved in a highly conductive matrix and effective dynamic pHmediated stacking requires a shorter plug of ammonium hydroxide
for optimal stacking [30]. As urine is a highly conductive matrix
the length of the ammonium hydroxide plug was reduced (8 s at
34 mbar). In order to further increase the stacking efficiency, the
droplet retraction time was reduced (68 s at 34 mbar). This shorter
retraction resulted in an improved stability and comparable extrac-
A. Oedit, B. Duivelshof and P.W. Lindenburg et al. / Journal of Chromatography A 1610 (2020) 460570
7
Table 3
Comparison of the newly developed 3PEE-CE-UV method to other methods that were hyphenated to CE.
Set-up
Ref.
Compounds
EF (range)
ER (range)
LOD (range)
Total
analysis
time (min)
3PEE-CE-UV
This paper
7.8–42
0.2–1.1%
15–33 nM
52
Inline SDME-CE-MS
[27]
130–150
Not
reported
2–5 nM
62
Nano-EME coupled to
CE-UV
[17]
25–196
0.1%−0.79%
8–31 nM (0.2–
15 ng mL−1 )
>29d
FLM – electrokinetic
supercharging coupled
to CE-UV
[19]
Serotonin, Tyrosine,
(Phenylalanine)
Methoxyphenamine,
Methamphetamine,
Amphetamine,
Phenetylamine
Pethidine,
Nortiptyline,
Methadone,
Haloperidol,
Loperamide
Paraquat, Diquat
Not
reported
58 – 58 nM
(0.15–
0.20 ng mL−1 )
>20d
On-line back
extraction field
amplified sample
injection (coupled to
CE-UV)
[28]
(Relative
recoverya :
97.0–
97.5%b )
(Relative
recoverya :
94.71–
98.65%c ):
16 – 16 nM
(0.005–
0.005 μg mL−1 )
18
Cocaine, Thebaine,
(Metamphetamine)
Not
reported
Underlined compounds and values are those with the lowest LOD, compounds in italics are those with the highest LOD.
a
Relative recoveries were reported by measuring a spiked sample and comparing to the calibration curve.
b
Spiked at 20 ng mL−1 .
c
Spiked at 0.5 μg mL−1 .
d
Duration of initial flush prior to each analysis not specified.
Fig. 5. Proof of concept showing urine bioanalysis using 3PEE-CE-UV. Electropherograms obtained from (A) non-spiked urine and (B) spiked urine samples extracted by 3PEE
prior to CE-UV detection. Urine was spiked with 5-HT (1), Tyr (3) and Trp (2; 50 μM). Extraction and analytical conditions can be found in Section 3.6.
tion and separation current profiles to extractions performed in
neat solutions (data not shown). Before analysis of the target analytes, 3PEE-CE-UV was first applied to a non-spiked urine sample.
In the corresponding electropherogram at the non-specific wavelength 195 nm, many unidentified endogenous compounds were
observed after the extraction procedure showing its ability to analyze a urine sample without requiring prior dilution (Fig. 5A). Then,
3PEE-CE-UV was employed for the analysis of 5-HT, Trp and Tyr
(50 μM), spiked to urine of the same origin. The electropherogram
in Fig. 5B, shows detection of 5-HT, Trp and Tyr. In order to confirm
the identities of the endogenous compounds in urine a more selec-
tive detector is required. These preliminary results show the potential of 3PEE-CE-UV as an easy on-line sample preparation method
that could be applied for the analysis of small polar metabolites,
e.g., in a metabolomics setting.
4. Conclusion
In this work we have successfully developed a new approach
for simultaneous sample preconcentration and cleanup. This was
achieved through integration of 3PEE with CE-UV, which required
a simple modification in the electrode configuration of a commer-
8
A. Oedit, B. Duivelshof and P.W. Lindenburg et al. / Journal of Chromatography A 1610 (2020) 460570
cially available CE instrument. By placing an immiscible organic
filter phase on top of an aqueous sample, cationic analytes were
extracted into an aqueous acceptor droplet formed at the capillary inlet, when an electrical field was applied. In order to enable
full droplet retraction without loss of resolution after extraction,
pH-mediated stacking was introduced to efficiently stack analytes.
The performance of on-line 3PEE-CE-UV was evaluated by extracting 5-HT, Trp and Tyr from a 375 μL neat solution into a pendant
droplet of 100 nL BGE. Low extraction recoveries were obtained,
demonstrating that the technique is a soft extraction technique. To
the best of our knowledge, EME over an FLM of polar metabolites
was never reported. It was demonstrated that detection limits improved to 15 nM 5-HT and 33 nM Tyr with 3PEE, compared to 5 μM
5-HT and 1 μM Tyr in CE with hydrodynamic sample injection. As
proof-of-concept, the on-line 3PEE-CE-UV procedure was evaluated
for the analysis of human urine. It was demonstrated that 5-HT,
Trp and Tyr were successfully extracted from spiked urine, thus
signifying the potential of the developed procedure for urine bioanalysis and metabolomics.
Declaration of Competing Interest
None.
Acknowledgements
The research leading to these results has received funding
from the European Community’s Seventh Framework Program
(FP7/2007-2013) under Grant Agreement No. 306000 (STATegra)
and Grant Agreement No. 602783 (CAM-PaC). The authors would
like to acknowledge Raphaël Zwier for his help in adjusting the
electrode configuration of the CE instrument.
Supplementary materials
Supplementary material associated with this article can be
found, in the online version, at doi:10.1016/j.chroma.2019.460570.
References
[1] I. Kohler, J. Schappler, S. Rudaz, Microextraction techniques combined with
capillary electrophoresis in bioanalysis, Anal. Bioanal. Chem. 405 (2013)
125–141.
[2] R.-J. Raterink, P.W. Lindenburg, R.J. Vreeken, R. Ramautar, T. Hankemeier, Recent developments in sample-pretreatment techniques for mass spectrometry-based metabolomics, TrAC Trends in Anal. Chem. 61 (2014) 157–167.
[3] A. Wuethrich, P.R. Haddad, J.P. Quirino, The electric field – An emerging driver
in sample preparation, TrAC Trends in Anal. Chem. 80 (2016) 604–611.
[4] P.W. Lindenburg, R. Ramautar, T. Hankemeier, The potential of electrophoretic
sample pretreatment techniques and new instrumentation for bioanalysis,
with a focus on peptidomics and metabolomics, Bioanalysis 5 (2013).
[5] S. Pedersen-Bjergaard, C. Huang, A. Gjelstad, Electromembrane extraction-Recent trends and where to go, J. Pharm. Anal. 7 (2017) 141–147.
[6] A. Oedit, R. Ramautar, T. Hankemeier, P.W. Lindenburg, Electroextraction and
electromembrane extraction: advances in hyphenation to analytical techniques,
Electrophoresis 37 (2016) 1170–1186.
[7] A. Šlampová, P. Kubánˇ , Injections from sub-μL sample volumes in commercial
capillary electrophoresis, Journal of Chromatography A 1497 (2017) 164–171.
[8] R. Ramautar, G.W. Somsen, G.J. de Jong, CE-MS for metabolomics: developments and applications in the period 2014–2016, Electrophoresis 38 (2017)
190–202.
[9] A. Šlampová, P. Kubánˇ , Two-phase micro-electromembrane extraction across
free liquid membrane for determination of acidic drugs in complex samples,
Anal. Chim. Acta 1048 (2019) 58–65.
[10] N. Drouin, S. Rudaz, J. Schappler, New supported liquid membrane for electromembrane extraction of polar basic endogenous metabolites, J. Pharm.
Biomed. Anal. 159 (2018) 53–59.
[11] M. Silva, C. Mendiguchía, C. Moreno, P. Kubánˇ , Electromembrane extraction and
capillary electrophoresis with capacitively coupled contactless conductivity detection: multi-extraction capabilities to analyses trace metals from saline samples, Electrophoresis 39 (2018) 2152–2159.
[12] M. Dvorˇák, K.F. Seip, S. Pedersen-Bjergaard, P. Kubánˇ , Semi-automated set-up
for exhaustive micro-electromembrane extractions of basic drugs from biological fluids, Anal. Chim. Acta 1005 (2018) 34–42.
[13] A. Šlampová, P. Kubánˇ , Direct analysis of free aqueous and organic operational
solutions as a tool for understanding fundamental principles of electromembrane extraction, Anal. Chem. 89 (2017) 12960–12967.
[14] M. Forough, K. Farhadi, A. Eyshi, R. Molaei, H. Khalili, V. Javan Kouzegaran,
A.A. Matin, Rapid ionic liquid-supported nano-hybrid composite reinforced
hollow-fiber electromembrane extraction followed by field-amplified sample
injection-capillary electrophoresis: an effective approach for extraction and
quantification of imatinib mesylate in human plasma, J. Chromatogr. A 1516
(2017) 21–34.
[15] A.R. Fakhari, H. Mohammadi Kosalar, S. Asadi, K.S. Hasheminasab, Surfactant-assisted electromembrane extraction combined with cyclodextrin-modified capillary electrophoresis for the separation and quantification of tranylcypromine enantiomers in biological samples, J. Sep. Sci. 41 (2018) 475–482.
[16] R. Ramautar, G.W. Somsen, G.J. de Jong, Recent developments in coupled
SPE-CE, Electrophoresis 31 (2010) 44–54.
[17] M.D. Payan, B. Li, N.J. Petersen, H. Jensen, S.H. Hansen, S. Pedersen-Bjergaard,
Nano-electromembrane extraction, Anal. Chim. Acta 785 (2013) 60–66.
[18] P. Pantu˚ cˇ ková, P. Kubánˇ , P. Bocˇ ek, A simple sample pretreatment device with
supported liquid membrane for direct injection of untreated body fluids and
in-line coupling to a commercial CE instrument, Electrophoresis 34 (2013)
289–296.
[19] M.Q. Chui, L.Y. Thang, H.H. See, Integration of the free liquid membrane into
electrokinetic supercharging - capillary electrophoresis for the determination
of cationic herbicides in environmental water samples, J. Chromatogr. A 1481
(2017) 145–151.
[20] P. Kubánˇ , P. Bocˇ ek, Micro-electromembrane extraction across free liquid membranes. instrumentation and basic principles, J. Chromatogr. A 1346 (2014)
25–33.
[21] R.J. Raterink, P.W. Lindenburg, R.J. Vreeken, T. Hankemeier, Three-phase electroextraction, a new (online) sample purification and enrichment method for
bioanalysis, Anal. Chem. 85 (2013) 7762–7768.
[22] P. Kuban, P. Bocek, Micro-electromembrane extraction across free liquid membranes. extractions of basic drugs from undiluted biological samples, J. Chromatogr. A 1337 (2014) 32–39.
[23] P.W. Lindenburg, R. Seitzinger, F.W.A. Tempels, U.R. Tjaden, J. van der Greef,
T. Hankemeier, Online capillary liquid–liquid electroextraction of peptides as
fast pre-concentration prior to LC–MS, Electrophoresis 31 (2010) 3903–3912.
[24] P.W. Lindenburg, F.W. Tempels, U.R. Tjaden, J. van der Greef, T. Hankemeier,
On-line large-volume electroextraction coupled to liquid chromatography-mass
spectrometry to improve detection of peptides, J. Chromatogr. A 1249 (2012)
17–24.
[25] P.W. Lindenburg, U.R. Tjaden, J. van der Greef, T. Hankemeier, Feasibility of
electroextraction as versatile sample preconcentration for fast and sensitive
analysis of urine metabolites, demonstrated on acylcarnitines, Electrophoresis
33 (2012) 2987–2995.
[26] E. Van der Vlis, M. Mazereeuw, U.R. Tjaden, H. Irth, J. van der Greef, Combined
liquid-liquid electroextraction and isotachophoresis as a fast on-line focusing
step in capillary electrophoresis, J. Chromatogr. A (1994) 333–341.
[27] Z.A. AlOthman, M. Dawod, J. Kim, D.S. Chung, Single-drop microextraction as a
powerful pretreatment tool for capillary electrophoresis: a review, Anal. Chim.
Acta 739 (2012) 14–24.
[28] J. Kim, K. Choi, D.S. Chung, In-line coupling of single-drop microextraction with
capillary electrophoresis-mass spectrometry, Anal. Bioanal. Chem. 407 (2015)
8745–8752.
[29] H. Fang, Z. Zeng, L. Liu, D. Pang, On-line back-extraction field-amplified sample
injection method for directly analyzing cocaine and thebaine in the extractants
by solvent microextraction, Anal. Chem. 78 (2006) 1257–1263.
[30] Y.H. Tak, G.W. Somsen, G.J. de Jong, Optimization of dynamic pH junction for
the sensitive determination of amino acids in urine by capillary electrophoresis, Anal. Bioanal. Chem. 401 (2011) 3275–3281.