Salt gradient chromatographic separation of chondroitin sulfate disaccharides
Bạn đang xem bản rút gọn của tài liệu. Xem và tải ngay bản đầy đủ của tài liệu tại đây (1.19 MB, 6 trang )
Journal of Chromatography A 1619 (2020) 460979
Contents lists available at ScienceDirect
Journal of Chromatography A
journal homepage: www.elsevier.com/locate/chroma
Short communication
Salt gradient chromatographic separation of chondroitin sulfate
disaccharides
Gábor Tóth a,b, Károly Vékey a, Simon Sugár a,c, Ilona Kovalszky d, László Drahos a,
Lilla Turiák a,∗
a
MS Proteomics Research Group, Research Centre for Natural Sciences, Magyar tudósok kưrútja 2., H-1117 Budapest, Hungary
Department of Inorganic and Analytical Chemistry, Budapest University of Technology and Economics, Szent Gellért tér 4., H-1111 Budapest, Hungary
˝ út 26, H-1085, Budapest, Hungary
Ph.D. School of Pharmaceutical Sciences, Semmelweis University, Ülloi
d
˝ út 26, H-1085, Budapest, Hungary
1st Department of Pathology and Experimental Cancer Research, Semmelweis University, Ülloi
b
c
a r t i c l e
i n f o
Article history:
Received 10 November 2019
Revised 13 February 2020
Accepted 13 February 2020
Available online 16 February 2020
Keywords:
Glycosaminoglycan
Chondroitin sulfate
Capillary liquid chromatography
Salt gradient
Liver cancer
a b s t r a c t
In the present study, we describe the development of a fast, 2-step salt gradient for analysis of chondroitin sulfate disaccharides. Using salt gradients, which is somewhat unusual in HILIC-based separations,
provides relatively fast chromatography with excellent sensitivity (15 min cycle time, 10–20 fmol/μL detection, 30–50 fmol/μL quantitation limit), and good linearity. The efficiency of the new method is demonstrated by measuring human tissue slices of healthy, cirrhotic, and cancerous liver samples. Preliminary
results show major differences among the quantity and sulfation pattern of the various sample types.
© 2020 The Authors. Published by Elsevier B.V.
This is an open access article under the CC BY license. ( />
1. Introduction
Chondroitin sulfate (CS) is a class of long linear polysaccharides (glycosaminoglycans, GAGs), composed of alternating saccharide units of N-acetylgalactosamine (GalNAc) and glucuronic acid.
The synthesis of the polysaccharide backbone is carried out in the
Golgi apparatus. A very important step of CS chain formation is
sulfation, carried out by sulfotransferases [1]. The GalNAc residues
may be sulfated at the 4-OH and/or 6-OH positions, while glucuronic acid may be sulfated at the 2-OH position [2]. The sulfated
CS chains are attached to a core protein via a tetrasaccharide linkage, forming proteoglycans (PGs). PGs are localized in the extracellular matrix and on cell surfaces controlling various biochemical
functions [3–5]. The GAG chains are responsible for cellular signaling and recognition, governed by the size and the sulfation pattern
of the respective chains [6–8]. Alterations in the ratio of the differentially sulfated disaccharide building blocks may be descriptive of
various diseases, e.g. sulfation pattern changes have been observed
between healthy and cancerous tissue [9,10]. Hepatic cirrhosis is
accompanied by increased synthesis of connective tissue, with the
predominant increase of CS GAGs. Hepatocellular carcinoma also
∗
exhibits a selective increase in CS levels [10,11]. Thus, these malfunctions provide a good basis for CS compositional studies.
Structural characterization of CS is usually performed by analyzing their disaccharide and/or oligosaccharide building blocks after
enzymatic digestion (e.g. Chondroitinase ABC) or chemical degradation (deaminative cleavage with nitrous acid) [12,13]. The resulting disaccharides have a characteristic sulfation pattern, which is
descriptive of sulfation motifs of the original molecule. Structure
and description of 4,5 -unsaturated CS disaccharides originating
from Chondroitinase ABC digestion are summarized in Table 1.
Various chromatographic methods have been reported to analyze the sulfation of CS-derived disaccharides. These include
reversed-phase chromatography with derivatization or ion-pairing
[14,15], size exclusion (SEC) [16], graphitized carbon [17], HILIC
[18,19], or HILIC-WAX [9,20] chromatography. Most of these separation methods can be (and often are) coupled on-line to
mass spectrometry (MS), providing reliable structural information
[21,22]. Diversity of the reported methods suggests that they have
major drawbacks, mainly due to the diverse polarity of CS disaccharides and their unfavorable ionization characteristics in ESI-MS.
The main disadvantages of reported methods include limited sensitivity (LODs in the picomole - high femtomole range [21,23]), long
analysis time, and limited reproducibility. The current state of the
art on GAG disaccharide analysis has been reviewed recently [2].
Corresponding author.
E-mail address: (L. Turiák).
/>0021-9673/© 2020 The Authors. Published by Elsevier B.V. This is an open access article under the CC BY license. ( />
2
G. Tóth, K. Vékey and S. Sugár et al. / Journal of Chromatography A 1619 (2020) 460979
Table 1
Structure, nomenclature, and m/z values of the CS disaccharides investigated. Note, that D0a4 and D0a6 are positional isomers and
are distinguished via MS/MS measurements in the present study.
Chemical structure
Traditional name
Lawrence code
m/z (-) mode
MS/MS transition
HexA-GalNAc
D0a0
378.1
-
HexA-GalNAc4S
D0a4
458.1
300.1
HexA-GalNAc6S
D0a6
458.1
282.1
HexA-GalNAc4S6S
D0a10
538.1
-
We have recently reported a promising salt-gradient μHPLCMS method [20] for heparan sulfate (HS) analysis, with sensitivity down to 1 fmol/μL. Our present aim is to extend the applicability of this method to CS disaccharides: this is a group of GAGs
more challenging to analyze, due to their 5–10-times lower sensitivity and even less ideal chromatographic behavior experienced in
our setup. The aim of pushing down the limits of quantitation is
to have a method capable of quantitative analysis from small tissue slices or biopsies. These sample types pose a real challenge to
instrumental analytical techniques, necessitating utmost sensitivity
and repeatability. The applicability of our method will be shown
in the case of limited sample size human liver tissue slides, describing the changes occurring in cirrhosis and hepatocellular carcinoma in comparison to healthy species.
2. Materials and methods
2.1. Chemicals and reagents
2.3. Liquid chromatography-mass spectrometry
For microscale chromatography, a Waters® nanoAcquity UPLC
system (Waters, Milford, MA, USA) was coupled to a highresolution Waters® QTOF PremierTM Mass Spectrometer (Waters,
Milford, MA, USA) via normal electrospray ionization source.
2.3.1. MS parameters
The capillary voltage was set to 2.4 kV, sampling cone to 20 eV,
extraction cone to 4 V, the ion guide to 1.5. The source temperature
was 80 °C, the desolvation temperature was 100 °C, the cone gas
was 25 L/h and the desolvation gas 300 L/h. The investigated compounds were measured as singly charged anions. For the MS/MS
measurements of monosulfated CS disaccharides, the collision energy was set to 22 eV, following detailed optimization (details not
shown).
4,5 -unsaturated chondroitin sulfate disaccharide stanThe
dards (listed in Table 1, ‘CS disaccharides’ hereinafter) were purchased from Iduron (Cheshire, UK). Crystalline ammonium formate, ammonium bicarbonate, Chondroitinase ABC, and formic
acid (FA) were purchased from Merck (Budapest, Hungary). Glygen graphite+C18 TopTips were purchased from Sunchrom GmbH
(Friedrichsdorf Germany). LC-MS grade water, acetonitrile, xylene,
and ethanol were purchased from VWR International Ltd. (Debrecen, Hungary).
2.3.2. UHPLC parameters
For the investigation of the chromatographic behavior, we injected a mixture of the CS standards: 1 pmol/μL of D0a0, D0a10;
0.5 pmol/μL of the D0a4 and D0a6 standards (positional isomers, thus resulting in a total of 1 pmol/μL D0a4/D0a6 content).
Throughout the whole study, 1 μL volumes were injected.
A self-packed GlycanPac AXH-1 capillary column (250 μm i.d.)
was used, the column temperature was adjusted to 45 °C using
an AgileSleeve capillary heater with a MonoSleeve column heater
controller (Analytical Sales and Services Inc, Flanders, NJ USA), and
the flow rate was adjusted to 8 μL/min.
2.2. Column packing
2.4. Salt gradient HILIC-WAX separation of CS disaccharides
A GlycanPacTM AXH-1 1.9 μm analytical HPLC column
(2.1 × 100 mm, Thermo Fisher Scientific, Waltham, MA USA)
was unpacked and repacked into 250 μm i.d. capillaries based
on a method published recently [9]. Briefly, a 1 mg/mL resin
suspension (75% acetonitrile - 25% water) was driven through a
fritted capillary until reaching the 13 cm bed-length. After careful
pressure release, and UPLC compression procedure, the column
was ready to use.
The finally developed gradient program was the following. Eluent A was 10 mM ammonium formate in 75:25 v/v ACN:water
(pH 4.4); Eluent B was 65 mM ammonium formate in 75:25 v/v
ACN:water (pH 4.4). Starting from 6% B, the eluent ratio changed
in 0.5 min to 12% B, and then in 4.5 min to 60% B. As a washing
step, the composition was elevated to 100% B and held for 4 min
and it was followed by a 5-minute-long equilibration at the initial
composition.
G. Tóth, K. Vékey and S. Sugár et al. / Journal of Chromatography A 1619 (2020) 460979
2.6. On-tissue chondroitin sulfate sample preparation
De-paraffinization and antigen retrieval of FFPE liver tissue
slides were performed as described recently [9]. After that, enzymatic digestion was performed based on a previously developed
methodology [24]. Briefly, an aqueous digestion solution with the
following composition was prepared: 25 mM ammonium bicarbonate, 2.5 mM ammonium acetate, 1 mU/μL Chondroitinase ABC. The
used buffer ensures the selectivity of Chondroitinase ABC towards
only CS. The enzyme solution was added in five cycles as follows:
5 μL droplets of digestion solution were pipetted onto the surface,
and the samples were incubated in a humidified box for 1 h at
37 °C. The resulting disaccharides were extracted from the surface with 25 μL 0.3% ammonium hydroxide solution via 5 cycles
of repeated pipetting. The samples were then dried down and resuspended in 15 μL of injection solvent (10 mM ammonium formate in 75:25 v/v ACN:water (pH 4.4)), from which 1 μL was injected.
2.7. Data evaluation and interpretation
Peaks were integrated manually and with the QuanLynx addin of Waters MassLynx 4.1 software. Data visualization was done
using Microsoft Excel.
3. Results and discussion
3.1. Method development
Building on the previously mapped behavior of HS disaccharides on the GlycanPac AXH-1 column [20], we used 75:25 v/v
ACN:water solvent composition and ammonium formate salt in the
present study. The method development focused on determining
the best salt gradient in the 10 mM – 80 mM range in order
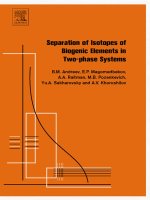
to achieve fast baseline separation. We have tested several linear
gradients with various length and steepness, a few examples are
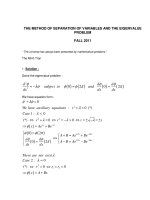
shown in Fig. 1. This shows the effect of starting and ending conditions of the gradient, using identical-length linear gradients. The
peak before ‘peak 1’ is a buffer contaminant, not affecting proper
CS disaccharide detection.
The 15 mM → 30 mM gradient (Fig. 1A) shows the partial separation of the D0a4/D0a6 isomer pair. Using lower salt concentrations and shallower gradients this resolution can be increased but
the resulting peaks are broad and shallow. This increases the detection limits unacceptably (at least while working with biological
samples). For this reason, we decided to go in another direction;
developing a method with which the D0a4/D0a6 isomer pair coelutes, but subsequently distinguish these two isomers using tandem mass spectrometry. By running a 20 mM → 55 mM salt gradient (Fig. 1B), sharp and high-intensity peaks were observed. Op-
counts
A
2
15-30 mM NH4FA
3
4
1
0
1.00
2.00
3.00
4.00
5.00
7.00
1: D0a0
2: D0a6
3: D0a4
4: D0a10
4
1.00
2.00
8.00
B
1
0
6.00
2,3
1.7E4
counts
Surgically removed control, cirrhotic, and cancer-bearing liver
specimens were sent from the Transplantation and Surgical Clinic
of Semmelweis University to the 1st Department of Pathology
and Experimental Cancer Research for diagnostic purpose. Samples were fixed in 10% buffered formaldehyde and embedded
into paraffin. 3-μm-thick sections were cut and stained with
Hematoxylin-eosin for diagnostic evaluation. Subsequently, 7-μmthick paraffin-embedded sections were prepared from four of each
control, cirrhotic and hepatocellular cancer containing paraffinembedded blocks for chondroitin sulfate analysis. The work was
approved by Semmelweis University Regional and Institutional
Committee of Science and Research Ethics (TUKEB permit number:
95/1999).
1.7E4
20-55 mM NH4FA
3.00
4.00
5.00
6.00
7.00
1.7E4
8.00
C
2,3
counts
2.5. Preparation of FFPE tissue slices
3
4
1
0
1.00
2.00
30-80 mM NH4FA
3.00
4.00
5.00
6.00
7.00
Time
8.00
Fig. 1. Effect of different starting and ending salt concentrations using 75% acetonitrile – 25% water solvent composition and identical-length linear gradient ramps.
Sums of extracted ion chromatograms (EICs) are shown in the diagram for A:
15 mM → 30 mM; B: 20 mM → 55 mM; and C: 30 mM → 80 mM ammonium
formate salt concentrations.
erating at a higher salt concentration (30 mM → 80 mM gradient)
caused a minor decrease both in retention times and intensities
(Fig. 1C).
We concluded that, as a linear gradient, the 20 mM → 55 mM
range was close to optimal. Next, we improved performance using
a 2-step gradient. The key points were to lower the starting salt
concentration, start with a shallow, and follow it with a steeper
gradient. The ending salt concentration was also lowered, in order
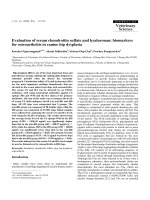
to decrease the probability of clogging. Therefore, we designed a
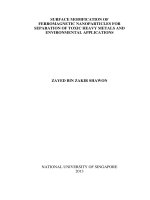
method that used a 2-step salt gradient starting from 14 mM to
43 mM ammonium formate concentration. This way we obtained
a chromatogram (Fig. 2) with close to ideal peak shapes, good resolution, selectivity, and sensitivity. Note that the salt concentration
has a major effect on peak retention and peak shape, but contrary
to usual mass spectrometry experience, the ion suppression was
negligible. The resolution for the peak pair 1–2,3 was 1.3, and for
peak pair 2,3–4, it was 2.2. The positional isomers D0a4 and D0a6
were distinguished using MS/MS measurements: The predominant
daughter ion from D0a4 is m/z 300.1, and that from D0a6 is m/z
282.1 [25,26].
3.2. Method characterization
The limit of quantitation (LOQ, FDA Bioanalytical Method Validation guidelines [27]) was below 50 fmol/μL for the D0a0 and
the D0a10 components and 30 fmol/μL for the D0a4/D0a6 isomer
4
G. Tóth, K. Vékey and S. Sugár et al. / Journal of Chromatography A 1619 (2020) 460979
Fig. 2. Chromatograms using the optimized 2-step gradient. A: Sum of extracted ion chromatograms; B: Individual extracted ion chromatograms for the respective compounds.
pair, while the limit of detection (LOD, estimated as 3-times S/N)
was approximately 20 fmol/μL for the D0a0 and the D0a10 components and 10 fmol/μL for the D0a4/D0a6 isomer pair. These values show that our method is approximately 5-times more sensitive
than what was reported in a recent paper [28]. Improved sensitivity may be attributed to gradient focusing and low chemical noise.
Note, our gradient is also relatively fast (5 min gradient and 15 min
overall cycle time), which is about 2–3 times shorter than the generally used methods for GAG separations [2].
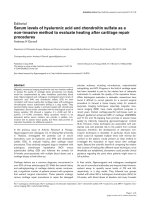
The linearity of the method was characterized in a wide range
from 50 fmol/μL to 5 pmol/μL, each concentration was measured in
triplicate. The R2 values covering the whole range were all above
0.99. Calibration curves are shown in Fig. 3, along with the calibration for the intensities of MS/MS transitions of the positional
isomers.
The repeatability of the method was analyzed in 5 consecutive runs (intra-day repeatability) and on 3 different days of the
week (inter-day repeatability) using a 500 fmol/μL CS disaccharide standard mixture. Intra-day variability (relative standard deviation of peak areas) was between 1.90 and 4.49%, while interday variability was between 10.56% and 15.62% (see Table S-1). The
latter can be easily compensated using before-batch calibrations.
The retention time variability was between 0.14% and 0.95% intraday, and between 0.20% and 1.12% inter-day (RSD values). Working
with relatively short gradients, these numbers suggest very stable chromatography. The variability of peak areas is mainly due
to changes in ion-source conditions since the stability of the CS
disaccharides in the applied injection solvent (75% ACN, 25% H2O,
10 mM NH4 FA) proved to be satisfactory under autosampler conditions in the timeframe of a usual batch (4 h). However, one should
be careful, when storing the samples for a longer period of time in
this solution, since the disaccharides showed a major degradation
at 4 °C when stored for 12–24 h. For details on sample stability,
see Table S-2.
Spike/recovery test was carried out to determine the accuracy of the method: measurements were performed at low (100
fmol/μL), medium (500 fmol/μL), and high (20 0 0 fmol/μL) spike
concentrations on three parallel samples each. The recovery values
were in the range of 87.0% - 114.9% at all concentrations for each
disaccharide. For detailed values, see Table S-3 in the supplementary material.
Long-term robustness of the system was outstanding: over 3
months of problem-free operation was observed, with no carryover, even after injecting as much as 10 pmol/μL samples.
3.3. Chondroitin sulfate composition in cirrhosis and liver cancer
Using the developed method, we aimed to determine key
changes of CS composition with respect to cirrhotic and cancerous
malfunctions of the human liver. The samples were enzymatically
degraded into unsaturated CS disaccharides using Chondroitinase
ABC. Tissue slices from three individuals in each group were digested, and all the samples were injected in triplicates and separated using the developed salt gradient μHPLC-MS method.
As liver cancer is often induced by cirrhotic malfunction, we
expected similar changes in CS content and sulfation pattern.
G. Tóth, K. Vékey and S. Sugár et al. / Journal of Chromatography A 1619 (2020) 460979
5
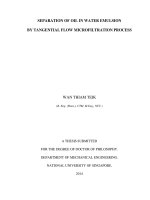
Fig. 3. Calibration curves (linear and logarithmic plotting) for the investigated compounds’ MS1 signals in the 50 fmol/μL – 5 pmol/μL range and the MS/MS transitions
using 1 pmol/μL mixture of the isomers. A: D0a0; B: D0a4/D0a6; C: D0a10; D: D0a4 transition (458.1 – 300.1); E: D0a6 transition (458.1 – 282.1).
Fig. 4. Comparison of healthy, cirrhotic and cancerous liver samples. A: Sum of absolute concentrations of all CS disaccharides (total chondroitin sulfate content). B: Sulfation
pattern changes with respect to individual disaccharide ratios.
Evidence of elevated CS content has already been reported in the
literature [10,11], therefore it was used to demonstrate the applicability of the method from limited-size tissue surface samples. The
total CS amount showed an over 4-fold increase in both cirrhosis
and cancer, to the same extent within statistical significance borders. As is seen in Fig. 4, the relative standard deviations remained
under 10% (often around 1–2%) for individual disaccharides and
were between 10% and 22% for cumulative absolute amounts. This
is well acceptable for measurements from biological material, especially when taking into account that sub-picomole quantities were
measured. Therefore it is concluded that the developed method
can be reliably used.
The changes in the sulfation pattern showed interesting results.
The average numbers of sulfate groups per disaccharide are similar to one another: it is 0.90 in healthy, 0.63 in cirrhotic and 0.84
in cancerous samples. In contrary to the relatively similar average
sulfation, there are substantial changes in the ratio of the individual disaccharides (Fig. 4B). The nonsulfated disaccharide (D0a0)
shows a small increase in cirrhotic state and a large decrease in
cancer. The monosulfated components (D0a4 and D0a6) both show
a medium increase in cirrhosis and a much larger increase in cancer. Their ratio relative to each other showed a small but significant
change: in healthy tissue, the D0a4/D0a6 ratio was 2.61, and it decreased to 1.75 in cirrhosis and to 1.97 in cancer. The ratio of the
doubly sulfated component (D0a10) showed a major decrease both
in cirrhotic and cancerous states. These data are in correlation with
others reported in the literature, performed by other techniques,
eg. SAX chromatography or gel-electrophoresis [10,11].
The changes discussed above indicate that CS may play a role in
the malfunctions investigated, thus proposing the basis of a future
large-scale study focusing on the regulatory mechanisms of GAGs
in connection with liver cancer and cirrhosis.
4. Conclusions
The diverse polarity and unfavorable ionization characteristics
of CS disaccharides necessitate the continuous development of
techniques used for their analysis. In this short communication,
6
G. Tóth, K. Vékey and S. Sugár et al. / Journal of Chromatography A 1619 (2020) 460979
we described a salt gradient method for their analysis, which enables fast and reliable quantitation of small amounts of CS disaccharides. The developed method shows faster chromatography,
improved sensitivity, and good repeatability compared to previous methods. Using a short, 2-step salt gradient (5 min gradient,
15 min cycle time) we were able to separate and identify CS disaccharides down to 10–20 fmol/μL and quantify them down to 30–
50 fmol/μL from biological matrices. The applicability of the developed method for limited-size samples was demonstrated by measuring various liver tissue slices. The observed changes propose the
necessity of a future large-scale study.
Author contributions
The manuscript was written through the contributions of all authors. All authors have given approval to the final version of the
manuscript.
Declaration of Competing Interest
The authors declare that they have no known competing financial interests or personal relationships that could have appeared to
influence the work reported in this paper.
CRediT authorship contribution statement
Gábor Tóth: Conceptualization, Methodology, Investigation,
Data curation, Writing - original draft. Károly Vékey: Conceptualization, Data curation, Writing - original draft, Funding acquisition.
Simon Sugár: Data curation, Writing - original draft. Ilona Kovalszky: Resources, Writing - original draft. László Drahos: Data curation, Writing - original draft, Funding acquisition. Lilla Turiák:
Conceptualization, Data curation, Writing - original draft, Supervision, Funding acquisition, Project administration.
Acknowledgments
Lilla Turiák acknowledges the support of the National Research
Development and Innovation Office (OTKA PD 121187) and is grateful for the support of the János Bolyai Research Scholarship of the
Hungarian Academy of Sciences. Károly Vékey appreciates the support of the National Research Development and Innovation Office
(OTKA 119459). Project no. 2018-1.2.1-NKP-2018-0 0 0 05 has been
implemented with the support provided from the National Research Development and Innovation Fund of Hungary, financed under the 2018-1.2.1-NKP funding scheme.
Supplementary materials
Supplementary material associated with this article can be
found, in the online version, at doi:10.1016/j.chroma.2020.460979.
References
[1] H.A.B. Multhaupt, J.R. Couchman, Heparan sulfate biosynthesis: methods for
investigation of the heparanosome, J. Histochem. Cytochem. 60 (2012) 908–
915, doi:10.1369/0022155412460056.
[2] K. Solakyildirim, Recent advances in glycosaminoglycan analysis by various
mass spectrometry techniques, Anal. Bioanal. Chem. 411 (2019) 3731–3741,
doi:10.10 07/s0 0216- 019- 01722- 4.
[3] T.M. Handel, Z. Johnson, S.E. Crown, et al., Regulation of protein function by
glycosaminoglycans–as exemplified by chemokines, Annu. Rev. Biochem. 74
(2005) 385–410, doi:10.1146/annurev.biochem.72.121801.161747.
[4] S. Karthikeyan, S. Barbara, Tumor-dependent effects of proteoglycans and various glycosaminoglycan synthesizing enzymes and sulfotransferases on patients’ outcome, Curr. Cancer Drug Targets. 19 (2019) 210–221, doi:10.2174/
1568009618666180706165845.
[5] H.-Y. Lin, C.-L. Lee, Y.-T. Lo, et al., The relationships between urinary glycosaminoglycan levels and phenotypes of mucopolysaccharidoses, Mol. Genet.
Genom. Med. 6 (2018) 982–992, doi:10.1002/mgg3.471.
[6] R.V. Gibbs, Cytokines and Glycosaminoglycans (GAGS), Springer, Boston, MAUS,
2003.
[7] L. Kjellen, U. Lindahl, Specificity of glycosaminoglycan-protein interactions,
Curr. Opin. Struct. Biol. 50 (2018) 101–108, doi:10.1016/j.sbi.2017.12.011.
[8] R. Raman, V. Sasisekharan, R. Sasisekharan, Structural insights into biological
roles of protein-glycosaminoglycan interactions, Chem. Biol. 12 (2005) 267–
277, doi:10.1016/j.chembiol.2004.11.020.
[9] L. Turiak, G. Toth, O. Ozohanics, et al., Sensitive method for glycosaminoglycan
analysis of tissue sections, J. Chromatogr. A. 1544 (2018) 41–48, doi:10.1016/j.
chroma.2018.02.034.
[10] I. Kovalszky, G. Pogany, G. Molnar, et al., Altered glycosaminoglycan composition in reactive and neoplastic human liver, Biochem. Biophys. Res. Commun.
167 (1990) 883–890, doi:10.1016/0 0 06-291X(90)90606-N.
[11] H. Lv, G. Yu, L. Sun, et al., Elevate level of glycosaminoglycans and altered sulfation pattern of chondroitin sulfate are associated with differentiation status and histological type of human primary hepatic carcinoma, Oncology 72
(2007) 347–356, doi:10.1159/000113145.
[12] J. Zaia, Principles of mass spectrometry of glycosaminoglycans, J. Biomacromol.
Mass Spec. 1 (2005) 3–36.
[13] R. Lawrence, H. Lu, R.D. Rosenberg, et al., Disaccharide structure code for the
easy representation of constituent oligosaccharides from glycosaminoglycans,
Nat. Method. 5 (2008) 291–292, doi:10.1038/nmeth0408-291.
[14] K. Solakyildirim, Z. Zhang, R.J. Linhardt, Ultraperformance liquid chromatography with electrospray ionization ion trap mass spectrometry for chondroitin
disaccharide analysis, Anal. Biochem. 397 (2010) 24–28, doi:10.1016/j.ab.2009.
09.031.
[15] Z.Q. Zhang, J. Xie, H.Y. Liu, et al., Quantification of heparan sulfate disaccharides using ion-pairing reversed-phase microflow high-performance liquid
chromatography with electrospray ionization trap mass spectrometry, Anal.
Chem. 81 (2009) 4349–4355, doi:10.1021/ac9001707.
[16] A.M. Hitchcock, C.E. Costello, J. Zaia, Glycoform quantification of chondroitin/dermatan sulfate using a liquid chromatography-tandem mass spectrometry platform, Biochemistry 45 (2006) 2350–2361, doi:10.1021/bi052100t.
[17] N.G. Karlsson, B.L. Schulz, N.H. Packer, J.M. Whitelock, Use of graphitised carbon negative ion LC-MS to analyse enzymatically digested glycosaminoglycans,
J. Chromatogr. B. 824 (2005) 139–147, doi:10.1016/j.jchromb.2005.07.014.
[18] V.L. Gill, U. Aich, S. Rao, et al., Disaccharide analysis of glycosaminoglycans
using hydrophilic interaction chromatography and mass spectrometry, Anal.
Chem. 85 (2013) 1138–1145, doi:10.1021/ac3030448.
[19] Y. Takegawa, K. Araki, N. Fujitani, et al., Simultaneous analysis of heparan sulfate, chondroitin/dermatan sulfates, and hyaluronan disaccharides by
glycoblotting-assisted sample preparation followed by single-step zwitterionic-hydrophilic interaction chromatography, Anal. Chem. 83 (2011) 9443–
9449, doi:10.1021/ac2021079.
[20] G. Tóth, K. Vékey, L. Drahos, et al., Salt and solvent effects in the microscale
chromatographic separation of heparan sulfate disaccharides, J. Chromatogr. A.
(2019), doi:10.1016/j.chroma.2019.460548.
[21] C. Shao, X. Shi, J.J. Phillips, J. Zaia, Mass spectral profiling of glycosaminoglycans from histological tissue surfaces, Anal. Chem. 85 (2013) 10984–10991,
doi:10.1021/ac402517s.
[22] E. Ucakturk, O. Akman, X.J. Sun, et al., Changes in composition and sulfation
patterns of glycoaminoglycans in renal cell carcinoma, Glycoconjugate J. 33
(2016) 103–112, doi:10.1007/s10719- 015- 9643- 1.
[23] J.H. Chen, T. Kawamura, M.K. Sethi, et al., Heparan sulfate: resilience factor and therapeutic target for cocaine abuse, Sci. Rep. (2017) 7, doi:10.1038/
s41598- 017- 13960- 6.
[24] L. Turiák, C. Shao, L. Meng, et al., Workflow for combined proteomics and glycomics profiling from histological tissues, Anal. Chem. 86 (2014) 9670–9678,
doi:10.1021/ac5022216.
[25] H. Desaire, T.L. Sirich, J.A. Leary, Evidence of block and randomly sequenced
chondroitin polysaccharides:
Sequential enzymatic digestion and quantification using ion trap tandem mass spectrometry, Anal. Chem. 73 (2001) 3513–
3520, doi:10.1021/ac010385j.
[26] J. Zaia, C.E. Costello, Compositional analysis of glycosaminoglycans by electrospray mass spectrometry, Anal. Chem. 73 (2001) 233–239, doi:10.1021/
ac0 0 0777a.
[27] U.S. Food And Drug Administration, Bioanalytical Method Validation, Guidance
for Industry, 2018.
[28] R. Raghunathan, M.K. Sethi, J. Zaia, On-slide tissue digestion for mass spectrometry based glycomic and proteomic profiling, MethodsX 6 (2019) 2329–
2347, doi:10.1016/j.mex.2019.09.029.