Applicability of Supercritical fluid chromatography–Mass spectrometry to metabolomics. II–Assessment of a comprehensive library of metabolites and evaluation of biological
Bạn đang xem bản rút gọn của tài liệu. Xem và tải ngay bản đầy đủ của tài liệu tại đây (2.12 MB, 10 trang )
Journal of Chromatography A 1620 (2020) 461021
Contents lists available at ScienceDirect
Journal of Chromatography A
journal homepage: www.elsevier.com/locate/chroma
Applicability of Supercritical fluid chromatography–Mass spectrometry
to metabolomics. II–Assessment of a comprehensive library of
metabolites and evaluation of biological matrices
Gioacchino Luca Losacco a, Omar Ismail b, Julian Pezzatti a, Víctor González-Ruiz a,
Julien Boccard a, Serge Rudaz a, Jean-Luc Veuthey a, Davy Guillarme a,∗
a
b
Institute of Pharmaceutical Sciences of Western Switzerland, University of Geneva, CMU – Rue Michel-Servet 1, 1211, Geneva 4, Switzerland
Dipartimento di Scienze Chimiche e Farmaceutiche, Università di Ferrara, via L. Borsari 46, 44121, Ferrara, Italy
a r t i c l e
i n f o
Article history:
Received 3 February 2020
Revised 4 March 2020
Accepted 6 March 2020
Available online 7 March 2020
Keywords:
Supercritical fluid chromatography
UHPSFC-HRMS
Metabolomics
Matrix effect
Retention time variability
a b s t r a c t
In this work, the impact of biological matrices, such as plasma and urine, was evaluated under SFC–HRMS
in the field of metabolomics. For this purpose, a representative set of 49 metabolites were selected. The
assessment of the matrix effects (ME), the impact of biological fluids on the quality of MS/MS spectra
and the robustness of the SFC–HRMS method were each taken into consideration. The results have highlighted a limited presence of ME in both plasma and urine, with 30% of the metabolites suffering from
ME in plasma and 25% in urine, demonstrating a limited sensitivity loss in the presence of matrices.
Subsequently, the MS/MS spectra evaluation was performed for further peak annotation. Their analyses
have highlighted three different scenarios: 63% of the tested metabolites did not suffer from any interference regardless of the matrix; 21% were negatively impacted in only one matrix and the remaining 16%
showed the presence of matrix-belonging compounds interfering in both urine and plasma. Finally, the
assessment of retention times stability in the biological samples, has brought into evidence a remarkable
robustness of the SFC–HRMS method. Average RSD (%) values of retention times for spiked metabolites
were equal or below 0.5%, in the two biological fluids over a period of three weeks.
In the second part of the work, the evaluation of the Sigma Mass Spectrometry Metabolite Library of
Standards containing 597 metabolites, under SFC–HRMS conditions was performed. A total detectability
of the commercial library up to 66% was reached. Among the families of detected metabolites, large percentages were met for some of them. Highly polar metabolites such as amino acids (87%), nucleosides
(85%) and carbohydrates (71%) have demonstrated important success rates, equally for hydrophobic analytes such as steroids (78%) and lipids (71%). On the negative side, very poor performance was found for
phosphorylated metabolites, namely phosphate-containing compounds (14%) and nucleotides (31%).
© 2020 The Authors. Published by Elsevier B.V.
This is an open access article under the CC BY license. ( />
1. Introduction
Due to the incredible heterogeneity of all the metabolites
present in the human body, it has been quite difficult so far to
develop generic analytical techniques for their determination [1–
4]. Nonetheless, several efforts have been made with this aim,
which mostly involve the use of ultra-high-performance liquid
∗
corresponding author.
E-mail address: (D. Guillarme).
chromatography (UHPLC) [5–7] and high-resolution mass spectrometers (HRMS), such as the Orbitrap or QqTOF devices [8–10].
Despite all these achievements, there is still a lot of work
to do in developing more comprehensive techniques, which can
more efficiently analyze different categories of metabolites with
contrasting chemical properties, going from lipids and steroids to
amino acids and sugars. Recently the implementation of ultra-high
performance super- or subcritical fluid chromatography (UHPSFC)
[11] was assessed in the field of metabolomics, as an alternative
technique which could be used instead of reversed-phase liquid
chromatography (RPLC) or hydrophilic interaction chromatography
(HILIC). In this paper [11], using a limited set of metabolites, it
/>0021-9673/© 2020 The Authors. Published by Elsevier B.V. This is an open access article under the CC BY license. ( />
2
G.L. Losacco, O. Ismail and J. Pezzatti et al. / Journal of Chromatography A 1620 (2020) 461021
was successfully demonstrated how UHPSFC, coupled to a tandem MS system, was able to detect extremely different analytes
such as lipids, nucleosides, sugars, small organic acids and so on
within a single analysis on the same device. There are, however,
several points that still need to be addressed. For example, it is
important to assess the effect of different biological matrices on
the quality and robustness of the developed UHPSFC method, with
a special focus on the matrix effects being generated. Moreover,
the number of metabolites previously used is rather limited compared to the real scenario in metabolomics. As an example, the Human Metabolome Database (HMDB) has registered around 110,0 0 0
metabolites in its database, and around 30,0 0 0 human metabolic
and disease pathways are present in the Small Molecule Pathway
Database (SMPDB) [12–15]. Considering this impressive number of
potential compounds and targets, there is a strong need to increase
the number of metabolites that must be tested under SFC conditions to check their detectability with this technique.
The aim of this study was therefore to assess the applicability of
SFC, coupled to a high-resolution mass spectrometer, in the field of
metabolomics by using an extended set of metabolites. The Sigma
Mass Spectrometry Metabolite Library of Standards (MSMLS), composed of nearly 600 metabolites, has been employed to assess
the detectability of these compounds under SFC–HRMS conditions.
Moreover, urine and plasma samples spiked with a limited set of
about 50 representative metabolites have been also evaluated under such conditions, to assess the impact of matrix effect (ME) on
the intensity and the retention time variability of the tested compounds. Finally, the MS/MS spectra of this limited set of metabolites were analyzed in such matrices to check for possible interferences from the matrix components.
2. Materials and methods
2.1. Chemicals and reagents
The Sigma Mass Spectrometry Metabolite Library of Standards
(MSMLS), composed of 634 pure standards (597 univocal analytes),
including 37 quality control duplicates, was purchased from SigmaAldrich (Buchs, Switzerland). The 49 metabolites (Table S1), chosen among the 57 previously used in the first part of this study
were purchased as standards from Sigma-Aldrich. Their description can be found in [11]. Methanol (MeOH) of OPTIMA LC/MS
grade and water of UHPLC grade were purchased from Fisher Scientific (Loughborough, UK). Dichloromethane of puriss. p.a. grade
(>99.9%), ammonium formate (AmF) of LC-MS grade and ammonium fluoride (NH4 F - >99.9%) were purchased from SigmaAldrich. Pressurized carbon dioxide (CO2) 4.5 grade (99.995%) was
purchased from PanGas (Dagmerstellen, Switzerland).
2.2. Standard solutions preparation
The set of 49 metabolites used in the first part of this work
were divided into six mother solutions, at a concentration of
500 μg/mL in ACN/H2 O 50/50 v/v. From these mother solutions,
a dilution to 50 μg/mL in ACN/H2 O 50:50 v/v was then performed
to obtain the standard solutions used for the analyses.
The Sigma MSMLS library is composed of seven 96-well plates.
Once the 37 quality control duplicates have been removed, the
remaining 597 metabolites were used to prepare stock solutions
at 25 μg/mL, using different sample diluents as detailed in [16].
Dichloromethane was successively used as the sample diluent for
hydrophobic analytes. Once the addition of solvent was made, each
well plate was left agitating on a Thermomixer (Vaudaux – Eppendorf AG, Switzerland) for a total of 45 min at 900 rpm at
room temperature. From the stock solutions at 25 μg/mL, final di-
lutions of each metabolite at 8 μg/mL were made with a mixture
of ACN/water 50/50 v/v.
2.3. Biological samples and sample treatment
Urine samples were prepared according to a “dilute-and-shoot”
protocol: six urines from healthy donors (3 males – 3 females)
were centrifuged at 30 0 0 × g for 6 min, then the supernatant
was collected and filtered through a 0.45 μm nylon membrane. The
filtered pooled urine was then divided into six aliquots, each of
250 μL as volume, each spiked with an aliquot from the six mother
solutions previously described (500 μg/mL in H2 O:ACN 50:50 v/v),
containing the set of 49 metabolites. The spiked urine aliquots
have been further diluted up to 10 0 0 μL with H2 O:ACN 25:75 v/v.
Triplicate samples have been prepared. Final concentrations of analytes were 50 μg/mL. Urine was therefore diluted by a factor of
1:4. Samples were stored at −22 °C and thawed prior to injection.
Plasma samples were prepared following a “protein precipitation” pre-treatment: six different heparinized plasma samples, obtained from healthy donors, have been mixed to make a pool of
plasma. PPACN was carried on this pool, by adding 9 mL of pure
ACN to 4.5 mL of pooled plasma (dilution factor 1:2); the precipitated plasma was then centrifuged at 30 0 0 X g for 6 min. The supernatant was collected and aliquoted six times creating aliquots
of 250 μL each. Each aliquot was spiked with the six mother solutions already used for urine samples at a final concentration of
50 μg/mL and a final volume of 10 0 0 μL. Samples were stored at
−22 °C and thawed prior to injection.
2.4. UHPSFC–HRMS instrumentation and data treatment
All experiments were performed on a Waters Acquity UPC2 system (Waters, Milford, MA, USA) equipped with a Binary Solvent
Manager delivery pump, a Sample Manager autosampler which included a 10 μL loop for partial loop injection, a column oven and
a two-step (active and passive) backpressure regulator (BPR). Acetonitrile and a mixture of MeOH/H2O 50/50 were used as the weak
and strong wash solvents, respectively, with volumes of 600 μL and
200 μL. The chromatographic system was hyphenated to a Waters
Xevo QqTOF via a double-T splitter interface from Waters [17]. Additional make-up solvent for SFC-MS operation was brought to the
system by a Waters Isocratic Solvent Manager (ISM) pump, delivering pure MeOH at 0.3 mL/min. Empower 3.0 was used for the
chromatographic system control.
The Waters Xevo QqTOF detector was operated in both positive and negative electrospray ionization (ESI) modes. Different parameters were optimized to obtain the highest sensitivity: source
temperature at 150 °C, desolvation temperature at 450 °C, capillary voltage at ±2.5 kV. Nitrogen was used as a desolvation gas at
900 L/h. The cone voltage was fixed at 30 V. Acquisitions were performed in the m/z range of 50–10 0 0 with a 0.25 s scan time. The
instrument was periodically calibrated using the charged ions produced by a 0.5 mM sodium formate solution in acetonitrile/water
80/20 v/v. MassLynx 4.1 software was used for MS instrument control, data acquisition and data treatment. An analogic connection
was established between the chromatographic system and mass
spectrometer.
Chromatographic conditions were as following: the Poroshell
HILIC 100×3.0 mm – 2.7 μm (Agilent, Santa Clara, CA, USA) was
employed as the stationary phase, while the mobile phase was a
mixture of CO2 and MeOH/H2 O 95/5 v/v + 50 mM ammonium formate and 1 mM of ammonium fluoride. When analyzing biological samples, a Zorbax RX-SIL analytical guard column from Agilent
(12.5 × 4.6 mm–5.0 μm) was fixed before the column, mounted
on a guard column hardware kit high pressure from Agilent. Gradient mode was employed during all the analyses, more details can
G.L. Losacco, O. Ismail and J. Pezzatti et al. / Journal of Chromatography A 1620 (2020) 461021
be found in the first article of this series [11]. Backpressure was
maintained constant at 105 bar, while mobile phase temperature
was kept at 40 °C. The flow-rate was fixed at 0.9 mL/min. Injection
volume was 3.0 μL.
To calculate RSD (%), as an estimate of metabolites retention times variability in biological samples, retention times were
recorded and inter-week RSD (%) was calculated over a period of
three weeks. Calculations were made with Microsoft Excel 2016.
RSD values for each metabolite can be found in Table S1. The calculated RSD values were plotted as violin plots. Violin plots were created using Plotly Chart Studio () A more
detailed description of their interpretation can be found in [18]. .
2.5. Estimation of the matrix effect
ME values were obtained following the Matuszewski’s approach
[19] and calculated by using the following Eq. (1):
ME (% ) =
Peak area o f post ext ract ion spiked sample
× 100 (1)
Peak area o f standard in neat solution
An average of the peak areas’ values of post extraction spiked
samples obtained from three replicates and an average of the peak
areas of neat standards was made. Matrix effect in the range between 50% ≤ ME ≥ 150% was labeled as “limited ME”. ME values
above 150% were considered as “Ion Enhancement”, while values of
ME below 50% were classified as “Ion Suppression”. The ME values
obtained for each metabolite can be found in the Supplementary
Table S1.
3. Results and discussion
3.1. Matrix effect evaluation
The assessment of the ME generated at the electrospray ionization source is quite important, as it can give different considerations on the quality of the MS signals obtained. Moreover, its
3
evaluation becomes essential as it can heavily influence the sensitivity of the analytical method for one metabolite, whose detectability might become hard to perform. The interfering compounds generating ME can be quite different and are strictly related to the type of matrix being employed. In the case of urine,
as an example, such ME-generating elements are highly polar compounds with low molecular weights. For plasma, in addition to
small polar molecules, there are also some lipophilic species such
as phospholipids and triglycerides that can be responsible for ME.
All these different components will affect the MS signal obtained,
including both its intensity and fragmentation profile. Matrix effect
can consist mainly of either ion suppression, that is a decrease in
the MS signal intensity, or ion enhancement, where the MS signal intensity is higher than expected. To assess the performance
of UHPSFC–HRMS with biological matrices, urine and plasma samples spiked with the set of 49 metabolites were evaluated following the Matuszewski’s approach. Peak shapes of the used metabolites were symmetrical in most cases, with few cases of peak distortions (Fig. S1). Simple and generic sample treatment procedures
(dilute and shoot for urine and protein precipitation for plasma)
have been selected to mimic the most conventional workflow usually employed in untargeted metabolomics. More specific sampletreatment strategies, such as solid phase extraction (SPE) or solid
liquid extraction (SLE), were not considered as they are known
to be selective approaches, more suited for targeted analyses. In
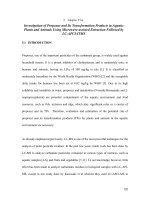
Fig. 1A and B, the average ME values generated by the detected
metabolites were plotted as a function of their average retention
times. In these two graphical representations, no relationship was
found between the average ME value and the average retention of
each analyte. This result points out how it is difficult to predict
the ME effect for one given metabolite. Despite that, it is possible
to detect some global trends related to the type of biological matrix employed. This is illustrated in Fig. 1C and D, where the average ME values have been classified in three categories: limited ME
(50% ≤ ME ≥ 150%), ion suppression (50% ≤ ME) and ion enhance-
Fig. 1. (A) Scatter plot of the average matrix effect (%) as a function of the average retention time (min) for each metabolite in plasma. (B) Scatter plot of the average matrix
effect (%) as a function of the average retention time (min) for each metabolite in urine. (C) Bar graph showing the distribution of the 49 metabolites according to the
average matrix effect found in plasma. (D) Bar graph showing the distribution of the 49 metabolites according to the average matrix effect found in urine.
4
G.L. Losacco, O. Ismail and J. Pezzatti et al. / Journal of Chromatography A 1620 (2020) 461021
Table 1
List of metabolites showing a different behaviour of their matrix effect in urine and plasma.
Rosmarinic acid
Phosphorylethanolamine
Picolinic acid
Lysine
Acetylcholine
Adenosine monophosphate
Caffeine
Lauroylcarnitine
Sphinganine
Retinyl palmitate
ESI ionization
Average Rt (min) URINE
Average ME (%) URINE
Average Rt (min) PLASMA
Average ME (%) PLASMA
NEG
POS
POS
POS
POS
POS
POS
POS
POS
POS
4.86
4.99
5.44
4.44
7.05
6.16
3.32
6.76
4.00
0.97
124
13
104
132
124
93
125
68
21
47
4.88
5.00
5.40
4.45
7.07
6.18
3.32
6.77
4.02
0.93
155
183
345
179
159
189
153
173
103
171
ment (ME ≥ 150%). Both biological matrices exhibited an overall
limited ME influence in the ionization process for each detected
metabolite (70% and 75% of metabolites in plasma and urine, respectively). However, different behaviors have been witnessed for
ion suppression and enhancement. While in urine the remaining
25% of detected metabolites have all suffered from ion suppression,
there was a predominance of ion enhancement (20% of detected
metabolites) over ion suppression (10% of detected metabolites)
with plasma matrix. Such differences in the ME behavior between
these two matrices have already been witnessed in modern SFCMS in the work of Desfontaine et al. [20]. In this paper, the authors
have assessed the ME generated under UHPSFC-MS/MS conditions
using a set of three UHPSFC stationary phases and have demonstrated that the ME seems to be mostly dependent from the choice
of the stationary phase, rather than that of the sample treatment
procedure (generic vs. selective). By taking into consideration the
column chemistry being employed in this work (Poroshell HILIC –
underivatized silica), the stationary phase is highly polar due to
the presence of free silanols. As can be deducted from the cited
work, with simple and generic sample treatment techniques such
as the ones used in the present work, the use of polar stationary
phases is associated with a predominance of ion suppression over
ion enhancement for urine samples treated with the DS approach.
The opposite scenario is observed when using plasma treated with
the PP procedure. A further proof demonstrating the differences in
ME behavior is that most of the compounds suffering from ion enhancement in plasma are, on the other hand, experiencing ion suppression (ME ≤ 50%) or limited matrix effect (50% ≤ ME ≥ 150%)
in urine (Table 1). This behavior is almost exclusively present in ESI
positive mode. A possible explanation of this phenomenon can be
obtained by assessing the species present in each biological matrix,
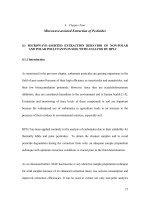
their elution times and their signal intensities. Fig. 2A and B are a
representation of the different matrix-related species observed under ESI positive mode using the generic UHPSFC-MS method. As
illustrated, there was an important discrepancy in the profile of
the endogenous compounds present in each matrix. Indeed, plasma
possesses a much more heterogeneous and more widespread profile, but with a few species generating high signal intensities. On
the other hand, there is a lower variability of such ME-generating
molecules in urine, but they were more intense. The situation in
ESI negative mode was quite different, with a much lower number of matrix-belonging compounds observed with both matrices
(Supplementary figures S2A and S2B). In ESI positive mode, Fig.
2A and B illustrate the difference in the complexity of these matrices: while for urine there are mostly small polar compounds
such as urea, creatinine and inorganic ions, in plasma there are
Fig. 2. (A) Ion map showing each compound belonging to the biological matrix assessed (plasma), according to their molecular weight (Da) and retention time (min). The
signals with a more intense colour represent a higher signal intensity. (B) Ion map showing each compound belonging to the biological matrix assessed (urine) according to
their molecular weight (Da) and retention time (min). The signals with a more intense colour represent a higher signal intensity.
G.L. Losacco, O. Ismail and J. Pezzatti et al. / Journal of Chromatography A 1620 (2020) 461021
5
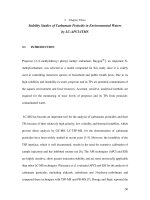
Fig. 3. MS/MS spectra for adenosine in plasma (upper signal), urine (middle signal) and in neat standard solution (lower signal).
also more hydrophobic components such as phospholipids and fatsoluble vitamins. This higher diversity could explain the insurgence
of a more variegated ME profile, as witnessed in Fig. 1.
A final point that was assessed revolved around the possible
presence of metal ion clusters in SFC-MS [21,22]. In their articles,
the authors have witnessed and described an important contribution of ion suppression originating from the presence of metal
ions in biological matrices, generating therefore metal ion clusters which greatly impact the signal intensities of those analytes
coeluting with the inorganic ions. Their presence was, therefore,
assessed in this work but no manifestation of such clusters was
found. This could be surely dependent from the different MS systems being used, in the type of ESI ionization source employed
and, finally, by differences in the sample preparation stage.
3.2. MS/MS spectra evaluation
In the field of metabolomics MS/MS fragmentation patterns are
commonly used in the annotation and identification of signals.
Therefore, the ability of high-resolution MS instruments to perform
tandem MS/MS analyses, and to subsequently generate MS/MS
spectra, is of primary importance in the metabolomic workflow.
This is even more relevant when assessing real-life samples as
there is a preponderant presence of endogenous contaminants specific for a given biological matrix, which could hamper the quality
of MS/MS spectra. In a similar way to the ME during the ionization phase, these matrix-belonging species can also cause some issues during the stage of ion fragmentation, since some of them
co-elute with the metabolites of interest. Therefore, the quality
of the MS/MS spectra generated in UHPSFC mode was also assessed by comparing the MS/MS profiles of the analytes as standards vs. those spiked in treated urine and plasma samples. Fig. 3
shows an illustrative example of how the presence of the biological fluid did not affect the MS/MS spectra profile. For adenosine, as example, no interferences were recorded with any biological matrix. On the other hand, Fig. 4 depicts another illustrative case in which the selected metabolite (i.e. xanthurenic acid)
is subjected to a selective influence of endogenous compounds related to the type of matrix being analyzed. No interferences were
observed with urine, and the MS/MS spectra were identical to
those obtained with the standard. Additionally, the presence of a
[M + H]+ at m/z of 184 was observed in the plasma sample. This
ion comes from the dissociation of glycerophosphocholines, a component widely present in total plasma phospholipids population,
into trimethylammonium-ethyl phosphate ions, as already reported
[23]. Finally, Fig. 5 shows a third illustrative example with a different behavior. Here the MS/MS spectra of trigonelline presented
always some interferences, whatever the biological fluid (plasma
and urine). Furthermore, it is important to notice that such interferences are more common when employing the MS instrument in
the ESI positive mode. In ESI negative mode, the significant lower
presence of such matrix components, as previously discussed in
Figures S2A and S2B, translates into a lower probability of interferences when generating MS/MS spectra.
Once these three behaviors were identified, the MS/MS spectra
generated by the entire set of 49 metabolites were assessed. 63% of
the compounds were characterized by an absence of interferences
in any biological matrices. Out of the remaining 37%, 21% suffer
from interferences in only one matrix, and 16% in both matrices.
In Fig. S3 the percentages found for each ESI modality have been
reported. As previously indicated, an important impact originating
from the presence of the biological matrix was observed in ESI
positive, while the number of components associated with urine
and plasma is much lower in ESI negative. Therefore, the MS/MS
spectra in ESI negative mode will always contain less interferences
from matrix components.
3.3. Assessment of retention times stability
Once having assessed the influence of the matrix on the
metabolites in the ionization process and MS/MS fragmentation
profile in UHPSFC, another important aspect that must be evaluated is the variability of retention times when employing biological
matrices treated with simple and generic sample treatment processes. This point is relevant since retention times must be used,
along with other parameters, for the annotation and formal identification of metabolites obtained in untargeted acquisition. The reference chromatographic technique used in metabolomics is ultra-
6
G.L. Losacco, O. Ismail and J. Pezzatti et al. / Journal of Chromatography A 1620 (2020) 461021
Fig. 4. MS/MS spectra for xanthurenic acid in plasma (upper signal), urine (middle signal) and in neat standard solution (lower signal).
Fig. 5. MS/MS spectra for trigonelline in plasma (upper signal), urine (middle signal) and in neat standard solution (lower signal).
high performance liquid chromatography (UHPLC), which is known
to possess a high degree of robustness and repeatability when
using reversed-phase column under various analytical conditions,
even in presence of biological matrices. The robustness and repeatability of SFC has however been scarcely explored. While the
old generation instruments were not able to properly handle the
super- / subcritical mobile phase and ensuring high repeatability,
this issue has been recently resolved with the introduction of mod-
ern UHPSFC systems. The latter have become very robust [24,25]
and demonstrated an excellent repeatability of retention times
with standards and biological matrices as demonstrated in [18].
Sample preparation procedures used in untargeted metabolomics
are commonly minimal to reduce the losses of analytes present at
very low concentrations and to increase the coverage yield of the
metabolome. However, it also means that more interfering compounds from the matrices will be regularly injected into the chro-
G.L. Losacco, O. Ismail and J. Pezzatti et al. / Journal of Chromatography A 1620 (2020) 461021
7
Fig. 6. Violin plots representing the population of RSD (%) values calculated for the 49 metabolites in neat standard solutions (blue), urine (red) and plasma (green). (For
interpretation of the references to color in this figure legend, the reader is referred to the web version of this article.)
matographic system, which could remain retained by the stationary phase and poorly eluted. Therefore, it was important to assess
whether the developed UHPSFC method can still generate an acceptable retention time repeatability. For that purpose, the retention times of the 49 metabolites were recorded over a period of
three weeks, and a relative standard deviation (RSD%) was calculated for each matrix and for standards. The data was then represented using violin plots to easily visualize and compare RSD obtained from standards, urine and plasma samples (Fig. 6). Average
RSD (%) values were extremely low: standards generated an average RSD of 0.3% over the three weeks, while urine (average RSD
of 0.4%) and plasma (average RSD of 0.5%) did not highlight dramatic changes in the retention profile repeatability. Metabolites in
plasma showed a slightly higher variability compared to those in
urine, as the more elongated shape of the violin plot observed for
plasma clearly indicates that there are more analytes generating
higher RSDs than in urine. This trend might arise because of the
higher number of matrix-related endogenous compounds present
in plasma over urine, as already discussed (Fig. 2). Nonetheless,
the very low variabilities found in all biological matrices is another
support for the claim that UHPSFC has reached a very similar performance level to UHPLC. The excellent results obtained here are
mostly due to the presence of a limited proportion of water in the
mobile phase, which is known to improve repeatability in UHPSFC,
as demonstrated in [20].
3.4. Analysis of the sigma MSMLS under UHPSFC–HRMS conditions
The next step was to increase the number of metabolites tested
under the developed conditions above the panel of 49 compounds
used so far. For this purpose, the Sigma Metabolite Library of
Standards (MSMLS) was evaluated. Its variety and diversity of the
species contained represents an interesting benchmark to further
demonstrate the applicability of a novel analytical technique, such
as UHPSFC–HRMS, in metabolomics. The entire library was therefore screened using the already optimized conditions and a detection rate of 66% was reached under the developed conditions. In
Fig. 7, the detection percentages for each class of compounds are
represented on a spider graph. Several interesting trends can be
described. First of all, high success rates were found for some categories, which are generally not well detected with classical UHPSFC
methods (i.e. > 70% for carbohydrates and organic acids, > 80%
for amino acids, quaternary amines, sulphates/sulfonated metabolites and nucleosides). All the above-mentioned metabolites share
a high polarity and were eluted in UHPSFC with a relatively high
percentage of organic modifier in the mobile phase. It is also important to keep in mind that these polar metabolites were successfully analyzed, thanks to the presence of water and additives in the
mobile phase, as already discussed in [13].
The use of unconventional SFC conditions (up to 100% organic modifier) is also not incompatible with the analysis
of lipophilic metabolites. Indeed, high detectability percentages
(>70%) were also found for lipophilic compounds such as steroids
and lipids/lipid related metabolites, which were eluted at the beginning of the gradient with low organic modifier percentages.
However, such detectability percentages were obtained after choosing a different solubilization solvent than what was chosen at the
beginning of the experiments. A mixture of 95/5 MeOH/H2 O v/v
was initially used as a solubilization solvent to obtain the stock
solutions at 25 μg/mL for steroids and lipids/lipid related metabolites. These stock solutions, once diluted, were analyzed with the
UHPSFC–HRMS analytical method and gave lower percentages of
detectability (52% for steroids, 54% for lipids/lipid related metabolites). Such low values were unexpected, as these classes are wellknown to be successfully analyzed using standard UHPSFC–HRMS
conditions. Therefore, it was decided to use a different sample
diluent, as the one previously used might have been not well
adapted. The choice fell on dichloromethane, since it is able to dissolve lipophilic substances and its aprotic characteristics are suitable in providing good peak shapes under SFC conditions [26].
Its use was successful, as it enables to enhance the detectability percentages for steroids and lipids/lipid related metabolites.
To further increase this percentage, another ionization technique
(such as APCI or APPI) should be tested as some metabolites belonging to these categories are too lipophilic for ESI ionization
mode.
8
G.L. Losacco, O. Ismail and J. Pezzatti et al. / Journal of Chromatography A 1620 (2020) 461021
Amino acids
Not categorized
58.3%
87.6%
Carbohydrates
71.4%
Quaternary amines
Phosphate-containing
83.3%
14.6%
Sulphates & sulfonated
Nucleosides & analogues
85.7%
85.3%
52.4%
54.6%
Steroids
Nucleotides & analogues
31.6%
78.3%
Organic acids
71.0%
Lipids & lipid-related
71.1%
Amines & bases
Poly-alcohols
72.3%
50.0%
Fig. 7. Spider graph depicting the detectability percentages of each class of metabolites present in the Sigma MSMLS.
Fig. 8. Scatter plot of each detected metabolite from the Sigma MSMLS, according to their average retention times (min), molecular weights (Da) and percentage of cosolvent
needed for their elution.
G.L. Losacco, O. Ismail and J. Pezzatti et al. / Journal of Chromatography A 1620 (2020) 461021
However, not all classes were easily detected under
UHPSFC–HRMS conditions. Despite the several efforts being
made to improve the detectability of hydrophilic compounds in
UHPSFC, low success rates were observed for two specific categories of metabolites namely nucleotides and analogues (32%)
and phosphate containing compounds (15%). The presence of one
or more phosphate groups seems to be highly detrimental under
UHPSFC–HRMS conditions. This becomes even more obvious when
comparing the behavior of two families of compounds which differ
only in the presence of phosphate groups, namely nucleosides (no
phosphate) and nucleotides (one or more phosphate). There are
several possible hypotheses to explain these negative results: a
possible precipitation of the metabolites might happen due to
the incompatibility of such substances with the UHPSFC mobile
phase, especially at the beginning of the gradient profile where
a high proportion of supercritical CO2 is present. In addition, the
possible adsorption phenomenon of phosphorylated compounds
on the walls and frits of the stainless-steel column could occur,
due to the chelation phenomenon generated by the phosphate
groups to the metallic surface. Lastly, it is also possible that the
phosphate metabolites are simply too much retained and cannot
be eluted from the UHPSFC column under the selected conditions.
As demonstrated by others [27], the use of less orthodox gradient
profiles enabled the successful analysis of nucleosides and, more
important, of nucleotides as well.
Despite the negative results obtained for some categories of
metabolites, the overall performance of UHPSFC–HRMS with this
metabolomic library can be considered as excellent. Besides the
possibility to successfully analyze a wide range of metabolites, it
is also important to notice that all the detected metabolites presented a relatively high retention factor. This is illustrated in Fig. 8,
where the average retention times of each metabolite successfully detected from the Sigma Metabolite Library (blue points) and
those belonging to the original set of 49 metabolites previously
used (red points) was plotted over the gradient profile used in
this study. As shown, the early eluted lipophilic compounds are all
sufficiently retained (only one metabolite, oleic acid, eluted during the initial isocratic hold close to the column dead time of
0.5 min), while the most hydrophilic compounds are all eluted
during the gradient (only one metabolite, deoxycarnitine, eluted
after the gradient). This observation is certainly one of the most
important point to consider, when evaluating the implementation
of UHPSFC–HRMS in the field of metabolomics. Indeed, unlike the
other well-established chromatographic techniques such as RPLC
and HILIC, which suffer from poor retention of hydrophilic (for
RPLC) or lipophilic (for HILIC) metabolites, respectively, UHPSFC is
able to successfully analyze all these compounds within the same
run. Such interesting retention profile is due to the unique interaction mechanism in UHPSFC, consisting mostly of H-bond interactions between the analytes and the stationary phase. Since almost
all metabolites can generate such interactions, UHPSFC can be considered as a highly generic analytical strategy, allowing to ensure a
good retention profile from an extremely diverse pool of metabolites, from lipids to sugars and nucleosides, with identical analytical conditions.
4. Conclusion
In this study, the potential use of UHPSFC, coupled to a HRMS,
for metabolomic analyses was assessed. Following a previous paper [11], the impact of biological matrices commonly analyzed in
metabolomics, such as urine or plasma, was evaluated. The ME
generated by those biological samples resulted in a limited number of compounds suffering from ME in both matrices (30% in
plasma; 25% in urine). Ion suppression was the main source of
ME for urine, while in plasma the presence of a more complex
9
profile of endogenous compounds translates into the presence of
both ion suppression (10% of metabolites) and, in a major form,
ion enhancement (20%). The quality of MS/MS spectra was then
considered. It was observed that 63% of metabolites do not suffer
from the presence of matrix-related interfering compounds; while
21% seem to be influenced only in one type of biological matrix,
and the third category (16% of the total metabolites) presents interferences whatever the matrix. The retention time repeatability
of metabolites in these two biological matrices was also evaluated
over a period of three weeks. The extremely low values of average RSDs calculated in all conditions (0.3 - 0.5%) represent another
demonstration of how modern UHPSFC has evolved into a stable
and robust technique, with performance very similar to the wellestablished UHPLC. Finally, the developed strategy was applied to
a large library of metabolites. Almost 600 metabolites were analyzed, with a detection success rate of 66%. This study highlights
how the developed UHPSFC–HRMS method has now proven to be
quite powerful in detecting heterogenous families of metabolites
using identical analytical conditions, from highly polar compounds
to very lipophilic substances. Moreover, the peculiar UHPSFC retention mechanism allowed to obtain a very good retention profile
for all detected metabolites, with enough retention for the most
hydrophobic compounds and enough elution strength to successfully elute, the most hydrophilic metabolites. All these results confirm that UHPSFC–HRMS might be potentially considered as a valid
alternative to the already established chromatographic techniques
for metabolomic studies. As future perspectives, it is now imperative to further develop applications based on the analysis of reallife samples, to build specific database integrating UHPSFC retention factors as well to push forwards some applications and implementation in the field of targeted metabolomics.
Declaration of Competing Interest
None.
Supplementary materials
Supplementary material associated with this article can be
found, in the online version, at doi:10.1016/j.chroma.2020.461021.
CRediT authorship contribution statement
Gioacchino Luca Losacco: Writing - original draft, Methodology, Investigation. Omar Ismail: Writing - review & editing,
Methodology, Investigation. Julian Pezzatti: Writing - review &
editing. Víctor González-Ruiz: Writing - review & editing. Julien
Boccard: Writing - review & editing. Serge Rudaz: Supervision.
Jean-Luc Veuthey: Supervision, Resources. Davy Guillarme: Supervision, Project administration.
References
´
[1] J. Aszyk, H. Bylinski,
J. Namies´ nik, A. Kot-Wasik, Main strategies, analytical trends and challenges in LC-MS and ambient mass spectrometry–based
metabolomics, TrAC Trends Anal. Chem 108 (2018) 278–295, doi:10.1016/j.trac.
2018.09.010.
[2] I. Kohler, A. Verhoeven, R.J. Derks, M. Giera, Analytical pitfalls and challenges in clinical metabolomics, Bioanalysis 8 (2016) 1509–1532, doi:10.4155/
bio- 2016- 0090.
[3] H.G. Gika, G.A. Theodoridis, R.S. Plumb, I.D. Wilson, Current practice of liquid
chromatography–mass spectrometry in metabolomics and metabonomics, Rev.
Pap. Pharm. Biomed. Anal. 87 (2014) 12–25 2013, doi:10.1016/j.jpba.2013.06.
032.
[4] E.L. Regalado, I.A. Haidar Ahmad, R. Bennett, V. D’Atri, A.A. Makarov,
G.R. Humphrey, I. Mangion, D. Guillarme, The emergence of universal chromatographic methods in the research and development of new drug substances, Acc. Chem. Res. 52 (2019) 1990–2002, doi:10.1021/acs.accounts.
9b0 0 068.
[5] G.J. Patti, Separation strategies for untargeted metabolomics, J. Sep. Sci. 34
(2011) 3460–3469, doi:10.1002/jssc.201100532.
10
G.L. Losacco, O. Ismail and J. Pezzatti et al. / Journal of Chromatography A 1620 (2020) 461021
[6] R. Ramautar, G.J. de Jong, Recent developments in liquid-phase separation
techniques for metabolomics, Bioanalysis 6 (2014) 1011–1026, doi:10.4155/bio.
14.51.
[7] W. Lv, X. Shi, S. Wang, G. Xu, Multidimensional liquid chromatography-mass
spectrometry for metabolomic and lipidomic analyses, TrAC Trends Anal.
Chem. 120 (2019) 115302, doi:10.1016/j.trac.2018.11.001.
[8] D.M. Drexler, M.D. Reily, P.A. Shipkova, Advances in mass spectrometry applied
to pharmaceutical metabolomics, Anal. Bioanal. Chem 399 (2011) 2645–2653,
doi:10.10 07/s0 0216- 010- 4370- 8.
[9] E.G. Armitage, F.J. Rupérez, C. Barbas, Metabolomics of diet-related diseases using mass spectrometry, Mod. Food Anal. Foodomics 52 (2013) 61–73, doi:10.
1016/j.trac.2013.08.003.
[10] R. Bonner, G. Hopfgartner, SWATH data independent acquisition mass spectrometry for metabolomics, TrAC Trends Anal. Chem 120 (2019) 115278, doi:10.
1016/j.trac.2018.10.014.
[11] V. Desfontaine, G.L. Losacco, Y. Gagnebin, J. Pezzatti, W.P. Farrell, V. GonzálezRuiz, S. Rudaz, J.-.L. Veuthey, D. Guillarme, Applicability of supercritical fluid
chromatography – mass spectrometry to metabolomics. i – Optimization
of separation conditions for the simultaneous analysis of hydrophilic and
lipophilic substances, J. Chromatogr. A. 1562 (2018) 96–107, doi:10.1016/j.
chroma.2018.05.055.
[12] D.S. Wishart, D. Tzur, C. Knox, R. Eisner, A.C. Guo, N. Young, D. Cheng, K. Jewell, D. Arndt, S. Sawhney, C. Fung, L. Nikolai, M. Lewis, M.-.A. Coutouly,
I. Forsythe, P. Tang, S. Shrivastava, K. Jeroncic, P. Stothard, G. Amegbey,
D. Block, D.D. Hau, J. Wagner, J. Miniaci, M. Clements, M. Gebremedhin, N. Guo,
Y. Zhang, G.E. Duggan, G.D. MacInnis, A.M. Weljie, R. Dowlatabadi, F. Bamforth,
D. Clive, R. Greiner, L. Li, T. Marrie, B.D. Sykes, H.J. Vogel, L. Querengesser,
HMDB: the human metabolome database, Nucleic Acids Res. 35 (2007) D521–
D526, doi:10.1093/nar/gkl923.
[13] D.S. Wishart, C. Knox, A.C. Guo, R. Eisner, N. Young, B. Gautam, D.D. Hau,
N. Psychogios, E. Dong, S. Bouatra, R. Mandal, I. Sinelnikov, J. Xia, L. Jia,
J.A. Cruz, E. Lim, C.A. Sobsey, S. Shrivastava, P. Huang, P. Liu, L. Fang, J. Peng,
R. Fradette, D. Cheng, D. Tzur, M. Clements, A. Lewis, A. De Souza, A. Zuniga,
M. Dawe, Y. Xiong, D. Clive, R. Greiner, A. Nazyrova, R. Shaykhutdinov, L. Li,
H.J. Vogel, I. Forsythe, HMDB: a knowledgebase for the human metabolome,
Nucleic Acids Res. 37 (2008) D603–D610, doi:10.1093/nar/gkn810.
[14] D.S. Wishart, T. Jewison, A.C. Guo, M. Wilson, C. Knox, Y. Liu, Y. Djoumbou,
R. Mandal, F. Aziat, E. Dong, S. Bouatra, I. Sinelnikov, D. Arndt, J. Xia, P. Liu,
F. Yallou, T. Bjorndahl, R. Perez-Pineiro, R. Eisner, F. Allen, V. Neveu, R. Greiner,
A. Scalbert, HMDB 3.0—The human metabolome database in 2013, Nucleic
Acids Res. 41 (2012) D801–D807, doi:10.1093/nar/gks1065.
[15] D.S. Wishart, Y.D. Feunang, A. Marcu, A.C. Guo, K. Liang, R. Vázquez-Fresno,
T. Sajed, D. Johnson, C. Li, N. Karu, Z. Sayeeda, E. Lo, N. Assempour, M. Berjanskii, S. Singhal, D. Arndt, Y. Liang, H. Badran, J. Grant, A. Serra-Cayuela, Y. Liu,
R. Mandal, V. Neveu, A. Pon, C. Knox, M. Wilson, C. Manach, A. Scalbert, HMDB
4.0: the human metabolome database for 2018, Nucleic Acids Res. 46 (2017)
D608–D617, doi:10.1093/nar/gkx1089.
[16] J. Pezzatti, V. González-Ruiz, S. Codesido, Y. Gagnebin, A. Joshi, D. Guillarme,
J. Schappler, D. Picard, J. Boccard, S. Rudaz, A scoring approach for multiplatform acquisition in metabolomics, J. Chromatogr. A. 1592 (2019) 47–54,
doi:10.1016/j.chroma.2019.01.023.
[17] G.L. Losacco, J.-.L. Veuthey, D. Guillarme, Supercritical fluid chromatography
– mass spectrometry: recent evolution and current trends, TrAC Trends Anal.
Chem 118 (2019) 731–738, doi:10.1016/j.trac.2019.07.005.
[18] G.L. Losacco, E. Marconetto, R. Nicoli, T. Kuuranne, J. Boccard, S. Rudaz, J..L. Veuthey, D. Guillarme, Supercritical fluid chromatography–mass spectrometry in routine anti-doping analyses: estimation of retention time variability
under reproducible conditions, J. Chromatogr. A (2019) 460780, doi:10.1016/j.
chroma.2019.460780.
[19] B.K. Matuszewski, M.L. Constanzer, C.M. Chavez-Eng, Strategies for the assessment of matrix effect in quantitative bioanalytical methods based on
HPLC−MS/MS, Anal. Chem 75 (2003) 3019–3030, doi:10.1021/ac020361s.
[20] V. Desfontaine, F. Capetti, R. Nicoli, T. Kuuranne, J.-.L. Veuthey, D. Guillarme,
Systematic evaluation of matrix effects in supercritical fluid chromatography
versus liquid chromatography coupled to mass spectrometry for biological
samples, J. Chromatogr. B. 1079 (2018) 51–61, doi:10.1016/j.jchromb.2018.01.
037.
[21] A. Svan, M. Hedeland, T. Arvidsson, C.E. Pettersson, The differences in matrix
effect between supercritical fluid chromatography and reversed phase liquid
chromatography coupled to ESI/MS, Anal. Chim. Acta 10 0 0 (2018) 163–171,
doi:10.1016/j.aca.2017.10.014.
[22] A. Haglind, M. Hedeland, T. Arvidsson, C.E. Pettersson, Major signal suppression
from metal ion clusters in SFC/ESI-MS - Cause and effects, J. Chromatogr. B.
1084 (2018) 96–105, doi:10.1016/j.jchromb.2018.03.024.
[23] J.L. Little, M.F. Wempe, C.M. Buchanan, Liquid chromatography–mass spectrometry/mass spectrometry method development for drug metabolism studies: examining lipid matrix ionization effects in plasma, J. Chromatogr. B. 833 (2006)
219–230, doi:10.1016/j.jchromb.2006.02.011.
[24] A. Dispas, R. Marini, V. Desfontaine, J.-.L. Veuthey, D. Kotoni, L.G. Losacco,
A. Clarke, C. Muscat Galea, D. Mangelings, B.M. Jocher, E.L. Regalado, K. Plachká,
L. Nováková, B. Wuyts, I. Franỗois, M. Gray, A.J. Aubin, A. Tarafder, M. Cazes,
C. Desvignes, L. Villemet, M. Sarrut, A. Raimbault, E. Lemasson, E. Lesellier,
C. West, T. Leek, M. Wong, L. Dai, K. Zhang, A. Grand-Guillaume Perrenoud,
C. Brunelli, P. Hennig, S. Bertin, F. Mauge, N. Da Costa, W.P. Farrell, M. Hill,
N. Desphande, M. Grangrade, S. Sadaphule, R. Yadav, S. Rane, S. Shringare,
M. Iguiniz, S. Heinisch, J. Lefevre, E. Corbel, N. Roques, Y.V. Heyden, D. Guillarme, P. Hubert, First inter-laboratory study of a supercritical fluid chromatography method for the determination of pharmaceutical impurities, J. Pharm.
Biomed. Anal. 161 (2018) 414–424, doi:10.1016/j.jpba.2018.08.042.
[25] A. Dispas, V. Desfontaine, B. Andri, P. Lebrun, D. Kotoni, A. Clarke, D. Guillarme,
P. Hubert, Quantitative determination of salbutamol sulfate impurities using
achiral supercritical fluid chromatography, J. Pharm. Biomed. Anal. 134 (2017)
170–180, doi:10.1016/j.jpba.2016.11.039.
[26] V. Desfontaine, A. Tarafder, J. Hill, J. Fairchild, A. Grand-Guillaume Perrenoud,
J.-.L. Veuthey, D. Guillarme, A systematic investigation of sample diluents in
modern supercritical fluid chromatography, J. Chromatogr. A. 1511 (2017) 122–
131, doi:10.1016/j.chroma.2017.06.075.
[27] M.C. Beilke, M.J. Beres, S.V. Olesik, Gradient enhanced-fluidity liquid hydrophilic interaction chromatography of ribonucleic acid nucleosides and nucleotides: a “green” technique, J. Chromatogr. A. 1436 (2016) 84–90, doi:10.
1016/j.chroma.2016.01.060.