Optimal loading flow rate trajectory in monoclonal antibody capture chromatography
Bạn đang xem bản rút gọn của tài liệu. Xem và tải ngay bản đầy đủ của tài liệu tại đây (1018.32 KB, 8 trang )
Journal of Chromatography A 1635 (2021) 461760
Contents lists available at ScienceDirect
Journal of Chromatography A
journal homepage: www.elsevier.com/locate/chroma
Optimal loading flow rate trajectory in monoclonal antibody capture
chromatography
Joaquín Gomis-Fons a,b,1,∗, Mikael Yamanee-Nolin a,1, Niklas Andersson a, Bernt Nilsson a,b
a
b
Department of Chemical Engineering, Lund University, Lund, Sweden
Competence Centre for Advanced BioProduction by Continuous Processing, Royal Institute of Technology, Stockholm, Sweden
a r t i c l e
i n f o
Article history:
Received 5 August 2020
Revised 23 October 2020
Accepted 23 November 2020
Available online 26 November 2020
Keywords:
Flow programming
Flow trajectory
Protein A chromatography
Monoclonal antibody
Multi-objective optimization
Chromatography scale-up
a b s t r a c t
In this paper, we determined the optimal flow rate trajectory during the loading phase of a mAb capture column. For this purpose, a multi-objective function was used, consisting of productivity and resin
utilization. Several general types of trajectories were considered, and the optimal Pareto points were obtained for all of them. In particular, the presented trajectories include a constant-flow loading process
as a nominal approach, a stepwise trajectory, and a linear trajectory. Selected trajectories were then applied in experiments with the state-of-the-art protein A resin mAb Select PrismATM , running in batch
mode on a standard single-column chromatography setup, and using both a purified mAb solution as
well as a clarified supernatant. The results show that this simple approach, programming the volumetric
flow rate according to either of the explored strategies, can improve the process economics by increasing
productivity by up to 12% and resin utilization by up to 9% compared to a constant-flow process, while
obtaining a yield higher than 99%. The productivity values were similar to the ones obtained in a multicolumn continuous process, and ranged from 0.23 to 0.35 mg/min/mL resin. Additionally, it is shown that
a model calibration carried out at constant flow can be applied in the simulation and optimization of
flow trajectories. The selected processes were scaled up to pilot scale and simulated to prove that even
higher productivity and resin utilization can be achieved at larger scales, and therefore confirm that the
trajectories are generalizable across process scales for this resin.
© 2021 The Authors. Published by Elsevier B.V.
This is an open access article under the CC BY license ( />
1. Introduction
Monoclonal antibodies (mAbs) are used to treat a wide range
of different diseases, such as rheumatoid arthritis, Crohn’s disease and chronic lymphocytic leukemia [1]. However, mAb treatments can become very expensive due to high manufacturing costs
[2] and low research and development productivity [3]. Further
considering the fact that downstream processing may account for
over 60% of the total manufacturing cost of a mAb product, and
that the capture step is crucial to overall process efficiency, improvements of this step will have great impact on process economics [2].
∗
Corresponding author at: Dept. of Chemical Engineering, Lund University, P.O.
Box 124, SE-21100, Lund, Sweden.
addresses:
(J.
GomisFons),
(M.
Yamanee-Nolin),
(N. Andersson),
(B. Nilsson).
1
Joaquín Gomis-Fons and Mikael Yamanee-Nolin are co-first authors with equal
contribution.
Most processes for the purification of mAbs are currently operated in batch mode, and these processes are simple, robust, and
well-known [4,5]; however, they are also inefficient [6-8]. To increase efficiency, an alternative is to adopt an integrated and continuous bioprocess (ICB), which could lead to higher productivity, lower cost of goods, and higher resin utilization, as shown
in previous implementations and studies [7,9,10]. Most downstream steps in previous ICB studies are based on multi-column
chromatography processes, which for example include sequential multi-column chromatography (SMCC) [11], capture simulated
moving bed (CaptureSMB) [12], multi-column counter-current solvent gradient purification (MCSGP) [13,14], and periodic countercurrent chromatography (PCC) [6,15]. In general, these strategies
make use of multiple columns, valves and pumps with a sequential
operation; thus, this adds an extra layer of complexity to the process design and operation. In addition, there are technology gaps
that need to be address before the implementation of these processes at commercial scale [16], which is why integrated and continuous biomanufacturing is still not prevalent at commercial scale
[7].
/>0021-9673/© 2021 The Authors. Published by Elsevier B.V. This is an open access article under the CC BY license ( />
J. Gomis-Fons, M. Yamanee-Nolin, N. Andersson et al.
Journal of Chromatography A 1635 (2021) 461760
Building upon the findings of Sellberg et al. [21,22], the purpose of the current work is to optimize different flow trajectories
in a protein A step for the capture of mAb with the novel resin
mAb Select PrismATM , and demonstrate their potential in an experimental validation. In comparison to the work by Ghose et al.
[20], we present a more comprehensive study where different flow
programming strategies are explored, and we apply the optimal
results to a state-of-the-art protein A resin. The loading phase in
the protein A capture step is often the rate-limiting step in a mAb
downstream process [20]. Therefore, flow programming was only
considered in the loading step. To obtain the optimal flow trajectories, a model-based multi-objective optimization approach was
first applied, utilizing a General Rate model [23], in order to find
and compare optimal trajectories for three approaches:
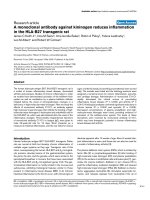
Fig. 1. Illustrative comparison of the breakthrough curves (BTC) with constant flow
rate (u1 ) and variable flow rate (u2 ).
I A nominal approach, applying a constant flow rate.
II A stepwise trajectory approach, applying Nu > 1 decision horizons with stepwise flow rate changes.
III A linear trajectory approach, applying a flow rate changing linearly with time.
Another approach towards increasing efficiency is to apply a
programmed variable flow rate in the loading of the chromatography steps, and the underlying idea is illustrated in Fig. 1. The
theoretical background is that higher loading flow rates lead to
higher productivity, but they also result in a flatter breakthrough
curve [6,17]. As a result of a flatter breakthrough curve, the loading
time must be shortened in order to keep the yield high, thus leading to a decreased resin utilization. Similarly, when a lower flow
rate is applied, the breakthrough curve is sharper, and the resin
utilization for a specific yield requirement is increased. In order
to find the optimal balance between high productivity and high
resin utilization, flow programming can be used to find an optimal
flow trajectory. Using this technique, a higher flow rate is applied
at the beginning when all binding sites are available, and a lower
flow rate is used to give the protein more time to diffuse into the
pores. As shown in Fig. 1, the breakthrough curve of the variableflow process appears earlier as a result of a higher flow rate at the
beginning, but as the flow rate diminishes, mass transfer in the
column improves leading to less product loss in the breakthrough.
Flow programming has been previously used [18], showing a
productivity increase with a variable flow rate profile obtained
with a design of experiments (DoE) approach. Lacki [19] has also
demonstrated the potential of flow programming, but their results
also showed that if the flow rate trajectory is not chosen properly, the productivity could be even lower than in the corresponding constant-flow operation.
In order to avoid sub-optimal flow rate trajectories and their
resulting performance in terms of process economics, model-based
optimization can be a useful tool to optimize key process performance indicators such as productivity, resin utilization, and yield.
This approach has been explored by Ghose et al. [20], who applied a dual-flow rate loading strategy with a variable switching
time and showed that it outperformed single-loading strategies
without requiring any extra equipment or columns. This strategy
was expanded later to include any number of constant flow rates
evenly distributed over the loading phase [21]. This in-silico study,
which was not based on mAbs but on a model protein instead, further highlighted the potential to increase productivity and resin
utilization by modifying the flow rate during the loading phase
of a capture step, whilst retaining the simplicity of the singlecolumn setup operated in batch mode. Further proof of the potential of model-based optimal trajectories in chromatography has
been shown by Sellberg et al. [22], who obtained optimal elution
trajectories with variable modifier concentration in ion exchange
chromatography. The mass transfer behind this process is different from the one behind the loading of a protein A column, but it
shows the experimental feasibility of applying general trajectories
obtained with a computer-aided optimization.
A Pareto front for each of the three approaches was obtained,
and they were then implemented at laboratory scale for proof-ofconcept. The experimental results in combination with the modelbased results highlight the potential to improve efficiency and process economics of the mAb production process using a simple yet
high-value solution, i.e., a single-column, batch-mode capture step
with variable flow rate during the loading phase. The primary advantage compared to an ICB process is that the batch technology
and equipment currently used commercially can still be used applying the proposed flow-programming strategies. Scalability of the
flow-trajectory processes from laboratory scale to pilot scale is crucial to be able to maintain the same process through the development phases of the biopharmaceutical. For that reason, the processes studied were scaled up and simulated to demonstrate that
the trajectories can be applied even at a larger scale and are general at any scale for the resin mAb Select PrismA. This is, to be
the best of our knowledge, the first time that process scale-up is
addressed in relation to flow programming.
The remainder of the paper is structured as follows:
Section 2 introduces the model-based approach, with the process model and the optimization problem. This is followed by a
description of the experimental setup and procedure, and of the
scale-up method. The results of the model-based optimization,
the laboratory experiments and the process scale-up are then
presented and discussed in Section 3. The major conclusions are
then presented in the final section.
2. Material and methods
2.1. Model-based optimization
2.1.1. Process model
The chromatography column was modeled using the General
Rate model featuring a heterogeneous binding mechanism with
fast and slow sites [23], to simulate and optimize the loading of
the capture step. The particular model applied in the current work
has been previously implemented in Matlab and calibrated successfully in our previous study [6], using the Finite Volume Method
[24]. The model was calibrated for several constant flow rates and
mAb concentrations to ensure a good fitting for a broad range of
conditions. The mobile phase and particle concentrations are described by Eqs. 1 and 2, respectively, with boundary conditions
specified by equations 1a, 1b, 2a, and 2b, and Eq. 3 describing the
kinetics.
∂c
∂ 2c
v ∂c 1 −
= Dax 2 −
−
∂t
∂z
c ∂z
c
2
c
3
k c − c p|r=r p
rp f
(1)
J. Gomis-Fons, M. Yamanee-Nolin, N. Andersson et al.
∂c
v
=
(c − cF ) at z = 0
∂z
D
c ax
∂c
= 0 at z = L
∂z
∂ cp
∂ cp
1 ∂
= De f f 2
r2
∂t
∂r
r ∂r
∂ cp
= 0 at r = 0
∂r
−
Journal of Chromatography A 1635 (2021) 461760
for the stepwise constant flow rates, and the total duration of the
loading phase, giving a total of Nu + 1 decision variables; Y represents yield, and Y min is the minimum required yield, set to 99%;
and [DVlb,i , DVub,i ] are the lower and upper bounds for the decision
variables, set to [0.2, 1.5] mL/min for the flow rates and [60, 300]
min for the loading time. The optimization problem for Approach
III is presented in Eq. 5:
(1a)
(1b)
∂ ( q1 + q2 )
∂t
p
1
kf
∂ cp
=
(c − c p ) at r = r p
∂r
De f f
qi
∂ qi
= ki (qmax, i − qi )c p −
∂t
K
(2)
Objective functions : F = −[P, U ]
(2a)
Decision variables : DV = u0 , ut f , t f
(2b)
Constraints : Y ≥ Y min , DVi = DVlb,i , DVub,i
In this problem, the objectives and constraints were the same
as the ones used in Approaches I and II, but the decision variables
were different. The decision variables were in this case only the
initial and final flow rates, u0 and ut f , respectively, and the duration of the loading phase, t f , and the resulting trajectory was linear over time. The control action at time t, i.e., the volumetric flow
rate, ut , was in this approach calculated according to Eq. 6.
(3)
Here, c is the mobile phase mAb concentration, cF is the inlet mAb concentration, c p is the particle mAb concentration, q is
the adsorbed mAb concentration, Dax is the axial dispersion coefficient, v is the superficial fluid velocity, k f is the particle layer mass
transfer coefficient, De f f is the effective pore diffusivity, εc is the
column void, ε p is the particle porosity, r p is the particle radius, L
is the column length, qmax is the maximum column capacity, K is
the Langmuir equilibration constant, and ki is the adsorption rate
constant, where i can be either 1 or 2, for fast or slow kinetics,
respectively. The axial dispersion coefficient was obtained using a
Peclet number correlation [25], the void and porosity parameters
were obtained from Pabst et al. [26], and the mass transfer coefficient was estimated with an empirical correlation [27].
The choice of the chromatography resin has an impact on the
model as the particle diameter and pore size of the resin affect the
mass transfer significantly. A higher particle diameter leads to a
longer average distance between the particle surface and the binding sites, which results in a slower overall mass transfer inside the
particle; and a small pore diameter hinders mass transfer through
the pores by decreasing the effective pore diffusivity [28]. Therefore, a new model calibration and optimization should be carried
out for a different resin.
ut f − u0
ut =
tf
t + u0
(6)
Furthermore, for the three approaches, the three key performance indicators were defined according to Eqs. 7-9:
2.1.2. Optimization problem
The main idea behind the optimization problem was to modify the volumetric flow rate during the loading phase as well as
the duration of the loading phase (decision variables) in order to
improve the process economics, by maximizing productivity and
resin utilization (objective functions) for a specific yield requirement (constraint). Two different types of flow trajectories were
employed: a stepwise trajectory with Nu decision horizons corresponding to constant flow rate levels distributed evenly across
the full duration of the loading phase was employed in Approach
I (a single decision horizon, thus corresponding to the nominal
constant-flow process) and Approach II (Nu > 1 decision horizons),
whereas a linear trajectory was obtained over time and applied in
Approach III. The choice of these two types of trajectories resulted
in two slightly different optimization problems. The optimization
problem for the stepwise trajectories employed in Approaches I
and II is presented in Eq. 4 below:
Objective functions : F = −[P, U ]
(5)
Pn =
ma
t f Vc (1 −
P=
Pn − Pmin
Pmax − Pmin
c
Un =
ma
qeqVc (1 −
U=
Un − Umin
Umax − Umin
Y =
ma
min
)
;
(7a)
(7b)
c
)
;
(8a)
(8b)
(9)
where ma is the amount of adsorbed mAb, which is determined
as the difference between the amount of mAb loaded (min ) and
the product loss in the breakthrough, calculated by the area under
the breakthrough curve; Vc is the column volume; and Pmin , Pmax ,
Umin , and Umax are nominal minimum and maximum values of the
productivity and resin utilization, based on nominal loading processes at minimum and maximum volumetric flow rates and loading phase durations. Eq. 7a defines the productivity as the amount
of adsorbed mAb divided by the duration of the loading phase and
the resin volume. Eq. 8a defines the resin utilization as the amount
of adsorbed mAb per volume of resin divided by the stationary
phase mAb concentration at equilibrium, whose definition is also
based on volume of resin. Furthermore, Eqs. 7b and 8b define the
productivity and resin utilization normalized to the range 0-1 for
all operating conditions, which are used in the objective function.
Eq. 9 defines yield as the amount of adsorbed mAb divided by the
amount of mAb loaded. It should be noted that the key performance indicators, as applied in the current work, are based on the
loading phase of the capture step only, i.e. do not include other
phases such as elution and CIP, and ignore any remaining mAb in
the mobile phase at the end of the loading phase. For this reason, the way that productivity is defined in Eq. 7a results in higher
values compared to how productivity of capture processes is usually reported [6,12], since, in this case, only the process time for
the loading phase is included in the definition of productivity. For
comparison with other processes, the productivity values should be
(4)
Decision variables : DV = u0 , u1 , . . . , uNu , t f
Constraints : Y ≥ Y min , DVi = DVlb,i , DVub,i
Here, F is the objective function vector consisting of the normalized productivity, P , and the normalized resin utilization, U;
DV is the decision variable vector containing Nu decision variables
3
J. Gomis-Fons, M. Yamanee-Nolin, N. Andersson et al.
Journal of Chromatography A 1635 (2021) 461760
adjusted to include the process time corresponding to the whole
capture step.
The optimization problems were solved using a Matlab variant
of the elitist non-dominated sorting genetic algorithm (NSGA-II),
which is available as part of the built-in gamultiobj function. The
constraint tolerance was set to machine epsilon, with the function
tolerance set to 10−6 , and the population size was set 300. Using
this kind of global, multi-objective algorithm, a set of Pareto optimal solutions are offered to the user, who can then make a decision a posteriori regarding how to weigh the objectives [29].
necessary in Approach I, thus resulting in constant flow rate during
the whole loading phase.
2.2.4. Analytics
The breakthrough curve was detected online with a UV sensor
at a wavelength 280 nm. For the experiments with pure mAb, this
signal was used to obtain the breakthrough curve in mg/mL using
an extinction coefficient of 1.4 (mg/mL)−1 cm−1 [34].
For the experiments with supernatant sample, the breakthrough
baseline was above the linear range of the UV detector, which is
20 0 0 mAU, due to the high concentration of impurities that went
through the column. For that reason, the outlet stream was collected in fractions of 2 mL and analyzed offline. For the analysis
of the fractions, an ÄKTA Explorer 100 equipped with an autosampler was used. The autosampler was set up so that 1 mL of each
fraction was taken and loaded onto the column. A 1 mL prepacked
HiTrapTM column with mAb Select PrismATM resin was used for the
analyses. The process conditions regarding buffers and flow rates
were the same as in the flow trajectory experiments, described
above. However, the elution time was longer to be able to see the
whole elution peak. Knowing the injected volume and the extinction coefficient, the concentration of each fraction was calculated
with the area of the eluate peak.
2.2. Experimental setup
2.2.1. Buffers and sample preparation
Experiments were conducted using two different samples: (i)
a 0.48 mg/mL purified mAb solution for a clear illustration of
the results, and (ii) a 0.48 mg/mL clarified supernatant for proofof-concept. The mAb concentration of the latter was adjusted to
match the concentration at which the experiments with the purified mAb were performed, so that a direct comparison of the experiments with the two different samples could be done. According to the equilibrium data obtained in our previous study [6], the
adsorbed concentration at equilibrium for mobile phase concentrations above 0.5 mg/mL is nearly constant, and the mass transfer
coefficients in the model remain almost constant for higher concentrations provided the viscosity does not increase significantly.
Therefore, the relationship between the feed concentration and
the time it takes for the product to break through the column is
nearly linear. For that reason, almost the same breakthrough curves
would be obtained for equal protein loads in units of mass of product loaded per volume of resin, if the residence time is the same.
Consequently, it can be assumed that the optimal flow trajectories
are general for any feed concentration above 0.5 mg/mL as long as
the protein load is maintained by adjusting the loading time.
The buffers, column volumes and flow rates (except the loading
flow rates) were the ones recommended by the resin manufacturer
for a protein A capture process [30].
2.3. Scale-up method
The processes studied were scaled up to pilot scale with a factor of 10 0 0 and simulated to investigate whether the found trajectories were generalizable across process scales for the mAb Select
PrismA resin. A method to scale up the process is to keep the column length constant and increase the diameter, in a way that both
the flow velocity and the residence time are kept constant. This
scale-up method has been proposed by Heuer et al. [35]. The flow
rate trajectories would be converted to velocity trajectories, by dividing the flow rates by the column section (in this case 0.38 cm2 ),
and the same velocity trajectories could be used for any process
scale. In this work, the column length was 2.5 cm, therefore it was
not practical to keep the same length at larger scales. For that reason, another scale-up method is to change both the column diameter and length, so that the residence time is kept constant, even
if the velocity is not. This method, proposed by Hansen [36], provides flexibility to choose an appropriate length to fulfill a maximum diameter-to-length ratio constraint. He shows that the number of theoretical plates, which is an indication of the column efficiency, increases at a higher column length and constant residence
time, based on a simplified version of the van Deemter equation:
2.2.2. Chromatography station setup
In order to carry out the capture experiments using the optimal
trajectories found via model-based optimization, a single ÄKTATM
pure 150 unit, provided by Cytiva (Uppsala, Sweden), was used
with its standard setup, and it was equipped with the following
devices: two gradient pumps, inlet valves for buffer selection, column valve with built-in pressure sensor, a fractionator, an outlet
valve, and a sensor package that included a UV, a conductivity and
a pH sensor. The sample was injected onto the column with a 100
mL SuperloopTM . The column was a 1 mL prepacked HiTrapTM column with mAb Select PrismATM resin, from Cytiva (Uppsala, Sweden), and the column length and diameter were 2.5 cm and 0.7
cm, respectively.
N=
1
A
L
(10)
+ Cτ
where N is the number of theoretical plates, L is the column
length, τ is the residence time, and A and C are constant terms in
the van Deemter equation. In this work, this scale-up method was
applied, and an empirical expression for the pressure drop over a
packed bed [37] was used to obtain the column length:
2.2.3. Process control
The ÄKTA pure system used during experiments was controlled
with the Python-based software Orbit, which has been described
in detail elsewhere [31-33]. For the particular control problem in
the current work, a function to modify the flow rate based on the
elapsed time was implemented. In Approach II, the total load duration (t f ) was divided by Nu to obtain equal time horizons with
stepwise constant flow rates. The list of flow rates found through
the optimization was specified manually, and used by Orbit to update the flow rate at the start of each horizon. In Approach III, the
linear trajectory was approximated by stepwise constant control
actions updated at a sampling rate, i.e. 1 Hz, which is much more
frequent than in Approach II. Additionally, no flow rate change was
P = αvL =
α L2
τ
(11)
where P is the pressure drop over the column, v is the superficial
velocity, which equals the column length divided by the residence
time, and α is an empirical constant, which was determined by fitting experimental data of pressure drop against velocity provided
by the resin’s vendor. At a higher column diameter-to-length ratio,
the bed compression increases for a specific velocity and column
length due the loss of wall support [37]. In turn, this leads to an
increase of the empirical constant α . For this reason, the experimental data used to obtain α corresponded to a large-scale column
4
J. Gomis-Fons, M. Yamanee-Nolin, N. Andersson et al.
Journal of Chromatography A 1635 (2021) 461760
with a diameter-to-length ratio of 50, which was higher than the
expected ratio. The value of α obtained was 1.5•10−4 bar h cm−2 .
By solving Eq. 11 for L, the maximum column length could be calculated as follows:
Lmax =
Pmax τ
α
(12)
where the maximum pressure drop over the column ( Pmax ) was
the one provided by the resin’s vendor minus a safety margin of
20%, resulting in a value of 1.6 bar. Once the column length was
determined, the column diameter was obtained to achieve the desired column volume while maintaining the residence time.
3. Results and Discussion
3.1. Optimization results
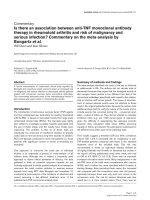
The results from the model-based optimization are compiled as
Pareto fronts and presented in Fig. 2, in which the nominal approach – Approach I (black) – is compared with Approach II (gold)
and Approach III (red) in the upper and lower panel, respectively.
It should be noted that the productivity and resin utilization results are presented as actual (not normalized) values, for an easier
comparison with results from other authors. As can be seen when
comparing the optimal solutions in the three approaches, there is
potential for improvements by adopting a variable flow rate instead of a constant flow rate, with strikingly similar improvements
resulting from the two trajectory strategies explored in this work.
The two strategies presented in Approach II and Approach III always outperform Approach I, except for the Pareto area at maximum productivity, where the Pareto fronts collapse into each other
due to the flow rate being set to the upper bound at all times. Following from the Pareto fronts, it is possible to improve the loading
phase in terms of productivity and resin utilization to different degrees, depending on the point of current operation.
Pareto fronts were obtained for Approach II for several numbers of horizons (Nu ): 2, 5 and 10. For a number of horizons higher
than 5, the performance indicators (productivity and resin utilization) did not improve enough to warrant the increased complexity
of the optimization problem, and thus the increased computation
time and resources to solve the problem. At the same time, the
results were slightly better for the 5-horizons approach than the
dual-flow rate approach, thus showing an improvement with respect to the strategy presented by Ghose et al. [20]. For these reasons, the only Pareto front of Approach II considered for comparison with the other approaches corresponds to a number of horizons equal to 5. Regarding Approach III, the linear trajectory was
compared with a quadratic trajectory, with no significant difference
found. Due to a higher simplicity, it was decided to consider only
the linear trajectory in the comparison of the three approaches. For
comparative reasons, the results for 2 and 10 horizons as well as
the results for the quadratic trajectory are attached in the Supplementary materials section, presented in Figures S1 and S2, respectively.
Fig. 2. The Pareto fronts generated in the model-based multi-objective optimization. The Pareto front for the stepwise trajectory with five horizons is presented in
panel A; and the front for the linear trajectory is presented in panel B. The Pareto
front for one horizon (constant flow rate) is plotted in both panels for comparison.
The points selected for experimental trials are marked by circles, in total five cases:
the constant-flow nominal case (Case I), and two cases for each trajectory approach,
one with improved resin utilization but nearly the same productivity as in Case I
(Cases IIa and IIIa), and one with improved productivity but nearly the same resin
utilization (Cases IIb and IIIb).
from the Pareto fronts. Experiments using a purified mAb solution
were run for all five points to be able to see the breakthrough
curve online without the need of offline analyses. For proof-ofconcept, one of the points (Case IIb, i.e. the high-productivity point
for the stepwise trajectory approach) was tested with clarified supernatant.
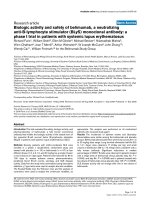
The optimal flow trajectories are presented in Fig. 3, while the
maximized productivity and resin utilization values are shown in
Fig. 4. The constant-flow Case I has a loading duration of 75 minutes and a flow rate of 0.77 mL/min, resulting in a productivity
of 0.55 mg/min/mL resin and a resin utilization of 31.4%, with a
yield of 99.1%. The two stepwise trajectories differ from the nominal case in the loading duration, and in the flow rate levels. In
Case IIa, with an improved resin utilization but constant productivity, the loading duration is roughly 5 minutes longer than Case
I (in total 80 minutes), and the average flow rate is 0.77 mL/min,
giving a productivity of 0.55 mg/min/mL resin and a resin utiliza-
3.2. Experimental validation
The five points highlighted by circles in Fig. 2 were selected
for applying the optimal flow rate trajectories in the laboratory. A
point from the Pareto front of Approach I, denoted by Case I, was
selected as the nominal case. Two points with approximately the
same productivity as that of the Case I and higher resin utilization, were selected from the Pareto fronts of Approaches II and III,
and they were denoted by Cases IIa and IIIa, respectively. Similarly,
two more points with approximately the same resin utilization and
higher productivity, denoted by Cases IIb and IIIb, were selected
5
J. Gomis-Fons, M. Yamanee-Nolin, N. Andersson et al.
Journal of Chromatography A 1635 (2021) 461760
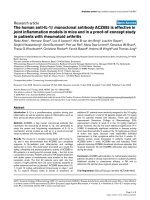
Fig. 4. Optimal productivity and resin utilization values for Case I (black), Cases
IIa and IIb (gold), and Cases IIIa and IIIb (red). The laboratory-scale values obtained
from the simulation are compared with the ones obtained experimentally with pure
monoclonal antibody and with raw supernatant (the latter only for Case IIb). The
five cases were also simulated at pilot scale with a scale factor of 10 0 0.
wise trajectory does not approximate a linear trajectory. In addition, as mentioned, a quadratic trajectory or stepwise trajectories
with higher number of horizons did not lead to any significant difference respect to the linear trajectory. This may lead to the conclusion that complex trajectory shapes may not be necessary to
achieve a more efficient process, but rather simple yet optimized
trajectories are enough to accomplish this goal.
The differences between the simulated results and the experimental ones were ultimately insignificant, as shown in Fig. 4. In
the case with highest deviations (Case IIb), the simulated yield,
productivity and resin utilization were 99.4%, 0.61 mg/min/mL and
31.5%, respectively, while the experimental data were 99.7%, 0.62
mg/min/mL and 31.4%. This shows that a model calibrated using
constant flow rate can be successfully used to optimize a trajectory with variable flow rate.
Fig. 3. Optimal loading flow rate trajectories. The stepwise trajectories plotted in
panel A correspond to Cases IIa and IIb, and the linear trajectories plotted in panel
B correspond to Cases IIIa and IIIb. The constant-flow process (Case I) is shown in
both panels for comparison.
tion of 34.2%, which means a relative increase in resin utilization
of 8.9%, while the yield is 99.4%. Even with an increase in loading
duration, the productivity is nearly the same, and this is primarily due to the increase of adsorbed antibodies onto the resin as an
effect of the decrease of the flow rate towards the end of the loading phase. Similarly, but conversely, the loading duration is shorter
by roughly 8 minutes in Case IIb compared to Case I, i.e., in total
67 minutes, with an average flow rate of 0.86 mL/min, resulting in
a productivity of 0.62 mg/min/mL resin and a resin utilization of
31.5%, which means a relative productivity increase of 11.8%, and a
yield of 99.7%.
The linear trajectories of Case IIIa and Case IIIb are similar to
their corresponding cases of Approach II, with loading durations
and average flow rates of 81 min and 0.77 mL/min, and 67 min
and 0.86 mL/min, respectively; the resulting productivity and resin
utilization for the two cases are 0.55 mg/min/mL resin and 34.0%,
and 0.61 mg/min/mL resin and 31.2%, respectively. The yield is in
both cases above 99%.
Given that the performance of the selected points for Approaches II and III were highly similar, it can be expected that the
trajectories are similar as well. However, it seems that the step-
3.3. Pilot-scale flow rate trajectories
The selected cases were scaled up to pilot scale as described
in Section 3.4. As shown in Table 1, both the column volume and
the flow rate were increased 10 0 0 times compared to laboratory
scale. The column length was approximately 6 times higher than
at laboratory scale for Case I, while it was 4.5-5 times higher for
the other cases. The reason for this difference is that the maximum
flow rate was lower in Case I than in the other cases, which means
that the residence time was higher, and consequently, by Eq. 12,
the resulting column length was also higher. The column diameter
was around 10 cm for all cases, leading to a diameter-to-length ratio between 0.6 and 0.9, which is much lower than the value of 50
that was considered as a worst-case scenario for the prediction of
the pressure drop over the column. This means that the predicted
pressure drop is overestimated, thus giving an extra safety margin.
Regarding the superficial velocities, they were higher than at laboratory scale, as expected, since the column length was increased
and the residence time was maintained.
6
J. Gomis-Fons, M. Yamanee-Nolin, N. Andersson et al.
Journal of Chromatography A 1635 (2021) 461760
Table 1
Column design results for five selected process cases at pilot scale.
Process
casesa)
Column volume
(L)
Column length
(cm)
Column diameter
(cm)
Max. flow rate
(L/min)
Max. velocity
(cm/h)
Case
Case
Case
Case
Case
1
1
1
1
1
15.2
11.6
11.4
12.6
11.6
9.2
10.5
10.6
10.0
10.5
0.77
1.32
1.36
1.12
1.31
703
919
934
845
917
I
IIa
IIb
IIIa
IIIb
a)
Case I: Constant-flow loading; Case II: Stepwise flow rate trajectories; Case III: Linear flow rate trajectories; Cases IIa and IIIa are processes with similar productivity as the one of Case I; Cases IIb and IIIb are
processes with similar resin utilization as the one of Case I.
The pilot-scale cases were simulated with the column dimensions and flow rates obtained, and the productivity, resin utilization and yield were calculated. The productivity and resin utilization values for the simulated pilot-scale process are shown in
Fig. 4 for all process cases. In agreement with Hansen’s statement
[36], the column efficiency is higher if the column length is increased and the residence time remains constant. This leads to a
sharper breakthrough curve, which in turn results in a higher yield
(data not shown). A lower amount of product loss in the breakthrough leads to a slightly higher productivity and resin utilization, as shown in Fig. 4. Another aspect revealed is that having a
variable loading flow rate does not make a significant difference
in terms of process scale-up regardless the type of flow trajectory
applied, as the differences in productivity and resin utilization between the pilot-scale and the laboratory-scale processes are similar
for all the cases studied, as can be seen in Fig. 4.
Another aspect about the scale-up is the wall effects. To avoid
wall effects the recommended minimum number of resin particles
per column section is 200 [38], and with the 1 mL HiTrapTM column used, this number is at highest 117 (obtained by dividing the
column diameter, 0.7 cm, by the particle diameter, 60 μm). This indicates that wall effects were present at laboratory scale, but they
should not be present at a larger scale with a broader column,
which means that the separation would be at least the same and
probably better at a larger scale. However, further experimental research at pilot scale is required to validate this statement, as well
as to find out the aforementioned effect of the loss of wall support
at a larger scale.
explained in our previous study [6]. However, in order to implement a PCC process, a more complex setup is needed, with a minimum of two pumps and numerous valves to determine the pathways. This could be limiting in cases where there is shortage of
resources like chromatography systems and pumps. In addition,
the benefit of a higher resin utilization in a multi-column process
could not pay off the cost of adapting an already-existing batch
process to the multi-column setup in some cases. Therefore, the
potential improvements in productivity and resin utilization with
a flow-programming strategy compared to a conventional capture
process, combined with the lower complexity and cost of adapting
the process setup, may warrant consideration as an alternative to
multi-column continuous chromatography processes.
4. Conclusions
Optimal flow trajectories for the loading phase of the capture
of monoclonal antibodies were obtained for the novel protein A
resin mAb Select PrismA. The two flow-programming approaches
presented in this paper are better in terms of productivity and
resin utilization than the constant-flow approach, as shown in the
optimal Pareto fronts obtained. The productivity can be increased
by up to 12%, and up to a 9% increase in resin utilization can
be achieved, while keeping yield above 99%. In this work, several
types of flow trajectories were studied and compared with each
other with a model-based multi-objective optimization method,
leading to the conclusion that simple but optimized trajectories
are sufficient to achieve a more efficient process compared to a
constant-flow approach. Experimental validation was carried out
for selected trajectories, both with purified mAb and with clarified supernatant, and results indicate that the predicted increase
in the two performance indicators can also be achieved experimentally, which shows that a model calibrated with constant-flow experiments can successfully be used in variable-flow applications. In
addition, the optimal processes selected were scaled up and simulated to show that the productivity, resin utilization and yield are
slightly increased at a larger scale, thus showing that the optimal
flow trajectories obtained are generalizable and applicable across
scales for this specific protein A resin.
The productivity obtained in the variable-flow processes implemented in this work are in the same range as the one obtained
in a multi-column continuous PCC process [6]. Although the resin
utilization is significantly lower than in the PCC process, flowprogramming approaches can be an alternative to complex multicolumn continuous capture processes due to their simplicity and
ease of implementation. The combination of the practical simplicity of the flow-programming approaches, which requires only a
single column operated in batch mode with a variable volumetric
flow rate, and the potential improvements in process performance
indicators, makes this an effective approach towards reducing the
cost of the purification of monoclonal antibodies. In turn, such improvements can potentially help reducing treatments costs, and by
3.4. Comparison with multi-column continuous capture
A variable-flow process can be an alternative to multi-column
continuous processes for the increase of the efficiency in the capture of mAbs. In a comparison between the variable-flow processes
presented here and a PCC process presented in our previous study
[6], where the protein A resin and the protein concentration were
the same as in this work, it can be said that productivity values
are similar. In order to compare both processes, it is fairer to use
the total capture time in the definition of productivity instead of
only the loading time, because in the results from the PCC process, the total capture time is considered. The total capture time
is the loading time plus 60 min, which corresponds to the wash,
elution, regeneration and equilibration phases. Basing the comparison on the total capture time, the productivity values obtained in
the Pareto fronts vary from 0.23 to 0.35 mg/min/mL resin, which
are not far from the productivity values obtained in a PCC process (0.10-0.38 mg/min/mL). Yet, the resin utilization in the PCC
process (ranging from 60 to 99%) is significantly higher than the
values obtained with the flow-programming strategies (from 13 to
50%). This is because in PCC two columns are interconnected during the loading phase, which makes it possible to utilize a higher
amount of available binding sites without compromising yield, as
7
J. Gomis-Fons, M. Yamanee-Nolin, N. Andersson et al.
Journal of Chromatography A 1635 (2021) 461760
extension, contribute to a greater availability of life-saving pharmaceuticals.
[16] K.B. Konstantinov, C.L. Cooney, White Paper on Continuous Bioprocessing May
20–21 2014 Continuous Manufacturing Symposium, J. Pharm. Sci. 104 (2015)
813–820 />[17] R. Hahn, R. Schlegel, A. Jungbauer, Comparison of protein A affinity sorbents,
J. Chromatogr. B 790 (2003) 35–51 />0 0 092-8.
[18] GE Healthcare Bio-Sciences AB, Optimizing productivity on high capacity
protein A affinity mediumGE Healthcare Bio-Sciences AB, Application note
29190587 AA, Uppsala, Sweden, 2016.
[19] K. Lacki, Introduction to Preparative Protein Chromatography, in: G. Jagschies,
E. Lindskog, K. Lacki, P.M. Galliher (Eds.), Biopharmaceutical Processing, Elsevier, Amsterdam, Netherlands, 2017, pp. 319–366. />B978- 0- 08- 100623- 8.00016- 5.
[20] S. Ghose, D. Nagrath, B. Hubbard, C. Brooks, S.M. Cramer, Use and Optimization of a Dual-Flowrate Loading Strategy To Maximize Throughput in Protein-A
Affinity Chromatography, Biotechnol. Progr. 20 (2004) 830–840 />10.1021/bp0342654.
[21] A. Sellberg, M. Nolin, A. Löfgren, N. Andersson, B. Nilsson, Multi-flowrate Optimization of the Loading Phase of a Preparative Chromatographic Separation,
in: A. Friedl, J.J. Klemeš, S. Radl, P.S. Varbanov, T. Wallek (Eds.), Computer Aided
Chemical Engineering, Elsevier, Amsterdam, Netherlands, 2018, pp. 1619–1624.
0- 444- 64235- 6.50282- 5.
[22] A. Sellberg, A. Holmqvist, F. Magnusson, C. Andersson, B. Nilsson, Discretized
multi-level elution trajectory: A proof-of-concept demonstration, J. Chromatogr. A 1481 (2017) 73–81 />[23] E.X. Perez-Almodovar, G. Carta, IgG adsorption on a new protein A adsorbent based on macroporous hydrophilic polymers. I. Adsorption equilibrium
and kinetics, J Chromatogr. A 1216 (2009) 8339–8347 />chroma.2009.09.017.
[24] B. Nilsson, N. Andersson, Simulation of Process Chromatography, in: A. Staby,
A.S. Rathore, S. Ahuja (Eds.), Preparative Chromatography for Separation of
Proteins, John Wiley & Sons, Inc., Hoboken, NJ, USA, 2017, pp. 81–110. https:
//doi.org/10.1002/9781119031116.ch3.
[25] S.O. Rastegar, T. Gu, Empirical correlations for axial dispersion coefficient and
Peclet number in fixed-bed columns, J. Chromatogr. A 1490 (2017) 133–137
/>[26] T.M. Pabst, J. Thai, A.K. Hunter, Evaluation of recent Protein A stationary phase
innovations for capture of biotherapeutics, J. Chromatogr. A 1554 (2018) 45–60
/>[27] M.C. Annesis, L. Merrelli, V. Piemonte, L. Turchetti, Mass Transfer Coefficients,
in: M.C. Annesis, L. Merrelli, V. Piemonte, L. Turchetti (Eds.), Artificial Organ
Engineering, Springer-Verlag, London, UK, 2017, pp. 26–27. />1007/978- 1- 4471- 6443- 2.
[28] H. Schmidt-Traub, M. Schulte, A. Seidel-Morgenstern, Preparative chromatography, Wiley Online Library, 2012 />[29] K. Deb, Multi-objective optimization using evolutionary algorithms, John Wiley & Sons, Inc., Hoboken, NJ, USA, 2001 />559152.
[30] GE Healthcare Bio-Sciences AB, Evaluation of Protein A resin lifetime during
extensive use (overloading) in continuous chromatography modeGE Healthcare
Bio-Sciences AB, Application note 29260553 AA, Uppsala, Sweden, 2017.
[31] J. Gomis-Fons, A. Löfgren, N. Andersson, B. Nilsson, L. Berghard, S. Wood,
Integration of a complete downstream process for the automated lab-scale
production of a recombinant protein, J. Biotechnol 301 (2019) 45–51 https:
//doi.org/10.1016/j.jbiotec.2019.05.013.
[32] N. Andersson, A. Lofgren, M. Olofsson, A. Sellberg, B. Nilsson, P. Tiainen, Design
and control of integrated chromatography column sequences, Biotechnol. Prog.
33 (2017) 923–930 />[33] A. Löfgren, N. Andersson, A. Sellberg, B. Nilsson, M. Löfgren, S. Wood, Designing an Autonomous Integrated Downstream Sequence From a Batch Separation Process − An Industrial Case Study, Biotechnol. J. 13 (2018) 1700691
02/biot.20170 0691.
[34] H. Maity, A. Wei, E. Chen, J.N. Haidar, A. Srivastava, J. Goldstein, Comparison of
predicted extinction coefficients of monoclonal antibodies with experimental
values as measured by the Edelhoch method, Int. J. Biol. Macromol. 77 (2015)
260–265 />[35] C. Heuer, P. Hugo, G. Mann, A. Seidel-Morgenstern, Scale up in preparative
chromatography, J. Chromatogr. A 752 (1996) 19–29 />S0 021-9673(96)0 0496-7.
[36] E.B. Hansen, Chromatographic Scale-Up on a Volume Basis, in: A. Staby,
A.S. Rathore, S. Ahuja (Eds.), Preparative Chromatography for Separation of Proteins, John Wiley & Sons, Inc., Hoboken, NJ, USA, 2017, pp. 227–246. https:
//doi.org/10.1002/9781119031116.ch7.
[37] J.J. Stickel, A. Fotopoulos, Pressure-Flow Relationships for Packed Beds of Compressible Chromatography Media at Laboratory and Production Scale, Biotechnol. Prog. 17 (2001) 744–751.
[38] S. Kidal, O.E. Jensen, Using volumetric flow to scaleup chromatographic processes, Biopharm. Int. 19 (2006) 34–44.
Declaration of Competing Interest
The authors declare that they have no conflict of interest.
Acknowledgements
The authors acknowledge that this research is a collaboration
between the Competence Centre for Advanced BioProduction by
Continuous Processing (AdBIOPRO) [grant number 2016-05181] and
the AutoPilot project [grant number 2019-05314], both funded by
VINNOVA, the Swedish Agency for Innovation.
Supplementary materials
Supplementary material associated with this article can be
found, in the online version, at doi:10.1016/j.chroma.2020.461760.
References
[1] H.L. Levine, B.R. Cooney, The Development of Therapeutic Monoclonal Antibody Products, BioProcess Technology Consultants, Inc., Woburn, MA, USA,
2017.
[2] M. Dileo, A. Ley, A.E. Nixon, J. Chen, Choices of capture chromatography
technology in antibody manufacturing processes, J. Chromatogr. B 1068-1069
(2017) 136–148 />[3] J. Pollock, J. Coffman, S.V. Ho, S.S. Farid, Integrated Continuous Bioprocessing,
Economic, Operational, and Environmental Feasibility for Clinical and Commercial Antibody Manufacture, Biotech. Prog. 33 (2017) 854–866 />1002/btpr.2492.
[4] A.L. Zydney, Perspectives on integrated continuous bioprocessing—
opportunities and challenges, Curr. Opin. Chem. Eng. 10 (2015) 8–13
/>[5] A.A. Shukla, B. Hubbard, T. Tressel, S. Guhan, D. Low, Downstream processing
of monoclonal antibodies—Application of platform approaches, J. Chromatogr.
B 848 (2007) 28–39 />[6] J. Gomis-Fons, N. Andersson, B. Nilsson, Optimization study on periodic
counter-current chromatography integrated in a monoclonal antibody downstream process, J. Chromatogr. A 1621 (2020) 461055 />chroma.2020.461055.
[7] L. Arnold, K. Lee, J. Rucker-Pezzini, J.H. Lee, Implementation of Fully Integrated
Continuous Antibody Processing: Effects on Productivity and COGm, Biotechnol. J. 14 (2019) 180 0 061 02/biot.20180 0 061.
[8] A.S. Rathore, Harshit Agarwal, Abhisek Kumar Sharma, Mili Pathak,
S. Muthukumar, Continuous Processing for Production of Biopharmaceuticals, Prep. Biochem. Biotech. 45 (2015) 836–849 />10826068.2014.985834.
[9] J. Gomis-Fons, H. Schwarz, L. Zhang, N. Andersson, B. Nilsson, A. Castan,
A. Solbrand, J. Stevenson, V. Chotteau, Model-based design and control of a
small-scale integrated continuous end-to-end mAb platform, Biotechnol. Progr.
(2020) e2995 />[10] R. Godawat, K. Konstantinov, M. Rohani, V. Warikoo, End-to-end integrated
fully continuous production of recombinant monoclonal antibodies, J. Biotechnol 213 (2015) 13–19 />[11] C.K.S. Ng, F. Rousset, E. Valery, D.G. Bracewell, E. Sorensen, Design of high productivity sequential multi-column chromatography for antibody capture, Food
Bioprod. Process. 92 (2014) 233–241 />[12] M. Angarita, T. Müller-Späth, D. Baur, R. Lievrouw, G. Lissens, M. Morbidelli,
Twin-column CaptureSMB, A novel cyclic process for protein A affinity chromatography, J. Chromatogr. A 1389 (2015) 85–95 />chroma.2015.02.046.
[13] L. Aumann, M. Morbidelli, A continuous multicolumn countercurrent solvent
gradient purification (MCSGP) process, Biotechnol. Bioeng. 98 (2007) 1043–
1055 />[14] N. Andersson, H.-K. Knutson, M. Max-Hansen, N. Borg, B. Nilsson, Model-Based
Comparison of Batch and Continuous Preparative Chromatography in the Separation of Rare Earth Elements, Ind. Eng. Chem. Res. 53 (2014) 16485–16493
/>[15] R. Godawat, K. Brower, S. Jain, K. Konstantinov, F. Riske, V. Warikoo, Periodic counter-current chromatography – design and operational considerations
for integrated and continuous purification of proteins, Biotechnol. J. 7 (2012)
1496–1508 02/biot.20120 0 068.
8