A rapid, simple and sensitive microfluidic chip electrophoresis mass spectrometry method for monitoring amino acids in cell culture media
Bạn đang xem bản rút gọn của tài liệu. Xem và tải ngay bản đầy đủ của tài liệu tại đây (1.07 MB, 7 trang )
Journal of Chromatography A 1651 (2021) 462336
Contents lists available at ScienceDirect
Journal of Chromatography A
journal homepage: www.elsevier.com/locate/chroma
Short Communication
A rapid, simple and sensitive microfluidic chip electrophoresis mass
spectrometry method for monitoring amino acids in cell culture media
Meire Ribeiro da Silva a, Izabela Zaborowska a, Sara Carillo a, Jonathan Bones a,b,∗
a
b
NIBRT – National Institute for Bioprocessing Research and Training, Dublin, Ireland
School of Chemical and Bioprocess Engineering, University College Dublin, Dublin 4, Ireland
a r t i c l e
i n f o
Article history:
Received 27 February 2021
Revised 1 June 2021
Accepted 4 June 2021
Available online 9 June 2021
Keywords:
Capillary electrophoresis mass spectrometry
Amino acid analysis
Spent media analysis
Cell culture
Monoclonal antibody
Upstream processing
a b s t r a c t
The development and optimization of cell culture media for biotech applications is a fundamental step
of process development. The composition of cell culture media requires an ideal blend of amino acids,
vitamins, nucleosides, lipids, carbohydrates, trace elements and other components. The ability to monitor these constituents is required to ensure that cells receive sufficient nutrients to facilitate growth,
viability and productivity. Analysis of cell culture media is challenging due to the range and diversity of
compounds contained in this matrix and normally requires time consuming methods. A rapid, simple and
sensitive microfluidic chip CE-MS method is described to monitor amino acids in chemically defined cell
culture media from a Chinese hamster ovary cell line cultured over a period of 10 days. The described
platform enabled the separation of 16 amino acids in less than 2 minutes and without the requirement
for extensive sample preparation. The analytical parameters evaluated were precision, linearity, limit of
detection and limit of quantification. The majority of essential amino acids were present in cell culture
growth in high concentrations compared to non-essential amino acids. Over the course of the 10 days cell
culture the concentration of certain amino acids declined by up to 100%. Microfluidic chip based CE-MS
methods can be used effectively to obtain the consumption rates of amino acids in cell culture media
during cell growth and to perform at-line monitoring and screening of cell culture status.
© 2021 The Author(s). Published by Elsevier B.V.
This is an open access article under the CC BY license ( />
1. Introduction
Cell culture media (CCM) is a key component of upstream bioprocessing and correct selection of an appropriate CCM is vital
to ensure optimal performance for both cell growth and recombinant protein yield and quality. CCM is composed of various amino
acids, vitamins, inorganic salts, nucleosides and anti-shear agents.
The quantity of each component present may affect cell growth,
specific productivity and other performance parameters. Therefore,
the optimization and customisation of CCM have been extensively
studied to address nutrient demands of cell lines and to control
toxic metabolite production [1–5]. Among these nutrients, amino
acids (AAs) are essential as they are the primary constituents of
proteins and intermediates in a variety of cellular metabolic pathways. During cell growth, AAs can be both consumed from and
released into the CCM. Monitoring AAs is crucial to understand
the dynamic conditions and to adjust the concentration of each
∗
Corresponding author at: NIBRT – National Institute for Bioprocessing Research
and Training, Dublin, Ireland.
E-mail address: (J. Bones).
AA in the CCM accordingly to optimize recombinant protein yield
and quality [6]. The analysis of AA in CCM can be challenging due
to the potential presence of interfering compounds depending on
CCM composition. Additionally, AAs are typically amphoteric with
significant differences in their chemical structures, different polarities from non-polar to highly polar and acidic to basic side chains,
all these properties may affect detection and separation [7].
Different approaches have been described to monitor AAs in
spent media such as liquid chromatography with either optical
(LC-UV or LC-fluorescence) or mass spectrometric detection (LCMS) and gas chromatography with either flame ionisation (GC-FID)
or mass spectrometric detection (GC-MS) [8–13]. The majority of
these techniques include sample preparation steps such as derivatization, solid-phase microextraction (SPME), solid-phase extraction
(SPE) and others, which increased the complexity of the method,
the associated time required to perform the analysis and the risk of
analyte loss during extraction and sample preparation [8,13]. Rapid
LC-MS methods have improved analysis time by avoiding derivatization steps, however, ion pairing reagents are often used that reduce sensitivity and increase the risk of potential problems with
quantitation due to ion suppression [8,9]. As the ideal analytical
/>0021-9673/© 2021 The Author(s). Published by Elsevier B.V. This is an open access article under the CC BY license ( />
M. Ribeiro da Silva, I. Zaborowska, S. Carillo et al.
Journal of Chromatography A 1651 (2021) 462336
approach to monitor AAs is to avoid complex sample preparation,
miniaturization of analytical devices and the use of microfluidic
techniques provides an interesting analytical option that allows
fast analysis, high sensitivity and low consumption of reagents and
sample [14–18].
Microfluidic capillary electrophoresis (CE) is an attractive analytical option as it offers low consumption of background electrolyte and reagents, excellent performance, fast separation and is
suited to a wide range of applications ranging from small molecule
analysis to characterisation of intact proteins [19–24]. As well, CE
has been widely used for AA analysis in a variety of complex matrices [25]. Microfluidic chip CE technology is versatile and can be
coupled to different detection options including optical, electrochemical and mass spectrometric detectors [25]. Microfluidic chip
CE coupled to MS operates at low flow rates, similar to nanospray
ionisation, which enables maximization of MS sensitivity. However,
CE and MS coupling is not without its challenges, due to the use of
low pressure, ensuring stability of the low operational flow rates
and compatibility of components of the background electrolyte
with MS detection [26]. Many applications utilizing microfluidic
chip CE-MS using electrospray ionization have highlighted the reduction of analysis time and the increase in sensitivity [22,27,28].
The present study focuses on the analysis of AAs in spent
cell culture media using microfluidic chip CE-MS to generate a
rapid, simple and sensitive method to monitor AAs in spent media
from IgG1 monoclonal antibody expressing Chinese Hamster Ovary
(CHO) cells over a 10 day batch culture, employing stable isotopically labelled AAs as internal standards. The optimised method
proved to be simple and rapid with minimal sample preparation
required, while the use of high resolution Orbitrap mass spectrometry for the detection of the amino acids provided improved selectivity and quantitative capability for those AAs that were difficult to separate during the rapid CE analysis. The method is advantageous and sufficiently fast to provide an at-line analysis for
the identification and quantification of AAs consumed during cell
growth to ensure that cells are maintained in an optimal environment for proliferation and production.
when the cell viability dropped below 70%, which generally occurred after day 9. Samples were collected on a daily basis by removing 2 mL aliquots from the cultures, which were centrifuged
to pellet the cells and the collected supernatant was stored at 4°C
prior to analysis. Prior to analysis of analytical samples, the collected cell culture media samples were diluted 20 times with LCMS grade water and spiked with 1 μL of the IS stock solution described below to yield a final concentration of 1 μM of IS. Data
points for the concentration of each AA were calculated from triplicate injection of the samples obtained from each biological replicate (n = 9)
2.3. Preparation of calibration standards
Stable heavy isotope-labelled AA were employed as internal
standards (IS) and were prepared as standard 500 μM solutions
and subsequently diluted to obtain 50 μM, 5.0 μM, 0.5 μM and
0.05 μM calibration solutions, using fresh cell culture media diluted 1:20 v/v with LC-MS water. These stock solutions were diluted 1:10 v/v with metabolite sample diluent provided in the
ZipChip metabolite kit to obtain a standard calibration curve. These
standards were analysed in triplicate and the peak area obtained
from the base peak chromatograms were used to estimate a calibration factor that was used in sample concentration calculations.
2.4. Microfluidic chip CE-MS settings
All analyses were performed using a ZipChipTM device and autosampler from 908 Devices (Boston, MA), that was interfaced with
a Q ExactiveTM Plus hybrid quadrupole Orbitrap mass spectrometer (Thermo, Bremen, Germany). The mass spectrometer settings
included: mass resolution 17,500 at m/z 200, 5 micro scans, an acquisition gain control (AGC) target 1 × 10⁶ , maximum inject time
100 ms, spray voltage 0 kV, sheath gas flow rate 2 arbitrary units
(au), auxiliary and sweep gas flow rate 0 au, capillary temperature at 200°C, S-lens radio frequency (RF) level 50, with data acquired over a mass range of 70–500 m/z. Data acquisition was
accomplished through the XcaliburTM tune page, which was triggered by the ZipChip software. The microfluidic chip CE settings
were: injection load time 30 s at 2 Pa (4 nL), analysis run time
3 minutes, pressure assist start time 0.5 minutes and field strength
10 0 0 V/cm.
2. Materials and methods
2.1. Chemicals and reagents
A ZipChipTM HS chip (cat# 810-0013) and ZipChip Metabolites
Kit (cat#850-0 0 033), including the ZipChip Metabolites BGE, sample diluent and acid were obtained from 908 Devices (Boston, MA,
USA). Stable isotope labelled AAs and Metabolomics Amino Acid
Mix Solution were obtained from Cambridge Isotope Laboratories,
Inc. (MSK-A2-1.2 P/N 17K-628, UK). LC-MS Optima grade water was
purchased from Fisher Scientific (Dublin, Ireland).
3. Results and discussion
3.1. Rapid separation of amino acids using microfluidic chip CE-MS
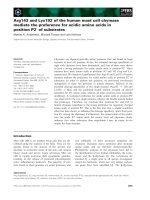
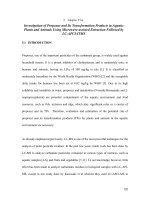
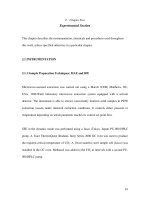
Fig. 1a depicts the base peak electropherogram following injection of the 50 μM of AAs standard mix solution. In this instance,
since the BGE is acidic, all AAs are positive charged and the resulting separation of the 16 AAs is based on the difference of electrophoretic mobility that is related to the charge and size of the
analytes. As expected, the amino acid migration order observed
was highly charged AAs migrating first, followed by neutral AAs
and then the acidic residues. The 16 AAs could be separated using
a three minute method, with a separation window spanning less
than two minutes and with sample requirements of 4 nL per injection. The method resulted in symmetrical and narrow peaks with
asymmetry values ranging between 0.96 and 1.32, average asymmetry 1.07, peak width at half height ranges between 0.006 and
0.036 minutes, average peak width 0.0133 minutes and good resolution. Some of the AAs were not fully resolved within the separation window with comigrating pairs observed at migration times
from 1.4 to 2.0 minutes correspond to methionine and threonine,
phenylalanine and proline as showed in Fig. 1A. Comigration of
certain amino acids such as methionine and threonine, asparagine
2.2. Cell culture and sample preparation
CHO DP-12 cells [CHO DP12, clone#1934 aIL8.92 NB 28605/14]
(ATCC® CRL12445TM ) were adapted to grow in suspension in
animal-component free, chemically defined medium BalanCD CHO
Growth A (Irvine Scientific, Wicklow, Ireland) with the addition of
4 mM L-glutamine (Sigma Aldrich, Wicklow, Ireland). Cells were
cultured using batch culture conditions in triplicate. Cultures were
initiated by seeding 0.3 × 10⁶ cells/mL in 250 mL polycarbonate
Erlenmeyer flasks (Corning, Amsterdam, The Netherlands) containing 100 mL of media supplemented with 4 mM of L-glutamine
on day 0. Cells were cultivated in a shaking incubator at 37°C, 5%
CO2 for 10 days. Cell density and viability were determined daily
by trypan blue exclusion assay using a Countess automated cell
counter (Invitrogen, Carlsbad, CA, USA). Cell culture was stopped
2
M. Ribeiro da Silva, I. Zaborowska, S. Carillo et al.
Journal of Chromatography A 1651 (2021) 462336
Iso
(A
His
100
Val
90
Leu
Lys
Arg
Relative Abundance
80
70
Met/Thr Phe/Pro
Ala
60
50
40
Ser
30
Glu
Gly
20
Tyr
Asp
10
0
0.5
0.6
0.7
0.8
0.9
1.0
1.1
1.2
1.3
1.4
1.5
1.6
1.7
1.8
1.9
2.0
Time (min)
(B
Asp
Tyr
Glu
Pro
Phe
Thr
Met
Ser
Iso/Leu
Val
Ala
Gly
Arg
His
Lys
Fig. 1. (a) Electropherogram of the mixture of 16 heavy labelled AAs (50 μM) used as internal standard. (b) Extracted ion chromatogram of the individual heavy labelled
amino acids. The figure shows the excellent resolution of the analytes in less than 2 minutes of analysis time.
The microfluidic chip CE-MS approach was next applied to evaluate samples of conditioned cell culture media, however, prior to
proceeding with the analysis of a real samples, calibration curves
for each amino acid were prepared. L-cysteine was observed to
be unstable in the cell culture media and was easily oxidized to
form cystine in aqueous solution [29,30]. Accordingly, it was not
included for further study. The range of concentrations analysed in
this study was overall well above the limit of detection and sensitivity of the instrument; however, internal standard (0.1 μM for
all AAs) measurements were used to evaluate the precision of the
method, which showed %RSD values <10%, except for methionine
(%RSD = 13.6), bringing the LOQ and LOD well below this concentration level. This value is in the range of what reported before
and proline, tyrosine and glutamic acid, glutamic acid and cysteine
are commonly described in the literature with both LC and CE separation; this behaviour can be attributed to respective pKa values and similarities in electrophoretic mobility behaviour of these
compounds [7,24]. Despite observed co-migration, coupling of the
chip based separation with MS detection facilitated identification
and quantitation of these comigrating pairs as shown in the extracted ion electropherogram in Fig. 1b.
A concern when using microfluidic chip CE can relate to low
performance with regard to reproducibility and robustness, however, the migration time reproducibility for the AAs analysed in
this study was excellent, with determined %RSD values lower than
1.10% over 6 injections.
3
M. Ribeiro da Silva, I. Zaborowska, S. Carillo et al.
Journal of Chromatography A 1651 (2021) 462336
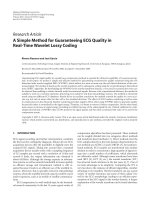
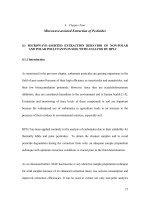
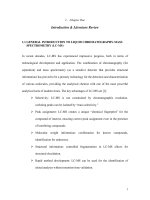
Fig. 2. Relative abundance trends of the amino acids included in this study (a-q), when compared to viable cell density growth curve (r).
for CE analysis of AAs, using either optical or MS based detection
methods [25]. The presented microfluidic chip CE-MS method offers excellent sensitivity with low sample and reagent consumption and enables rapid and simple method development, requiring
only dilution when compared to previously reported methods [8–
13,23,24,31].
3.2. Application of the developed microfluidic chip CE-MS method for
monitoring AA in CCM
To demonstrate the applicability of the developed microfluidic
chip CE-MS method for monitoring AAs in conditioned cell culture media, IgG1 mAb producing CHO cells were cultured in shake
flasks and samples were collected daily over the 10 days of batch
culture. Samples were diluted with the IS containing diluent and
analysed by microfluidic chip CE-MS as outlined above.
4
M. Ribeiro da Silva, I. Zaborowska, S. Carillo et al.
Journal of Chromatography A 1651 (2021) 462336
Table 1
Summary of the analysis parameters on the analysed AAs and their calibration curves.
Amino Acid
[M+H]+ Monoisotopic mass
[M+H]+ Internal Standard
Migration time (min)
RSD (%)
Lysine
Arginine
Histidine
Glycine
Alanine
Valine
Leucine
Isoleucine
Serine
Methionine
Threonine
Phenylalanine
Proline
Glutamic Acid
Tyrosine
Aspartic Acid
147.1128
175.119
156.0768
76.0393
90.055
118.0863
132.1019
132.1019
106.0499
150.0583
120.0655
166.0863
116.0706
148.0604
182.0812
134.0448
155.127
165.088
185.1272
79.043
94.0621
124.1001
139.1191
139.1191
110.057
156.0721
125.076
176.1135
122.0844
154.0742
192.1084
139.0552
0.904
0.953
1.005
1.032
1.110
1.394
1.452
1.419
1.503
1.611
1.611
1.692
1.733
1.792
1.890
1.983
0.85
0.85
0.82
0.93
1.10
0.61
0.55
0.63
0.39
0.56
0.29
0.38
0.32
0.33
0.07
0.50
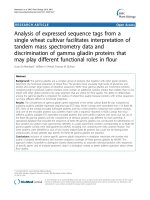
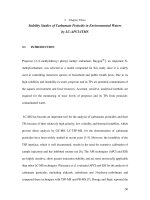
Fig. 3. Base peak chromatogram (BPC) of the electropherograms of spent media analysed at day 1 (a) and day 10 (b) of cellular growth.
Across the 10 days of cell culture the majority of the 16 AAs
present in the chemically defined CCM used in the present study
show similar range of concentration. The consumption rates of AA
in cell culture medium are influenced by the genetic composition
of cells, the cell cycle, environment and other characteristics. The
consumption of AA was clearly observed from day 1 to 10 where
the concentration declined up to 87% for the AAs quantified in
this study as shown in Fig. 2. In the study, for three amino acids
(asparagine, glutamine, tryptophan) it was not possible to obtain
a heavy labelled standard; as a consequence, their concentration
trends were obtained as relative abundance compared to day 1,
rather than as absolute amount in the media, and showed total
consuption of the AA in two cases (Table 2).
Fast consumption rate of phenylalanine, methionine, serine,
leucine, isoleucine, valine, histidine and lysine was observed from
day 5 to day 8 suggesting that supplementation of these amino
acids is necessary using associated feeding strategies.
Limiting supply of phenylalanine, methionine, leucine, serine
and others have been noted to result in inhibition of cell growth
as they interact with key metabolic processes such as the TCA cycle [4]. As observed in the current study from day 7 to day 9, the
number of viable cells reduced associated with the observed reduction in the levels of phenylalanine, methionine, leucine and serine, leading to potential nutrient stress, as shown in Fig. 2. Other
non-essential AA showed a different trajectory with alanine and
glutamic acid observed to increase over the 10 days of cell culture,
which can be explained by reversible transamination reactions that
occur as part of the TCA cycle based on interaction with other
intermediates such as alpha-ketoglutarate, pyruvate and oxaloacetate. As a result the net levels of glutamic acid can be related to
aspartate and if the concentration of aspartic acid in the media is
in abundance, the equilibria of the metabolic reactions are altered
to release glutamate which in turn results in interconversion and
release of alanine [3,32,33].
Among the AAs quantified, arginine levels were noted to be stable during the 10 days of cell culture suggesting a balance between
the cellular production and consumption of this amino acid.
5
M. Ribeiro da Silva, I. Zaborowska, S. Carillo et al.
Journal of Chromatography A 1651 (2021) 462336
Table 2
Daily values for the concentrations of the AAs included in the study during the 10 days of cell culture growth experiment. Values correspond to the average from 9 measurements (3 biological replicates and 3 technical replicates on
each samples).
∗
Amino Acid
Concentration (mg/L)
Day 1
Day 2
Day 3
Day 4
Day 5
Day 6
Day 7
Day 8
Day 9
Day 10
Lysine
Arginine
Histidine
Glycine
Alanine
Valine
Isoleucine
Leucine
Serine
Threonine
Methionine
Phenylalanine
Proline
Glutamic Acid
Tyrosine
Aspartic Acid
Asparagine∗
Glutamine∗
Tryptophan∗
12.86
32.79
7.42
15.21
1.05
5.10
8.01
10.06
7.83
9.76
1.93
3.29
5.44
2.80
3.61
22.14
100
100
100
14.03
34.89
8.45
9.01
3.46
4.97
8.30
10.07
8.34
10.89
1.82
3.25
5.85
5.31
3.60
16.77
79.4
103.8
114.2
14.17
33.36
9.08
12.60
5.38
4.67
8.04
9.41
8.11
11.20
1.66
3.08
5.88
6.65
3.60
15.76
50.0
60.5
119.1
10.60
31.81
6.80
10.20
6.67
3.27
6.30
6.90
6.13
8.79
1.07
1.99
4.98
6.67
2.37
13.97
8.8
11.2
80.0
10.36
31.56
6.83
8.45
8.46
2.44
5.08
5.24
4.80
8.83
0.70
1.41
5.38
7.76
1.95
13.94
0.2
1.6
65.4
8.42
28.53
5.14
8.47
7.90
1.00
2.95
2.00
1.71
6.85
0.26
0.48
5.11
7.70
1.33
7.11
0.0
37.2
32.7
8.50
28.19
5.51
12.13
6.88
1.06
2.96
1.88
0.94
6.95
0.34
0.56
5.68
9.43
1.24
4.82
0.0
1.8
20.6
8.98
33.00
5.47
7.85
7.25
1.39
2.84
2.07
0.96
7.79
0.48
0.79
6.17
10.88
1.49
3.56
0.0
0.0
28.0
15.63
36.25
9.96
10.21
1.60
5.93
9.50
12.41
9.08
12.20
2.27
3.85
6.36
4.02
4.35
21.26
123.4
151.8
128.1
14.72
34.98
8.71
9.12
2.26
5.00
8.34
10.46
8.50
10.96
2.00
3.49
5.96
4.42
3.85
16.70
103.5
131.0
116.6
Values for these AAs were calculated as relative amount in media compared to day 1.
The ability to monitor CHO cell growth when cultured in batch
mode without AAs supplementation facilitates identification of
amino acids levels throughout the duration of culture to identify
which amino acids remain at stable levels within the media and
which potentially become limiting and thereby require supplementation through feeding. These experiments could contribute to optimization of supplementation feeds for recombinant protein producing cell lines and suggest that some of the AA may require fine
tuning to ensure sufficient nutrient availability to promote cell proliferation and protein expression.
Acknowledgements
The authors gratefully acknowledge funding from Thermo
Fisher Scientific as part of a funded collaborative agreement with
NIBRT. Ashley Bell, Erin Redman and Trent Basarsky from 908 Devices are gratefully acknowledged for instrument access and technical assistance with the ZipChip instrument used to generate the
experimental data. Authors acknowledge collaborative funding support from Thermo Fisher Scientific and access to the Q Exactive MS
instrumentation used during the current study.
References
4. Conclusions
[1] W.P.K. Chong, L.T. Goh, S.G. Reddy, F.N.K. Yusufi, D.Y. Lee, N.S.C. Wong,
C.K. Heng, M.G.S. Yap, Y.S. Ho, Metabolomics profiling of extracellular metabolites in recombinant Chinese Hamster Ovary fed-batch culture, Rapid Commun.
Mass Spectrom. 23 (2009) 3763–3771, doi:10.1002/rcm.4328.
[2] C.A. Sellick, A.S. Croxford, A.R. Maqsood, G.M. Stephens, H.V. Westerhoff,
R. Goodacre, A.J. Dickson, Metabolite profiling of CHO cells: molecular reflections of bioprocessing effectiveness, Biotechnol. J. 10 (2015) 1434–1445,
doi:10.10 02/biot.20140 0664.
[3] T.M. Duarte, N. Carinhas, L.C. Barreiro, M.J. Carrondo, P.M. Alves, A.P. Teixeira,
Metabolic responses of CHO cells to limitation of key amino acids, Biotechnol.
Bioeng. 111 (2014) 2095–2106, doi:10.1002/bit.25266.
[4] S. Pereira, H.F. Kildegaard, M.R. Andersen, Impact of CHO metabolism on
cell growth and protein production: an overview of toxic and inhibiting
metabolites and nutrients, Biotechnol. J. 13 (2018) e1700499, doi:10.1002/biot.
201700499.
[5] Z. Xing, B. Kenty, I. Koyrakh, M. Borys, S.-H. Pan, Z.J. Li, Optimizing amino acid
composition of CHO cell culture media for a fusion protein production, Process
Biochem. 46 (2011) 1423–1429, doi:10.1016/j.procbio.2011.03.014.
[6] T.S. Stoll, A. Chappaz, U. von Stockar, I.W. Marison, Effects of culture conditions
on the production and quality of monoclonal IgA, Enzyme Microb. Technol. 21
(1997) 203–211, doi:10.1016/S0141- 0229(96)00268- 2.
[7] L.M. Carrillo-Cocom, T. Genel-Rey, D. Arz-Hernández, F. López-Pacheco,
J. López-Meza, M.R. Rocha-Piza, A. Ramírez-Medrano, M.M. Alvarez, Amino
acid consumption in nạve and recombinant CHO cell cultures: producers
of a monoclonal antibody, Cytotechnology 67 (2015) 809–820, doi:10.1007/
s10616- 014- 9720- 5.
[8] T. Mohabbat, B. Drew, Simultaneous determination of 33 amino acids and
dipeptides in spent cell culture media by gas chromatography-flame ionization
detection following liquid and solid phase extraction, J. Chromatogr. B Anal.
Technol. Biomed. Life Sci. 862 (2008) 86–92 10.1016/j.jchromb.20 07.11.0 03.
[9] A. Le, A. Ng, T. Kwan, K. Cusmano-Ozog, T.M. Cowan, A rapid, sensitive
method for quantitative analysis of underivatized amino acids by liquid
chromatography-tandem mass spectrometry (LC-MS/MS), J. Chromatogr. B
Anal. Technol. Biomed. Life Sci. 944 (2014) 166–174 10.1016/j.jchromb.2013.11.
017.
[10] Y. Song, T. Funatsu, M. Tsunoda, Rapid determination of amino acids in biological samples using a monolithic silica column, Amino Acids 42 (2012) 1897–
1902, doi:10.10 07/s0 0726- 011- 0914- 2.
A microfluidic chip CE-MS method was developed for the quantitative determination of AAs in chemical defined CCM that enabled quantification and excellent reproducibility. The use of stable
isotope labelled amino acids as internal standards for quantitative
determination enhanced the accuracy and precision of the method
especially when applied to conditioned media samples. This fast
analytical approach with low sample consumption may be important during early-stage upstream process development or media optimisation using multiplexed microbioreactors where sample
availability can be challenging. The method described in this study
could be used as a rapid screening method to identify the AAs
contained in the cell culture media, identify or monitor the consumption of AAs during the cell growth to support and enhance
the productivity of recombinant proteins.
Author contribution
Meire Ribeiro da Silvia: Methodology, Investigation, Formal
analysis, Writing – Original Draft; Izabela Zaborowska: Investigation; Sara Carillo: Supervision, visualization, Writing – Review &
editing; Jonathan Bones: Conceptualization, Funding acquisition,
Supervision, Writing – Review & editing
Declaration of Competing Interest
This research was part-funded by Thermo Fisher Scientific as
part of a funded collaborative agreement between NIBRT and
Thermo Fisher Scientific.
6
M. Ribeiro da Silva, I. Zaborowska, S. Carillo et al.
Journal of Chromatography A 1651 (2021) 462336
[11] J. Qiu, P.K. Chan, P.V. Bondarenko, Monitoring utilizations of amino acids and
vitamins in culture media and Chinese hamster ovary cells by liquid chromatography tandem mass spectrometry, J. Pharm. Biomed. Anal. 117 (2016)
163–172 10.1016/j.jpba.2015.08.036.
[12] A. Socia, J.P. Foley, Direct determination of amino acids by hydrophilic interaction liquid chromatography with charged aerosol detection, J. Chromatogr. A
1446 (2016) 41–49, doi:10.1016/j.chroma.2016.03.042.
[13] R. Gatti, M.G. Gioia, A. Leoni, A. Andreani, 2,5-Dimethyl-1H-pyrrole-3,4dicarbaldehyde as a precolumn derivatization reagent for HPLC/UV detection
of amino acids, J. Pharm. Biomed. Anal. 53 (2010) 207–211, doi:10.1016/j.jpba.
2009.12.031.
[14] N.T. Tran, I. Ayed, A. Pallandre, M. Taverna, Recent innovations in protein separation on microchips by electrophoretic methods: an update, Electrophoresis
31 (2010) 147–173, doi:10.10 02/elps.20 090 0465.
[15] Y. Peng, A. Pallandre, N.T. Tran, M. Taverna, Recent innovations in protein separation on microchips by electrophoretic methods, Electrophoresis 29 (2008)
157–178, doi:10.10 02/elps.20 070 0347.
[16] G.A. Marko-Varga, J. Nilsson, T. Laurell, New directions of miniaturization
within the biomarker research area, Electrophoresis 25 (2004) 3479–3491,
doi:10.10 02/elps.20 0406109.
[17] G.A. Valaskovic, N.L. Kelleher, Miniaturized formats for efficient mass
spectrometry-based proteomics and therapeutic development, Curr. Top. Med.
Chem. 2 (2002) 1–12, doi:10.2174/1568026023394597.
[18] K. Farhadi, M. Hatami, A.A. Matin, Microextraction techniques in therapeutic
drug monitoring, Biomed. Chromatogr. 26 (2012) 972–989, doi:10.1002/bmc.
2774.
[19] F.-A. Li, C.-H. Wang, G.-R. Her, A sheathless poly(methyl methacrylate) chipCE/MS interface fabricated using a wire-assisted epoxy-fixing method, Electrophoresis 28 (2007) 1265–1273, doi:10.1002/elps.200600552.
[20] E.A. Redman, N.G. Batz, J.S. Mellors, J.M. Ramsey, Integrated microfluidic capillary electrophoresis-electrospray ionization devices with online MS detection
for the separation and characterization of intact monoclonal antibody variants,
Anal. Chem. 87 (2015) 2264–2272, doi:10.1021/ac503964j.
[21] Y. Zhang, Y. Wang, Z. Sosic, L. Zang, S. Bergelson, W. Zhang, Identification of
adeno-associated virus capsid proteins using ZipChip CE/MS, Anal. Biochem.
555 (2018) 22–25 10.1016/j.ab.2018.06.006.
[22] B. Zhang, F. Foret, B.L. Karger, High-throughput microfabricated CE/ESI-MS: automated sampling from a microwell plate, Anal. Chem. 73 (2001) 2675–2681,
doi:10.1021/ac001432v.
[23] K.M. Grinias, J.M. Godinho, E.G. Franklin, J.T. Stobaugh, J.W. Jorgenson, Development of a 45kpsi ultrahigh pressure liquid chromatography instrument for
gradient separations of peptides using long microcapillary columns and sub2μm particles, J. Chromatogr. A 1469 (2016) 60–67, doi:10.1016/j.chroma.2016.
09.053.
[24] W.M. Gilliland, J.M. Ramsey, Development of a microchip CE-HPMS platform
for cell growth monitoring, Anal. Chem. 90 (2018) 130 0 0–130 06 10.1021/acs.
analchem.8b03708.
[25] H.Y. Ta, F. Collin, L. Perquis, V. Poinsot, V. Ong-Meang, F. Couderc, Twenty years
of amino acid determination using capillary electrophoresis: a review, Anal.
Chim. Acta (2021) 338233, doi:10.1016/j.aca.2021.338233.
[26] W.N. Gao, L.F. Yau, L. Liu, X. Zeng, D.C. Chen, M. Jiang, J. Liu, J.R. Wang,
Z.H. Jiang, Microfluidic chip-LC/MS-based glycomic analysis revealed distinct
N-glycan profile of rat serum, Sci. Rep. 5 (2015) 12844, doi:10.1038/srep12844.
[27] S. Carillo, C. Jakes, J. Bones, In-depth analysis of monoclonal antibodies using
microfluidic capillary electrophoresis and native mass spectrometry, J. Pharm.
Biomed. Anal. 185 (2020) 113218, doi:10.1016/j.jpba.2020.113218.
[28] F. Füssl, A. Trappe, S. Carillo, C. Jakes, J. Bones, Comparative elucidation of cetuximab heterogeneity on the intact protein level by cation exchange chromatography and capillary electrophoresis coupled to mass spectrometry, Anal.
Chem. 92 (2020) 5431–5438 10.1021/acs.analchem.0c00185.
[29] S. Bannai, T. Ishii, Transport of cystine and cysteine and cell growth in cultured human diploid fibroblasts: effect of glutamate and homocysteate, J. Cell.
Physiol. 112 (1982) 265–272, doi:10.1002/jcp.1041120216.
[30] A. Calvet, A.G. Ryder, Monitoring cell culture media degradation using surface
enhanced Raman scattering (SERS) spectroscopy, Anal. Chim. Acta 840 (2014)
58–67, doi:10.1016/j.aca.2014.06.021.
[31] M.K. Mudiam, C. Ratnasekhar, R. Jain, P.N. Saxena, A. Chauhan, R.C. Murthy,
Rapid and simultaneous determination of twenty amino acids in complex biological and food samples by solid-phase microextraction and gas
chromatography-mass spectrometry with the aid of experimental design after ethyl chloroformate derivatization, J. Chromatogr. B Anal. Technol. Biomed.
Life Sci. 907 (2012) 56–64 10.1016/j.jchromb.2012.08.035.
[32] C. Yang, B. Ko, C.T. Hensley, L. Jiang, A.T. Wasti, J. Kim, J. Sudderth, M.A. Calvaruso, L. Lumata, M. Mitsche, J. Rutter, M.E. Merritt, R.J. DeBerardinis, Glutamine oxidation maintains the TCA cycle and cell survival during impaired
mitochondrial pyruvate transport, Mol. Cell 56 (2014) 414–424 10.1016/j.
molcel.2014.09.025.
[33] J. Gašperšicˇ , M. Kastelic, U. Novak, B. Likozar, Feature article: metabolic network modelling of chinese hamster ovary (CHO) culture bioreactors operated
as microbial, Cell Factories 65 (2018) 21 2018, doi:10.17344/acsi.2018.4591.
7