Algorithms for peptide and PTM identification using tandem mass spectrometry
Bạn đang xem bản rút gọn của tài liệu. Xem và tải ngay bản đầy đủ của tài liệu tại đây (1.23 MB, 142 trang )
Algorithms for Peptide and PTM Identification
using Tandem Mass Spectrometry
Kang Ning
A DISSERTATION SUBMITTED
FOR THE DEGREE OF
DOCTOR of PHILOSOPHY
DEPARTMENT OF COMPUTER SCIENCE
NATIONAL UNIVERSITY OF SINGAPORE, SINGAPORE
2008
I
To my wife Bai Hong, mother and father
You all deserve the pride!
II
1. Acknowledgements
I would like to first thank my family, especially my parents and my wife, for their endless
support every day, month and year during my pursuit of PhD.
I would like to take this opportunity to thank Prof. Leong Hon Wai for his patience,
constant guidance and countless insightful suggestions throughout my entire PhD
candidature. He is a great supervisor, who not only supervises me on research projects
and research methodologies (授之与渔), but also teaches me the principles of being a
right man. He is also a gentleman, allowing me to initiate many interesting research
projects on my own, and provided assistance when I needed it. These virtues will be
inherited in me, and help me in my whole life.
I would also like to thank Prof. Zhang Louxin for his great guidance on many projects,
and for inspiring me in research, as well as setting a role model for doing careful and
thoughtful research. His influence on me will be priceless to my future career and life.
I would also wish thank my friends, especially Dr. Chua Hon Nian; as well as alumni and
current members of the RAS group leaded by Prof. Leong Hon Wai. And I am also
grateful to many collaborators that co-operated with me during my PhD candidature.
III
2. Table of Contents
1.
ACKNOWLEDGEMENTS II
2.
TABLE OF CONTENTS III
3.
SUMMARY VI
4.
LIST OF FIGURES VIII
5.
LIST OF TABLES X
INTRODUCTION 1
1.1
P
EPTIDE IDENTIFICATION PROBLEM
2
1.1.1
Algorithms Based on Tags 2
1.1.2
Algorithms Based on Tags, SOM and MPRQ 3
1.2
M
ULTIPLE SEQUENCES ANALYSIS
5
SURVEY OF PEPTIDE IDENTIFICATION PROBLEMS AND ALGORITHMS 6
2.1
P
ROBLEM
S
TATEMENT
7
2.1.1
Peptide Identification Problem 7
2.1.2
Extended Spectrum Graph 8
2.2
P
EPTIDE IDENTIFICATION ALGORITHMS
12
2.2.1
Database Search Algorithms 13
2.2.2
De Novo Algorithms 14
2.2.3
Combined Algorithms 15
2.2.4
PTM identification algorithms 17
2.2.5
Our algorithms 17
2.3
C
ENTRAL NOTATION TABLE
17
PEPTIDE IDENTIFICATION ALGORITHMS BASED ON TAGS 23
3.1
B
RIEF
R
EVIEW AND MY WORK
23
IV
3.2
S
TRONG
T
AGS
26
3.3
E
VALUATING
M
ASS
S
PECTRA
28
3.3.1
Quality measures for evaluating mass spectra 28
3.3.2
Experimental data and analysis 28
3.4
GBST
A
LGORITHM FOR
M
ULTI
-C
HARGE
S
PECTRA
31
3.4.1
Evaluate “best” strong tags 31
3.4.2
The GBST algorithm 32
3.4.3
Upper bound on sensitivity 33
3.4.4
Experiments 33
3.5
GST-SPC
A
LGORITHM
36
3.5.1
An improved algorithm – GST-SPC 37
3.5.2
Performance Evaluation of Algorithm GST-SPC 41
3.6
PSP
D
ATABASE
S
EARCH
A
LGORITHM
44
3.6.1
Peptide sequence patterns algorithm 44
3.6.2
Approximate database search using PSP 46
3.6.3
Experiments 48
3.7
N
EW
C
OMPUTATIONAL
M
ODELS FOR
P
REPROCESS AND
A
NTI
-
SYMMETRIC
P
ROBLEM
52
3.7.1
Analysis of problems and current algorithms 54
3.7.2
New computational models and algorithm 60
3.7.3
Experiments 64
3.8
D
ISCUSSIONS
70
PEPTIDE IDENTIFICATION ALGORITHMS BASED ON TAGS, SOM AND MPRQ 73
4.1
SOM
AND
M
ULTIPLE
P
OINT
R
ANGE
Q
UERY
74
4.2
B
RIEF
R
EVIEW AND
M
Y
W
ORK
76
4.3
P
EP
SOM
A
LGORITHMS
78
4.3.1
The PepSOM algorithm 78
4.3.2
Experiments 80
4.4
A
LGORITHM
B
ASED ON
S
TRONG
T
AGS AND
SOM 87
V
4.4.1
Computational model and algorithm 88
4.4.2
Experiments 91
4.5
T
AG
SOM
A
LGORITHM
98
4.5.1
Computational model and algorithm 100
4.5.2
Experiments and current results 103
4.6
D
ISCUSSIONS
105
CONCLUSIONS 108
5.1
S
UMMARY
108
5.2
M
AIN
C
ONCLUSION
109
5.3
F
UTURE
R
ESEARCH
109
REFERENCES 111
APPENDIX A: MULTIPLE SEQUENCES ANALYSIS 121
A.1
L
ONGEST
C
OMMON
S
UBSEQUENCE
121
A.2
S
HORTEST
C
OMMON
S
UPERSEQUENCE
124
A.3
M
ULTIPLE
S
EQUENCES
S
ET
127
A.4
P
ATTERN
I
DENTIFICATION
B
ASED ON
LCS
AND
SCS 127
A.5
C
ONCLUSIONS
128
VI
3. Summary
This dissertation focuses on my work in the analysis of biological sequences, with special
concentration on algorithms for peptide and PTM identification using tandem mass
spectrometry.
The main concern for algorithms in peptide identification is achieving fast and accurate
peptide identification by mass spectrometry. The main results of this study is a set of
database search and De Novo algorithms for peptide identification based on “extended
spectrum graph” and machine learning techniques such as SOM.
I have designed a set of heuristic algorithms for identification of peptide sequences from
mass spectrometry, with focus on multi-charge spectrum. I have first introduced and
analyzed the extended spectrum graph computational model. Based on this model, I have
defined the “best strong tags” which are highly accurate. Then I have proposed the GBST
algorithm based on best strong tags. After this, I have extended the best strong tags to
“multi-charge strong tags”, and proposed the GMST and GST-SPC algorithms. The GST-
SPC algorithm is also based on computing the SPC of the candidate sequences and
experimental spectrum. A fast database search algorithm, PSP, is also proposed based on
multi-charge strong tags.
Then I have described peptide identification algorithms that are based on transformation
of spectra to high dimensional vectors. Using the SOM and MPRQ technique, these
algorithms then transformed the peptide sequence similarity to 2D point similarity on
SOM map, and performed multiple simultaneous queries for candidate peptides
VII
efficiently. The first algorithm, PepSOM, empirically proved the effectiveness of using
SOM and MPRQ for efficient peptide identification. The second algorithm further
improved PepSOM by scoring and ranking the candidate peptides by comparing them
with tags generated by GST-SPC algorithm. TagSOM algorithm is further improved by
using the information contained in these candidate peptides and tags for the purpose of
PTM identification.
These algorithms are fast and accurate, especially when compared to other algorithms on
multi-charge spectra. Some of these algorithms can also detect post translational
modifications (PTMs) in spectra with high accuracy.
I have also performed research on the analysis of multiple sequences. These researches
include the analysis of Longest Common Subsequence (LCS) and Shortest Common
Supersequence (SCS) of multiple sequences based on multiple alphabets.
VIII
4. List of Figures
Figure 1. The illustrated outline of my PhD dissertation. Solid arrows indicate “improvement” or
“extension” relationships; dashed arrows indicate “using results of” relationships; and lines
with no arrows indicate “highly related subjects” relationships. Solid ovals indicate
“completed” projects, while dashed ones indicate projects “in progress”. 5
Figure 2. Example of extended spectrum graph for mass spectrum generated from peptide
“GAPWN” 12
Figure 3. Theoretical spectrum for the peptide sequence “SIRVTQKSYKVSTSGPR”, with parent
mass of 1936.05 Da. “y” and “b” indicates y- and b-ions, “+1”, “+2” indicates charge 1 and 2,
and “*” indicates ammonia loss. Bold numbers are mass-to-charge ratios of peaks present in
experimental spectrum 26
Figure 4. Example of strong tags in the spectrum graph for spectrum in Figure 3. There are 2 strong
tags. Vertices (small ovals) represent mass-to-charge ratios, and edges (arrows) represent
amino acids whose mass are the same (within tolerance) as the mass difference of the vertices.27
Figure 5. Specificity(α,β) of multi-charge spectra. Specificity increases as β increases. Most algorithms
consider up to
α
2
S
(dashed black line). But considering
α
α
S
for spectra with α
≥
3 improves the
specificity (black line vs grey line) 29
Figure 6. Completeness(α,β) of multi-charge spectra. We see that considering only
α
2
S
gives < 70% of
the full ladder, which drops drastically as α gets bigger. On the other hand, considering
α
α
S
gives > 80% of full ladder. 30
Figure 7: The comparison of sensitivity results of GBST with theoretical upper bounds. U(R) and
U(BST) on (a) GPM dataset, and (b) ISB datasets. 36
Figure 8. Comparing the theoretical upper bounds on sensitivity for MST and BST. Results are
based on (a) GPM dataset, and (b) ISB datasets 38
Figure 9. Comparison of different algorithms on GPM dataset – based on (a) sensitivity, (b) tag-
sensitivity, (c) specificity and (d) tag-specificity. PepNovo only has results for charge 1 and 2. 42
IX
Figure 10. Comparison of different algorithms on ISB dataset - based on (a) sensitivity, (b) tag-
sensitivity, (c) specificity and (d) tag-specificity. PepNovo only has results for charge 1 and 2. 43
Figure 11: The scheme of the database search algorithm. 46
Figure 12: The description of the PSP algorithm 46
Figure 13: Description of the approximate pattern matching problem; and the procedure for the
database search algorithm. 47
Figure 14: An example of the match of the peptide sequence pattern (first row) and the peptide
sequence in the database (second row). 48
Figure 15. Flowchart of the whole algorithm. The preprocess model is illustrated at left, and the
restricted anti-symmetric model is applied on the GST-SPC algorithm as shown at right. “bad”
tags are tags that violate the restricted anti-symmetric model 64
Figure 16. (left) In this example of a SOM, each spectrum is represented by a black dot. Neighboring
dots have mutually similar shades of gray. Note that one node may represent overlapping
spectra. (right) Our algorithm uses SOM and MPRQ for coarse filtering. 79
Figure 17. Diagram for the peptide identification with PepSOM. (a) SPC is used to score and rank
candidate peptides. (b) Candidate peptides are scored and ranked by comparing with tags and
experimental spectrum 80
Figure 18: Average Query Size (search distance radius d vs % of database size) for the ISB dataset.87
Figure 19. The outline of my research in multiple sequences analysis. 121
X
5. List of Tables
Table 1. Central notation table, which include most of the important notations used in this thesis. 18
Table 2 : The number of spectra, and the number of peaks per spectrum. The results are based on
the GPM and ISB datasets of different charges 34
Table 3: Results of GBST, compared with Lutefisk and PepNovo on GPM spectra. Results show that
GBST is generally comparable and sometimes better, especially for multi-charge spectra. The
accuracy values are represented in a (specificity/sensitivity) format. (*based on spectra with +1
and +2) 35
Table 4: The sequencing results of Lutefisk, PepNovo and GST-SPC algorithm on some spectra. The
accurate subsequences are labeled in bold and italics. “-” means there is no result. 44
Table 5: Comparisons of Mascot and PSP on selected spectra. The accurate subsequences are labeled
in italics. A “-” means that there is no result. 50
Table 6: The accuracy results of PSP and InsPecT on GPM datasets. The accuracies in cells are
represented in a (specificity/sensitivity/[tag-specificity /tag-sensitivity]) format. 51
Table 7: Comparisons of InsPecT and PSP on selected spectra. The accurate subsequences are
labeled in italics. A “-” means that there is no result. 51
Table 8. The average contents of different types of peaks in GPM and ISB spectra. The symmetric
peaks are just counted once for total content measures 56
Table 9: The average numbers and ratios of overlapping instances for different kinds of overlaps 59
Table 10. The performance of preprocess. The accuracies in cells are represented in a
(specificity/sensitivity) format. “-” means that the value is not available by the algorithm, and
“*” shows the average values based on charge 1 and charge 2 spectra. 65
Table 11. The results based on the restricted anti-symmetric model, compared with other models.
The accuracies in cells are represented in a (specificity/sensitivity[tag-specificity/tag-sensitivity])
format. 67
XI
Table 12. Sequencing results of Lutefisk, PepNovo, GST-SPC and our novel algorithm. The accurate
subsequences are labeled in italics. “M/Z” means mass to charge ratio, “Z”means charge, and
“-” means there is no result. 68
Table 13. The performance of preprocess and anti-symmetric model on PepNovo. The accuracies in
cells are represented in a (specificity/sensitivity) format. 69
Table 14. Parameters for the generation of databases and theoretical spectra 83
Table 15. Statistical results on the quality of candidate identification by SOM and MPRQ. For “No.
of Complete Correct” and “Complete Correct Accuracy”, first-rank peptide was used for
analysis. For specificity and sensitivity, the results for “first-rank peptide / best-match peptide”
are shown. 83
Table 16. Comparison of different algorithms on the accuracy of peptide identification. In each
column, the “specificity / sensitivity” values are listed 84
Table 17. PepSOM-generated candidates’ size, average query size and coarse filtering rate for each
dataset 85
Table 18. Statistical results on the quality of the generated tags. 94
Table 19. Comparison of different algorithms on the accuracies of peptide identification. In each
column, the “precision / recall” values are listed 95
Table 20. Accuracies (%) of PTM identification from simulated spectra by tags of different lengths.
The columns with Top i = 1, 2, 3, 4 represent the (peptide / PTM) identification accuracies in
Top i. “No limit” means that the best-score tags are used without any length limit. “Filtration
ratio” is computed as the number of candidates after tag filtration over the number of
candidates after MPRQ. “Time” is the total time to identify the peptides and PTMs for 995
spectra. Results without using tags are also illustrated 96
Table 21. Specification of selected ISB datasets and the PTMs for analysis of PTM-free features 101
Table 22. Specification of the real datasets used for PTM identification 104
1
Chapter 1
Introduction
People have been wondering about the complex nature of living beings on this planet
from ancient times. The advance in biology science has little by little fed our curiosity.
This process is accelerated after the invention of computers. In the past few years, more
and more computational methods have been used on large scale analysis of biological
units (based on molecules) of every living being. This latest development of
computational analysis of biological systems has given birth to the new era of
bioinformatics.
Bioinformatics is a science that refers to the creation and advancement of algorithms,
computational, statistical techniques, and theory to solve formal and practical problems
inspired from the management and analysis of biological data. In bioinformatics,
bioinformaticians are provided with a huge amount of raw data that are generated by
various experiments on different biological samples. Bioinformaticians have to (a)
identify and analyze these samples, and from them, (b) discover complex relationships
between them. In this process, we aim to ultimately understand Life itself.
Biological sequences are critical in bioinformatics. Since biological sequences are the
basis for other biological units, the analysis of biological sequences is fundamental to
virtually every aspect of bioinformatics. Gusfield [1] wrote:
“The area of approximate matching and sequence comparison is central in
computational molecular biology both because of the presence of errors in
2
molecular data and because of active mutational processes that sequence
comparison methods seek to model and reveal.”
This dissertation concentrates on analysis of biological sequences, with special focus on
algorithms for peptide sequence identification by mass spectrometry. Traditionally, there
are two classes of algorithms for peptide identification by mass spectrometry problem
aim to identify peptide sequences from high-throughput mass spectra data – database
search algorithms and de novo sequencing algorithms. They are useful to biologists to
verify known peptides or to discover new peptides [2-9]. The algorithms that I have
designed in this dissertation are both accurate and efficient, with superior performance on
multi-charge spectra. In addition, I have also carried out research in heuristic algorithms
for multiple sequence analysis and algorithms for some other problems related to
sequences analysis [10-14].
1.1 Peptide identification problem
Peptide identification from mass spectrometry is important, since it provides data for
further research such as protein sequence analysis. However, while high-throughput
spectrometers have generated a huge number of spectra, peptide identification algorithms
are slow and inaccurate. I have analyzed and designed efficient and accurate algorithms
for peptide identification problems.
1.1.1 Algorithms Based on Tags
I have designed De Novo peptide identification algorithms that are based on multi-
charge strong tags. The simple algorithm GBST, which only utilized the “best strong
tags” on extended spectrum graph, showed that considering multi-charges in multi-
3
charge spectrum can help to improve identification accuracies [2, 9]. The improved GST-
SPC algorithm not only use multi-charge strong tags (GMST algorithm), but also
optimize SPC, so that it has improved accuracies [7]. Further improvement includes a
better preprocess computational model and a better computational model for anti-
symmetric problem [8]. These new models can also be applied on other De Novo
algorithms to improve their accuracies.
Based on “best strong tags”, I have also designed an efficient database search algorithm
(PSP) for peptide identification [6]. The algorithm is based on linear time pattern
matching strategy which allows mismatches, so it is both accurate and fast.
These projects have utilized the information in multi-charge spectra that have not been
investigated before. The algorithms that I have proposed for these problems have
improved the peptide identification accuracies.
1.1.2 Algorithms Based on Tags, SOM and MPRQ
Apart from peptide identification algorithm only based on tags, I have also designed
peptide identification algorithms based on transforming both experimental and
theoretical spectra to high-dimensional vectors. These vectors are then transformed to
2D points on plane, followed by SOM and MPRQ query to quickly get the candidate
peptides. These candidate peptides are then validated by comparing with tags and
experimental spectrum for accurate peptide identification. In this way, no spectrum
comparison is needed, while the spectrum similarity is preserved through vector
similarity and neighborhood relationships between points on the 2D plane.
4
The first attempt (PepSOM) by us involves binning the spectra according to mass/charge
values to get vectors, and using SOM and MPRQ techniques to get candidate peptide
sequences. This is followed by SPC for validation, and the results are already quite
accurate [4]. Subsequently we proposed an improved algorithm that used SPC together
with multi-charge strong tags for candidates’ validation, and also incorporated a module
in this algorithm to identify Post Translational Modifications (PTMs). Results are
satisfactory on real spectra with real PTMs [3]. Furthermore, we have recently designed a
novel algorithm (TagSOM) that used biologically meaningful features to transform
spectra to vectors, as well as an improved scoring function in the validation stage to
identify PTMs. The peptide and PTM identification accuracies are expected to be further
improved [5].
These projects have empirically proved the effectiveness of peptide identification by
transforming spectra to vectors in high-dimensional space using spectrum features. The
advantage of these set of algorithms is accurate identification of peptides and PTMs, and
show the power of combination of tags, SOM and MPRQ techniques for peptide and
PTM identifications.
The overall outline of my PhD dissertation is illustrated in Figure 1.
5
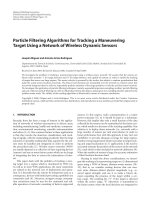
Figure 1. The illustrated outline of my PhD dissertation. Solid arrows indicate
“improvement” or “extension” relationships; dashed arrows indicate “using results of”
relationships; and lines with no arrows indicate “highly related subjects” relationships.
Solid ovals indicate “completed” projects, while dashed ones indicate projects “in
progress”.
1.2 Multiple sequences analysis
In addition to peptide identification, I have also performed research on multiple
sequences analysis. Given a great amount of biological sequences, I have analyzed the
common properties of these sequences, and designed a set of heuristic algorithms to
compare them and discover their common parts, namely, their Longest Common
Subsequence (LCS), Shortest common Supersequence (SCS) and patterns [10-14]. The
heuristic algorithms that I have designed are superior to other algorithms in both the
quality of the results and computational time, especially for many long sequences. Since
these are not the focus of this dissertation, I will not go into details of these research, but
a summary of these results can be found in Appendix A.
SOM and MPRQ
Peptide Identification
Spectra
analysis
GBST
algorithm
GST-SPC
algorithm
PSP
algorithm
Preprocess
and Anti-
symmetric
PepSOM
algorithm
Tag and
SOM
TagSOM
algorithm
6
Chapter 2
Survey of Peptide Identification Problems and Algorithms
Proteomics is the large-scale study of proteins, particularly their sequences, structures
and functions. In proteomics, the identification of peptide sequences is very important.
This is because: (i) we do not know the full set of proteins that cells produce; (ii) it is
important to identify which specific proteins interact in a biological system; and (iii) it is
important to identify proteins that are present in biological tissues under different
conditions. Currently, peptide identification is mainly done on spectra data generated by
mass spectrometry (MS) or tandem mass spectrometry (MS/MS).
The advance in tandem mass spectrometry (MS/MS) technology has made high-
throughput mass spectra generation possible. A protein can be digested into peptides by
proteases such as trypsin. In a very short time, a tandem mass spectrometer breaks a
peptide into smaller fragments, and measures the mass/charge ratio of each. The mass
spectrum of a peptide is a collection of mass/charge ratios of these fragments.
In an ideal fragmentation process, where every fragment of a peptide is generated in an
ideal mass spectrometer, the peptide identification problem is simple. However, peptide
identification is a non-trivial problem because these ideal conditions are never met in
experiments. The spectrum obtained from MS/MS usually contains a lot of noise,
introduced by impurities in the peptide sample, and biases inherent in mass spectrometers.
The existence of PTMs further complicates the problem [15]. Post Translational
Modifications (PTMs) are chemical modifications to a protein after its translation. This
7
makes the problem becomes more difficult since a known peptide sequence may not
exactly match the actual peptide fragments used to generate the spectrum.
There are two types of computational problems in peptide identification. The first type of
problem, which we refer to the problem as peptide identification, are algorithms that
identify peptide sequences in database. The second type of problem, which we refer to as
De Novo peptide sequencing, is the interpretation of peptide sequences in cases when
peptide sequences are either not present in database, or different from canonical form
present in a database (such as with post-translational modifications).
2.1 Problem Statement
2.1.1 Peptide Identification Problem
To introduce the peptide identification problem, we first define some general terms. In
tandem mass spectrometry (MS/MS), a peptide sequence
ρ
= (a
1
a
2
…a
l
) is fragmented
into a spectrum S. The parent mass of the peptide
ρ
is given by
)()(
1
∑
=
==
l
j j
ammM
ρ
. A
peptide prefix fragment is
ρ
k
= (a
1
a
2
…a
k
), for k ≤ l, and has mass
).()(
1
∑
=
=
k
j jk
amm
ρ
Suffix masses are defined similarly. We always express a fragment mass in experimental
spectrum using its PRM (prefix residue mass) representation, which is the mass of the
prefix fragment. In mathematical notation, given a fragment
ρ
k
with mass m(
ρ
k
), we
define PRM(
ρ
k
) = m(
ρ
k
) if
ρ
k
is a prefix fragment. Similarly, we define PRM(
ρ
k
) = M –
m(
ρ
k
) if
ρ
k
is a suffix fragment ({y-ion}). By calculating the PRMs for all fragments, we
can treat all fragment masses uniformly.
8
A spectrum S is composed of many peaks. Each of the peaks p
i
is represented by its
intensity(p
i
) and mass-to-charge ratio mz(p
i
). If peak p
i
is not noise, then it represents a
fragment ion of
ρ
. Each peak p
i
can be characterized by the ion-type, specified by (z, t, h)
∈ (∆
z
×∆
t
×∆
h
) = ∆, where z is the charge of the ion, t is the basic ion-type, and h is the
neutral loss incurred by the ion. The (z, t, h)-ion of the peptide fragment
ρ
k
(prefix or
suffix fragment) will produce an observed peak p
i
in the experimental spectrum S that has
a mass-to-charge ratio of mz(p
i
) and intensity int(p
i
). The mass of
ρ
k
, m(
ρ
k
) can be
computed using a shifting function, Shift, defined as follows:
)1())()(()()),,(,()(
−
−
+
+
⋅
=
=
zhtzpmzhtzpShiftm
iik
δ
δ
ρ
(1)
where
δ
(t) and
δ
(h) are the mass differences associated with the ion-type t and the neutral
loss h, respectively. We say that peak p
i
is a support peak for the fragment
ρ
k
and we say
that the fragment
ρ
k
is supported by the peak p
i
. A peak p
j
is a support peak for the peak
p
i
if both of them are support peaks for the same fragment
ρ
k
.
In the problem of peptide identification by tandem mass spectrometry, the input includes
the mass spectrum S, the set of possible ion types ∆ and the parent mass M (and for
database search algorithms, a database of peptides). The output is the putative peptide
sequence P that matches with S better than any other peptides.
2.1.2 Extended Spectrum Graph
The match between a peptide and an experimental spectrum is always represented by the
number of common peaks between the theoretical spectrum of P and the experimental
spectrum S. This is often referred to as the shared peaks count (SPC). In reality, peptide
identification algorithms use more complicated scoring function than SPC.
9
Theoretical Spectrum for a Known Peptide: We define the theoretical spectrum
)(
ρ
α
α
TS
for
ρ
with maximum charge
α
to be the set of all possible observed peaks that
may be present in an experimental spectrum for the peptide
ρ
with maximum charge
α
.
More precisely,
)(
ρ
α
α
TS
= {p | p is an observed peak for the (z, t, h)-ion of peptide prefix
fragment
ρ
k
, for all (z, t, h)∈∆ and k=1,…,n}.
Extended Spectrum: Conversely, the real peaks (in contrast to noise) in an experimental
spectrum S = {p
1
,p
2
,…p
n
} of maximum charge
α
, may have come from different ion-type
of different fragments (may be prefix or suffix fragment, depending on the ion-type). We
do not know, a priori, the ion-type (z, t, h)∈∆ of each peak p
i
, we can not even
distinguish real peaks from noise. Therefore, We “extend” each peak p
i
by generating a
set of |∆| pseudo-peaks (or guesses), one for each of the different ion-types (z, t, h)∈∆.
More precisely, in the extended spectrum
α
α
S
, for each peak p
i
∈S and an ion-type (z, t,
h)∈∆, we generate a pseudo-peak, denoted by (p
i
, (z, t, h)), with an “assumed”
(uncharged) fragment mass computed using the Shift function (1). Only one of these
pseudo-peaks can be a real peak, while the others are “introduced” noise.
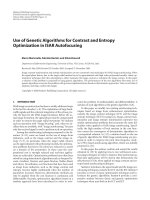
An example of an extended spectrum is illustrated in Figure 2. For simplicity, we only
consider ion-types ∆
t
= {b-ions, y-ions} and ∆
h
={Ø}. The figure depicts the extended
spectrum for a peptide
ρ
= GAPWN with parent mass M = m(
ρ
) = 525.2, and an
experimental spectrum S = {113.6, 412.2, 487.2} with maximum charge 2. The first peak
“113.6” is a (2, b-ion, Ø)-ion of the prefix fragment GAP; the peak 412.2 is a (1, b-ion,
Ø))-ion of the prefix fragment GAPW; and “487.2” is a (1, y-ion, Ø)-ion for the fragment
10
G. In Figure 2 (a), only charge 1 is considered and
2
1
S
= {112, 430, 411, 132, 486, 57}.
The entries in the table are the PRM values. For example, the possible fragment masses
of 112 and 430 correspond to the extension of the first peak for ion-types (1, b-ion, Ø)
and (1, y-ion, Ø), respectively. However, if charge 2 is also considered, then
2
2
S
= {112,
430, 225, 31, 411, 132, 486, 57} as shown in Figure 2 (b).
Modeling Current De Novo Algorithms: To take into account the fact that some
algorithms consider only ion-types of charge up to β (usually β = 2), we extend the
definition to
)(
ρ
α
β
TS
which is defined to be the subset of
)(
ρ
α
α
TS
for which the charge
z∈{1,2,…, β}. The case
β
=1 reflects the assumption that all peaks are of charge 1, and
makes use of the extended spectrum
α
1
S
. Algorithms such as PepNovo [16] and Lutefisk
[17] work with a subset of the extended spectrum
α
2
S
, even for spectra with charge
α
> 2.
In general,
)(
ρ
α
β
TS
does not account for peaks that correspond to ion-types with higher
charges z=
β
+1, … ,
α
(
α
>
β
). Since
)() ()(
21
ρρρ
α
α
αα
TSTSTS ⊆⊆
, higher accuracy can be
attained when higher charge values are taken into account.
The spectrum graph approach is one efficient way for solving the peptide identification
problem. In this approach, Each spectrum will be represented by a spectrum graph, in
which each vertex represent a peak in the spectrum, and each edge will represent an
amino acid whose mass is equal to the mass difference of the corresponding vertices
(within tolerance). A path in this spectrum graph from mass 0 to parant mass will then
represent a putative peptide sequence.
11
The Extended Spectrum Graph: We also introduce the extended spectrum graph,
denoted by
)(
α
β
SG
d
, where d is the “connectivity”. Each vertex v in this graph represents a
pseudo-peak (p
i
, (z, t, h)) in the extended spectrum
α
β
S
, namely, the (z, t, h)-ions for the
peak p
i
. Thus v = (p
i
, (z, t, h)). Therefore, each vertex represents a possible peptide
fragment mass given by PRM(Shift(p
j
, (z, t, h))). Two special vertices are added - the start
vertex v
0
corresponding to mass 0 and the end vertex v
M
corresponding to the parent mass
M.
In the “standard” spectrum graph, we have a directed edge (u, v) from vertex u to vertex v
if PRM(v) is larger than PRM(u) by the mass of a single amino acid. In the extended
spectrum graph of connectivity d,
)(
α
β
SG
d
, we extend the edge definition to mean “a
directed path of no more than d amino acids”. Thus, we connect vertex u and vertex v by
a directed edge (u, v) if PRM(v) is larger than PRM(u) by the total mass of d’ amino acids,
where d’ ≤ d. In this case, we say that the edge (u, v) is connected by a path of length up
to d amino acids. Note that the number of possible paths to be searched is 20
d
and
increased exponentially with d. In this dissertation, I use d=2, unless otherwise stated.
Two extended spectrum graphs (with d=2) are shown in Figure 2. The spectrum graph
G
2
(
2
1
S
) is shown in Figure 2 (c). We can see that only the edges (v
0
, v
6
) for amino acid G
and (v
3
, v
M
) for amino acid N can be obtained. The subsequence APW is more than 2
amino acids long and so G
2
(
2
1
S
) is unable to elucidate this information. By considering
2
2
S
(in (a) and (b)), we obtain the graph G
2
(
2
2
S
) shown in (d). New edges can be obtained:
edge (v
6
, v
7
) for path AP of length 2 amino acids and (v
7
, v
3
) for amino acid W. This gives
12
a full path from v
0
to v
M
and the full peptide can now be elucidated. However we also
note that more noise may be introduced in G
2
(
2
2
S
), which can result in the formation of
fictitious edges . One example is shown in (d) using dashed line to denote the fictitious
edge (v
4
, v
8
). Many such fictitious edges can result in fictitious paths from v
0
to v
M
, thus
yielding a higher rate of false positives.
Figure 2. Example of extended spectrum graph for mass spectrum generated from peptide
“GAPWN”.
2.2 Peptide identification algorithms
Approaches for peptide identification can be categorized into database search algorithms
[18-21], De Novo algorithms [16, 17, 22-27] and combined algorithms [21, 28-30].
Database search algorithms usually return the peptide sequences that match the parent
mass of the experimental spectrum via some scoring functions. Apparently, the accuracy
of these approaches depends largely on the completeness of the database, and the process
is slow (usually at least a few minutes). An analysis of an LC/LC/MS/MS experimental
dataset using the popular BioWorks program by ThermoFinnigan on a computer with a
single processor typically takes several hours (approximately 30,000 scans against the
Escherichia coli database).
(b) Extending the peaks for charge 2 ions.
z
mz(p
1
)= 113.6
mz(p
2
)= 412.2
mz(p
3
)=487.2
B Y B Y B Y
2
V
7
225.2
V
8
318
-
-
-
-
-
-
-
-
(d) The extended spectrum graph G
2
(
2
2
S
)
V
0
V
6
V
1
V
4
(a) The spectrum
2
1
S
(only B and Y ions considered)
z
mz(p
1
)= 113.6
mz(p
2
)= 412.2
mz(p
3
)=487.2
B Y B Y B Y
1
V
1
112.6
V
2
430.6
V
3
411.2
V
4
132
V
5
486.2
V
6
57
G N
V
7
V
8
V
3
V
2
V
5
G
GM
N AP W
V
M
(c) The spectrum graph G
2
(
2
1
S
)
V
0
V
6
V
1
V
4
V
3
V
2
V
5
V
M
13
Moreover, the accuracy of these methods are generally mediocre for peptide sequences
not available in database (i.e. peptides not already known), as well as for peptides with
PTMs. For such peptide sequences, De Novo algorithms are the methods of choice. These
algorithms interpret peptide sequences from spectrum data purely by analyzing the
intensity and correlation of the peaks in the spectrum. They can identify tags (highly
reliable fragments) with high accuracy [31], and the process is fast (always within one
minute), but their performance deteriorates quickly with the presence of noise and PTMs.
2.2.1 Database Search Algorithms
Database searching algorithms [18-20] for peptide identification by mass spectrometry
rely primarily on good scoring. The peptide that scores the highest or has a lowest p-
value is the one that best explains the spectrum. The success of these algorithms relies on
the completeness of peptide databases, and the selection of an appropriate scoring
mechanism.
Database search in mass-spectrometry has been investigated by many researchers [18-20].
Database search algorithms exhibit good performance in the identification of peptides
already in the peptide database. However, these algorithms rely heavily on the presence
of the target peptide (or similar ones) in the protein database. Generally, these algorithms
search a sequence database for peptide sequences which would produce ions of the mass
observed for a particular spectrum, then score these candidate sequences against the
observed spectrum.
Traditional database search algorithms are established on a common principle: the
experimental spectrum is compared with the theoretical spectrum for each of the peptide