Compound-specific carbon isotope analysis of volatile organic compounds in complex soil extracts using purge and trap concentration coupled to heart-cutting two-dimensional gas
Bạn đang xem bản rút gọn của tài liệu. Xem và tải ngay bản đầy đủ của tài liệu tại đây (1.2 MB, 12 trang )
Journal of Chromatography A 1655 (2021) 462480
Contents lists available at ScienceDirect
Journal of Chromatography A
journal homepage: www.elsevier.com/locate/chroma
Compound-specific carbon isotope analysis of volatile organic
compounds in complex soil extracts using purge and trap
concentration coupled to heart-cutting two-dimensional gas
chromatography–isotope ratio mass spectrometry
Jeremy Zimmermann a,∗, Philipp Wanner b, Daniel Hunkeler a
a
b
Centre for Hydrogeology and Geothermics, University of Neuchâtel, Rue Emile-Argand 11, Neuchâtel 2000, Switzerland
Department of Earth Sciences, University of Gothenburg, Guldhedsgatan 5a, Göteborg 41320, Sweden
a r t i c l e
i n f o
Article history:
Received 21 April 2021
Revised 22 July 2021
Accepted 14 August 2021
Available online 18 August 2021
Keywords:
Heart-cutting two-dimensional gas
chromatography
Compound-specific carbon isotope analysis
Solvent extraction
Purge and trap
Volatile organic compounds
Isotope ratio mass spectrometry
a b s t r a c t
Compound-specific carbon isotope analysis (CSIA) is a powerful tool to track the origin and fate of organic subsurface contaminants including petroleum and chlorinated hydrocarbons and is typically applied to water samples. However, soil can form a significant contaminant reservoir. In soil samples, it can
be challenging to recover sufficient amounts of volatile organic compounds (VOC) to perform CSIA. Soil
samples often contain complex contaminant mixtures and gas chromatography combustion isotope ratio mass spectrometry (GC-C-IRMS) is highly dependent on good chromatographic separation due to the
conversion to a single analyte. To extend the applicability of CSIA to complex volatile organic compound
mixtures in soil samples, and to recover sufficient amounts of target compounds for carbon CSIA, we
compared two soil extraction solvents, tetraglyme (TGDE) and methanol, and developed a heart-cutting
two-dimensional GC-GC-C-IRMS method. We used purge & trap concentration of solvent-water mixtures
to increase the amount of analyte delivered to the column and thus lower method detection limits. We
optimized purge & trap and chromatographic parameters for twelve target compounds, including one
suffering from poor purge efficiency. By using a 30 m thick-film non-polar column in the first and a
15 m polar column in the second dimension, we achieved good chromatographic separation for the target compounds in difficult matrices and high accuracy (trueness and precision) for carbon isotopic analysis. Tetraglyme extraction was shown to offer advantages over methanol for purge & trap concentration,
leading to lower target compound method detection limits for CSIA of soil samples. The applicability of
the developed method was demonstrated for a case study on soil extracts from a former manufacturing
facility. Our approach extends the applicability of CSIA to an important matrix that often controls the
long-term fate of contaminants in the subsurface.
© 2021 The Authors. Published by Elsevier B.V.
This is an open access article under the CC BY-NC-ND license
( />
1. Introduction
Compound-specific isotope analysis (CSIA) is a powerful method
to track the origin and fate of contaminants in the subsurface and
is often applied to volatile organic compounds (VOC) in groundwater samples [1–4]. The principle is based on monitoring the isotopic ratio of one or more elements (e.g. carbon, chlorine, hydrogen) of the parent compounds and/or degradation products. For
carbon, the ratio of 13 C to 12 C of a sample Rsample is expressed
∗
Corresponding author.
E-mail address: (J. Zimmermann).
using the delta (δ ) notation as permille (‰) difference from the
isotope ratio in the reference standard Vienna Pee Dee Belemnite
(VPDB):
δ 13C =
Rsample − RVPDB
Rsample
=
−1
RVPDB
RVPDB
(1)
Chemical bonds involving the heavier isotope are slightly
stronger than those involving the light isotope, leading to a heavy
isotope enrichment in the residual compound and a depletion
in the degradation products. CSIA is applied to identify different
degradation mechanisms, to quantify the degree of degradation,
and to differentiate contaminant sources [4–7].
/>0021-9673/© 2021 The Authors. Published by Elsevier B.V. This is an open access article under the CC BY-NC-ND license ( />
J. Zimmermann, P. Wanner and D. Hunkeler
Journal of Chromatography A 1655 (2021) 462480
Compound-specific carbon isotope analysis of VOC is typically
performed by separating the target compounds with a gas chromatograph (GC), followed by combustion (C) to a single analyte,
CO2 , and isotopic analysis in an isotope ratio mass spectrometer
(IRMS). In GC-C-IRMS systems, no mass fragments of the original compounds can be monitored, hence baseline chromatographic
separation is required [8,9]. In order to achieve a precision of
<0.5‰ for δ 13 C measurements, Zhang et al. [8] recommend that
peak areas of any interferences remain below 5% of the target analyte peak area. Further complications arise due to chromatographic
isotope effects, as isotopologues of target compounds travel at different velocities through the GC column. Isotopologues containing
13 C have been shown to migrate more rapidly compared to the isotopically light isotopologues, which causes the beginning of a peak
to become isotopically enriched and its end to become depleted
[10]. Hence, the isotopic ratio is not constant across the whole
peak, which explains the need for integrating the complete peak
area. For these reasons, Zhang et al. [8] and Leeuwen et al. [9] also
advise against attempting to resolve co-eluting peaks by using algorithms.
At field sites with complex VOC mixtures that include monocyclic aromatic hydrocarbons (BTEX) and chlorinated aliphatic hydrocarbons, the baseline chromatographic separation can prove
challenging. The analysis of VOC in soil samples adds an additional
difficulty. Groundwater samples will only contain a limited range
of VOC in solution, due to their generally low solubility in water,
and a lower solubility of BTEX compared to chlorinated aliphatic
compounds [11]. Soil samples on the other hand can contain a variety of contaminants, as in this case water cannot assume the role
of a selectively extracting medium.
For quantification of VOC concentrations in solid samples, advances have been made that allow quantitative static or dynamic
headspace extraction of VOC from solid samples [12], resolving the
severe matrix dependencies of these techniques that have been observed in the past, such as low recoveries and low reproducibility
[13–16].
However, none of these solvent-free extraction methods are
suited for compound-specific carbon isotope analysis of complex
mixtures, as method detection limits are generally higher than
those required for simple quantification, and, most importantly, the
linearity ranges for measuring isotope ratios with an IRMS hyphenated with a conversion step are much smaller than those for the
detectors typically used in quantification. While flame ionization
detectors (FID) allow quantifying concentrations spanning five orders of magnitude [17], isotope ratio measurements using an IRMS
are typically performed over a limited concentration range of only
one order of magnitude [18].The pronounced amount dependence
of isotopic measurements may be due to pressure fluctuations in
the mass spectrometer itself or isotope fractionation at the open
split of the combustion furnace [19]. Hence, samples need to be diluted to different levels and analyzed multiple times to ensure that
the concentration of each target compound lies within the narrow
linearity range inherent to GC-C-IRMS.
Therefore, a prior extraction step is necessary to make
compound-specific carbon isotope analysis possible. Different extractants, e.g. organic solvents, are available for this task. A suitable
solvent should be able to extract a wide range of contaminants, as
well as be miscible in water to facilitate sample preparation and
to accelerate the desorption rate of target compounds from soil,
with methanol being the solvent of choice [16,20]. Methanol extraction has not only been applied for quantification of VOC in soil
[21], but has also been shown to be suitable for carbon CSIA for
tracking degradation processes of VOC in low-permeability zones
[22–24].
The analysis of target compounds extracted from soil using
solvents becomes challenging at low concentration levels of tar-
get compounds. This is especially relevant for CSIA, as the most
pronounced isotope effects will first emerge after a large proportion of the initial contaminant has been degraded. Offline preconcentration of soil extracts by evaporation of the extraction solvent is limited to high-boiling target compounds such as polycyclic
aromatic hydrocarbons (PAH) and cannot be applied to VOCs. Furthermore, large solvent peaks may interfere with target VOCs during chromatographic separation.
For sample introduction into the GC using a standard splitless
injector with a liner volume limited to 1 mL, the maximum permissible liquid injection volume is generally in the low μL-range,
in order to avoid overloading the glass inlet liner when the sample is evaporated [17]. Wilcke et al. [25], Kim et al. [26], Graham et al. [27] and Bosch et al. [28] have applied carbon CSIA to
PAH in soil extracts. Due to the small injection volumes, extensive
pre-concentration and purification were required in all cases. Using programmable temperature vaporizing (PTV), the injection volume can be increased to 100 μL or even 10 0 0 μL (large-volume
injection), at the risk of losing low-boiling compounds during the
necessary solvent evaporation step [17]. Blessing [29] and Blessing et al. [30] applied a large-volume injection of up to 150 μL for
carbon CSIA of PAH in soil, requiring solid-liquid and liquid-liquid
extraction and purification steps prior to analysis.
In order to avoid these laborious offline steps and associated
possible losses when applied to VOC, and to allow the injection
of much larger amounts of extraction solvents, we propose diluting the soil extracts in water and concentrating target compounds
using a purge & trap concentrator. In addition, cryogenic focusing allows us to use a splitless injection. This ensures quantitative transfer of compounds, which is of particular importance for
IRMS due to the lower sensitivity. At a methanol proportion of 1%
(v/v) in water and a purge volume of 25 mL, 250 μL of soil extract can be analyzed. This is an improvement by a factor of 125
to 250 over classical solvent injection. The dilution is necessary as
high proportions of methanol may interfere with target compounds
due to competitive sorption on the trap and/or the GC separation.
The maximum permissible methanol content for carbon CSIA using purge & trap has so far been limited to 1% (v/v) [22]. As a
high boiling-point alternative to methanol, the use of tetraethylene glycol dimethyl ether (TGDE, tetraglyme) has been proposed
[14,16,31,32].
As mentioned, the efficient extraction of target as well as nontarget compounds may lead to problems in achieving a high chromatographic resolution. Heart-cutting two-dimensional (2D) gas
chromatography (GC-GC), not to be confused with comprehensive
2D gas chromatography (GCxGC), is a suitable method to separate a
limited number of target compounds from interfering compounds
[33]. This method uses two GC columns of different selectivity connected in series through a valve system called the Deans’ switch
[34], which allows target compound peaks eluting from the first
column to be diverted to the second column for additional separation. Compound-specific carbon isotope analysis using GC-GC-CIRMS has been applied, amongst others, to drug residues in human
excreta [35], flavor compounds in truffle oils [36], polychlorinated
biphenyls [37], and aliphatic [38] as well as aromatic hydrocarbons
[39] in groundwater and gas-phase environmental samples. To the
best of our knowledge, GC-GC methods have not yet been applied
to isotope analysis of VOCs in soil extracts.
The objective of our study was to develop a method that allows obtaining compound-specific carbon isotope ratios for complex mixtures of monocyclic aromatic hydrocarbons and chlorinated aliphatic hydrocarbons in soil samples. We determined the
solvent best suitable for purge & trap analysis and optimized purge
& trap parameters. We developed a GC-GC method for baseline
separation of peaks, and determined accuracy, isotopic linearity
and method detection limits for each target compound. Possible
2
J. Zimmermann, P. Wanner and D. Hunkeler
Journal of Chromatography A 1655 (2021) 462480
isotope fractionation effects during the analytical measurement
[40–42] were also evaluated. The applicability of the developed
method was illustrated with soil extracts from a field site, where
soils had been contaminated by a complex mixture of organic contaminants.
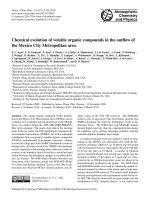
The effluent of the first column was directed via the Deans’
switch to either a flame ionization detector (FID) or to the second
column. By first separating a standard mixture in the first column
and diverting the complete flow to the FID, the switching times for
the Deans’ switch could be determined. For subsequent analytical
runs, the switching times were adjusted accordingly to only divert
the peaks of interest to the second column. The FID signal was still
monitored to ensure that the complete target peak was diverted to
the second column. The heart-cut valve after the second GC column allows additional cuts for target compounds that can only be
fully separated in the second dimension. The effluent of the second GC column led to an Isoprime GC5 combustion furnace (Elementar), where the hydrocarbons were transformed to CO2 . Subsequently, water was removed by a Nafion tube, semi-permeable
to water vapor, and finally the CO2 was analyzed in an Isoprime
100 (Elementar) continuous flow isotope ratio mass spectrometer
(CF-IRMS). Fig. 1 shows a scheme of the analytical setup.
The flow of the first column was controlled by the GC inlet and
set to 1.5 mL/min in constant pressure mode, while the flow of the
second column was controlled by a pressure control module (PCM)
and set to 2.5 mL/min in constant pressure mode, each for the initial GC oven temperature. Proper operation of the Deans’ switch requires the deactivated capillary leading to the FID, the so-called restrictor, to have the same pneumatic resistance as the second column [44]. To this end, its length had to be adjusted as a function
of initial GC oven temperature, column flow and choice of second
column. The parameters used are specified in detail in the supporting information (Table S3 in SI).
2. Material and methods
2.1. Chemicals
Nitrogen purge gas (≥99.995% purity) and helium carrier gas
(≥99.9999% purity) were obtained from Carbagas. Any aqueous solutions were prepared in ultrapure water from a Merck Millipore
Direct-Q 3 water purification system. Two different tetraglyme
products (≥99% purity) were obtained from Sigma Aldrich and
Thermo Fisher Scientific. Methanol (≥99.8% purity) was obtained
from Thermo Fisher Scientific. The extraction solvents and their
physical properties are summarized in Table S4 in the supporting
information.
Chlorinated aliphatic hydrocarbons and non-chlorinated aromatic hydrocarbons were obtained in high purities (Table 1). The
choice of twelve target compounds coincided with those found at
the field site. All target compounds with the exception of carbon
tetrachloride had been previously referenced isotopically towards
Vienne Pee Dee Belemnite (VPDB) with an elemental analyzer (EA)
as pure liquid phase. Stock solutions of target compounds were
prepared gravimetrically in methanol. The target compounds and
their physical properties are summarized in Table 1.
2.3. Choice of GC-GC columns
2.2. Carbon isotope analysis
Two-dimensional chromatography uses two columns of different selectivity, e.g. a polar and a non-polar column. We tested different combinations of columns before settling on a combination
that would enable baseline separation of the twelve target compounds in different matrices and at heavy column loading, while
at the same time avoiding excessive GC runtimes.
A non-polar thick-film 100% polydimethylsiloxane (PDMS)
phase column, Rtx-1 (30 m × 0.32 mm, 5 μm, Restek), was chosen
in the first dimension for the following two reasons: Firstly, nonpolar columns are not very selective for methanol, which would allow the extraction solvent peak to pass through the column without interfering with target compound separation. Secondly, thickfilm columns have a high resolution for volatiles and a high sample
loading capacity. The latter point is crucial in this study, as extraction solvents and a wide concentration range of target compounds
are introduced into the system.
For compound-specific carbon isotope analysis, 25 mL of a
42 mL sample were purged with N2 at 40 mL/min in a fritted
sparge vessel using a Stratum purge & trap system and Aquatek
70 autosampler (Teledyne Tekmar). The purged compounds were
trapped onto a Vocarb K 30 0 0 trap. Compounds were then desorbed by heating the trap to 250 °C, which could be preceded by
a dry purge cycle of 100 mL N2 at ambient temperature to remove water. During desorption, the desorbed compounds were introduced into the helium carrier gas stream of an Agilent 7890A
gas chromatograph (GC) through a 6-port valve, followed by cryogenic focusing at −120 °C. After 2 min of desorption, the cryogenic
trap was rapidly heated to 180 °C, releasing the compounds completely onto the first capillary column. The purge & trap parameters are specified in detail in the supporting information (Table S2
in SI).
Table 1
Properties of the investigated target compounds. δ 13 C VPDB values measured using an elemental analyzer, physicochemical data from Schwarzenbach et al. [43].
Systematic name
Common name
Manufacturer
Purity
δ 13 C VPDB (‰)
Molar mass M
(g/mol)
Density ρ
(g/cm3 )
Boiling point Tb
(°C)
Dichloromethane
Methylene
chloride
Chloroform
Carbon
tetrachloride
Merck
≥99.8 %
−30.17 ± 0.06
84.9
1.33
40.1
Fluka
Fluka
≥99.5 %
≥99.8 %
−48.38 ± 0.07
-
119.4
153.8
1.48
1.59
61.4
76.7
Fluka
Fluka
Fluka
Riedel-de-Haën
≥97.0
≥97.0
≥99.5
≥99.5
%
%
%
%
−18.92
−23.99
−26.70
−26.54
0.10
0.07
0.10
0.07
96.9
96.9
131.4
165.8
1.27
1.27
1.46
1.62
48.0
60.0
87.0
121.1
Sigma
Riedel-de-Haën
Fluka
Alfa Aesar
Fluka
≥98.0
≥99.5
≥99.0
≥99.0
≥99.0
%
%
%
%
%
−8.63 ± 0.05
−27.49 ± 0.03
−29.29 ± 0.06
−28.55 ± 0.05
−27.37 ± 0.12
167.9
92.9
106.2
106.2
106.2
1.60
0.87
0.86
0.88
0.86
146.3
110.6
136.2
144.4
139.1
Trichloromethane
Tetrachloromethane
trans-1,2-Dichloroethene
cis-1,2-Dichloroethene
Trichloroethene
Tetrachloroethene
±
±
±
±
Perchloroethene
1,1,2,2-Tetrachloroethane
Methylbenzene
Ethylbenzene
1,2-Dimethylbenzene
1,3-Dimethylbenzene
Toluene
ortho-Xylene
meta-Xylene
3
J. Zimmermann, P. Wanner and D. Hunkeler
Journal of Chromatography A 1655 (2021) 462480
Fig. 1. GC-GC-C-IRMS configuration.
Table 2
Theoretical purge times required to purge 90% of a target compound from 25 mL of water at a purge flow of 40 mL/min at
25 °C. Air-water partition constants (Kiaw ) from Schwarzenbach
et al. [43]. DCM, dichloromethane; CF, chloroform; CT, carbon
tetrachloride; DCE, dichloroethene; TCE, trichloroethene; PCE,
tetrachloroethene; TeCA, tetrachloroethane.
In the second dimension, a polar Rtx-Wax column
(15 m × 0.32 mm, 1 μm, Restek) was used. As the first column already achieved the bulk of the separation work, a shorter
column in the second dimension was deemed adequate to remove
interfering compounds and to achieve the baseline separation
necessary for C-IRMS.
2.4. Purge & trap and GC-GC optimization
The purge & trap and GC-GC parameters were first optimized
for target compounds in water, in order to determine the limits of
a basic application of the purge & trap and GC-GC-C-IRMS method,
without concerns for matrix effects. An important purge & trap parameter to be optimized is the purge time for a given purge flow.
A theoretical estimate of the time required to purge 90% of a target
compound from water was calculated using Eq. (2) [43]:
ciw (t ) = ciw (0 ) × e
−Kiaw×G
×t
Vw
(2)
where ciw (t ) is the target compound concentration in water after
a certain time t in μg/L, ciw (t ) is the initial concentration in water
in μg/L, G is the purge gas flow in mL/min and Vw is the purge
volume in mL. Kiaw is the dimensionless Henry or air-water partition constant that gives the ratio of the gaseous concentration in
air to the dissolved concentration of a compound i in pure water. It
can be approximated by the ratio of vapor pressure to aqueous solubility [43]. Setting ciw (t )/ciw (0 ) = 0.1, i.e. 10% of the compound
still remain in water, and solving for t yields theoretically required
purge times shown in Table 2.
An issue becomes evident when comparing the theoretical
purge times. 1,1,2,2-TeCA would require almost one and a half
hours for 90% of it to be purged from water, while all other compounds with the exception of DCM require less than 10 minutes of
purging.
Compound
Kiaw at 25 °C
Purge time at 25 °C (min)
DCM
CF
CT
trans-1,2-DCE
cis-1,2-DCE
TCE
PCE
1,1,2,2-TeCA
Toluene
Ethylbenzene
o-Xylene
m-Xylene
0.12
0.14
1.10
0.26
0.22
0.49
1.20
0.02
0.25
0.32
0.20
0.30
12.2
10.0
1.3
5.6
6.6
2.9
1.2
86.7
5.7
4.6
7.0
4.9
[18]. We applied Jochmann et al. [41]’s guidelines to determine
method detection limits (MDL) for δ 13 C analysis of each target
compound. To this end, standards were injected five times over a
range of concentration levels, and the mean δ 13 C value as well as
the standard deviation 1σ (n = 5) were plotted against the concentration. Subsequently, the mean δ 13 C value for the highest concentration levels was calculated, and an interval of ±0.5‰ was set
around this mean value. Next, the mean calculation was repeated,
this time including the next lower concentration level. This process
was repeated until the mean δ 13 C value for a concentration level
was either outside the ±0.5‰ interval around the moving mean,
or its 1σ was >0.5‰. The lowest concentration level to still meet
these criteria was defined as the MDL. We determined the isotopic
MDLs for each target compound according to this scheme, which
is shown for the examples of TCE and PCE in Figs. S1 and S2 in the
supporting information.
2.5. Standardization and method detection limit determination
The CO2 reference gas had been previously referenced towards
VPDB by dual inlet (DI) IRMS. It was introduced twice at the beginning and twice at the end of each analytical run. All target compounds were measured simultaneously during one analytical run.
To test for possible isotopic fractionation during sample preparation, concentration, separation and combustion, the obtained δ 13 C
values were compared to the EA values.
The concentration range for which the pre-defined precision
and trueness criteria are met is denoted the isotopic linearity range
2.6. VOC standards spiked with extraction solvents
In order to demonstrate the applicability of the GC-GC and soil
extraction methods for compound-specific δ 13 C analysis, multiple
concentration levels of target compounds were analyzed in water that had been spiked with different volumes of methanol and
TGDE. Isotopic linearity ranges were determined for each compound.
4
J. Zimmermann, P. Wanner and D. Hunkeler
Journal of Chromatography A 1655 (2021) 462480
VOC standards were prepared in 42 mL glass vials capped with
PTFE-coated silicone septa and screw caps from the methanol stock
via an intermediate aqueous solution. We observed a diminished
1,1,2,2-TeCA peak when analyzing the single compound in aqueous solution and the appearance of a TCE peak. As noted by Barani
et al. [45], 1,1,2,2-TeCA readily transforms to TCE via E2 elimination at neutral and alkaline pH. Hence, it was necessary to acidify
all aqueous solutions to a pH of 2 to 3 with HNO3 .
zene. The other peaks are well resolved and no undue peak broadening or tailing is observed.
To improve the purge efficiency of 1,1,2,2-TeCA, three possibilities were explored. Salting out, an increase in purge time, and an
increase of purge temperature. By increasing the ionic strength of
a solution through addition of salts, organic compounds may increasingly partition from the liquid phase towards the headspace.
When adding sodium chloride, we observed salt build-up in the
sparge vessel. Further after-effects may include blockage and corrosion of the purge & trap sample pathways [48]. Most importantly, the method does not affect non-polar compounds such as
1,1,2,2-TeCA, as these are already poorly soluble in water [43,49].
For these reasons, salting-out was quickly abandoned.
The effect of purge temperature was investigated using a thermostatically controlled custom water bath around the sparge vessel, held at 50 °C. As a rule-of-thumb, the Henry constant is expected to increase by a factor of 1.6 for a temperature increase of
10 °C in the ambient range [50], which in this case would cause an
increase of the Henry constant by a factor of 4 for a purge temperature of 50 °C vs 25 °C and accordingly lower the time required to
purge 90% of 1,1,2,2-TeCA to around 20 min.
The main drawback of increased purge temperature and time is
an increase of the amount of water that is transferred to the trap.
The effect can be observed in Fig. 2(c), causing tailing peaks for
early eluting compounds DCM, trans-1,2-DCE and cis-1,2-DCE and
an overall reduced intensity. The latter can be remedied by a drypurge cycle before release of the compounds from the trap [51].
We applied a dry-purge of 1 min at 100 mL/min N2 for a total
dry-purge volume of 100 mL. The effect can be seen in Fig. 2(d),
with an increased intensity for the late eluting compounds. The
peak tailing of the early eluting compounds remains an issue. In
general, DCM would benefit from a lower initial oven temperature
and lower cryogenic focusing temperature. Fig. 2(e) shows a combination of a longer purge time of 20 min with an increased purge
temperature of 50 °C. Here, even for 1,1,2,2-TeCA, the intensity is
further reduced, possibly requiring further investigations into the
effect of dry-purging. While the technique removes water from the
trap after purging is complete, a competitive sorption on the trap
between water and target compounds during purging may be the
underlying issue explaining the reduced intensity.
In conclusion, early eluting compounds should be purged at
room temperature, and 1,1,2,2-TeCA is the only target compound
that significantly benefits from an increased purge temperature.
Longer purge times than theoretically required are to be avoided,
in order to inhibit the ingress of water to the trap.
2.7. VOC samples from field site
Soil extracts in water, methanol and TGDE were prepared from
soil samples containing target compounds collected at a contaminated site. The site, previously characterized in detail by Wanner
et al. [46], is a former manufacturing facility, where 200 L of a
complex mixture of chlorinated and petroleum hydrocarbons were
introduced to the subsurface during the 1960s. These formed a
downgradient plume in the heterogeneous sandy aquifer, further
diffusing into a thin underlying aquitard. The contaminant source
was isolated from the active groundwater flow system by soil mixing with bentonite and zero-valent iron in 2008, and in 2018 a
study was initiated to evaluate in detail the plume response to this
source treatment.
Soil cores were drilled using a direct-push rig, followed by
subsampling of the low-permeability zones using tube-and-piston
subsamplers. Soil samples taken at the same depth were extracted
in methanol, TGDE or water. The soil samples, weighing 10 to 15 g,
were dispersed in 42 mL glass vials capped with PTFE-coated silicone septa and screw caps containing 20 mL of the extraction
medium [21]. The vials were weighed empty, with the extraction
medium, and with the extraction medium plus the soil sample
[47]..
The vials containing soil and extraction medium were sonicated, shaken, and centrifuged. Concentrations of VOC in the soil
extracts were measured using a gas chromatograph coupled to a
mass spectrometer (GC-qMS) based on EPA method 8260B, following pre-concentration with a purge & trap system (Table S1 in SI).
Selected matrix-rich samples in methanol and TGDE were analyzed after dilution in water and acidification using the developed
GC-GC-C-IRMS method with optimized purge & trap parameters as
described below.
3. Results and discussion
3.1. Purge & trap and GC-GC optimization
3.2. Method performance for CSIA
Fig. 2(a) shows the chromatogram at a single concentration
level that is obtained in the first dimension when diverting all
compounds to the FID, while Fig. 2(b) shows the chromatogram
detected with the IRMS when diverting all compounds eluting
from the first column onto the second column, each after a purge
time of 10 min at 25 °C. The GC temperature program was developed in a manner that would achieve separation of most target
compounds in a reasonable time frame, while limiting the retention of methanol. A co-elution was observed in the first dimension for o-xylene and 1,1,2,2-TeCA, but this could be resolved in
the second dimension. This required a rather low final GC temperature, thereby prolonging run time. Eventually, the GC temperature
program was as follows: Starting temperature of 70 °C, held for
2 min, 70 °C to 90 °C at 2 °C/min, held for 2 min, 90 °C to 165 °C
at 15 °C/min, held for 12.5 min, for a total run time of 31.5 min.
While having both columns in the same GC oven and undergoing
the same temperature program is not an optimum approach in GCGC analysis, the only drawback we observed for our contaminant
mixture was an incomplete separation of m-xylene and ethylben-
Fig. 3 (top) shows a comparison of method detection limits of
target compounds for different extraction solvent spiking levels
normalized to the MDL in water. Fig. 3 (bottom) shows the deviation in ‰-points of our mean measured δ 13 C values from the
δ 13 C VPDB values measured using an EA for the target compounds.
Purge & trap parameters were a 10 min purge time, dry-purge and
a purge temperature of 25 °C. For 1,1,2,2-TeCA, the effect of an elevated purge temperature of 50 °C was also investigated.
Our measured δ 13 C values in water are for most compounds
higher than the EA value, indicating an isotopic enrichment during sample concentration and/or analysis. This systematic offset is
inherent to purge & trap concentration [39,52]. An inverse 13 C isotope effect during volatilization of VOC has been observed by, e.g.,
Baertschi et al. [53], Bradley [54], Huang et al. [55], Poulson and
Drever [56], and Jeannottat and Hunkeler [57]. If this offset remains constant within the limits of isotopic linearity for standards,
the values measured for actual samples can be corrected by simple
means.
5
J. Zimmermann, P. Wanner and D. Hunkeler
Journal of Chromatography A 1655 (2021) 462480
Fig. 2. Chromatograms of target compounds in water for the (a) first dimension, showing only the FID signal, and (b–e) second dimension, as detected by the IRMS after
conversion to CO2 . Concentrations of 90 μg/L for DCM, CF, CT and 1,1,2,2-TeCA; 45 μg/L for trans-1,2-DCE, cis-1,2-DCE, TCE and PCE; 16–17 μg/L for toluene, ethylbenzene,
m-xylene and o-xylene.
6
J. Zimmermann, P. Wanner and D. Hunkeler
Journal of Chromatography A 1655 (2021) 462480
Fig. 3. (Top) Comparisons of target compound method detection limits in different matrices for optimized purge & trap parameters, and for 1,1,2,2-TeCA additionally for
purging at 50 °C. TCE, CF and CT have been omitted because of suspected contamination of the methanol used for spiking. (Bottom) Deviation in ‰-points of our mean
measured δ 13 C values from the δ 13 C VPDB values measured using an EA for the target compounds.
3.2.1. Methanol as extraction solvent
Methanol and the target compounds were already well separated in the first dimension. We observed, however, a decreasing
intensity for all compounds with increasing methanol content from
1% to 2% to 3% (v/v). This is reflected by a higher MDL for all target compounds at a methanol spiking level of 3% (Fig. 3 top). The
lower intensity is thought to be caused by competitive sorption
between methanol and the target compounds on the trap. Target
compounds could be resolved using the two-dimensional GC setup
for methanol spiking levels of up to 3% (v/v). Beyond this value,
the likelihood of saturating the first column increased and target
compound peaks could not be resolved anymore. A combination
of 3% (v/v) and heated purging caused strong shifts in retention
times, making it difficult to set the correct timing for the Deans’
switch. Hence, it was not possible to increase the purge efficiency
of 1,1,2,2-TeCA at higher methanol proportions.
For most compounds, the carbon isotopic enrichment seen
when purging target compounds from pure water is reduced when
spiking with methanol (Fig. 3 bottom). Hence, it would be necessary to match the amount of extraction solvent in standards and
samples.
Fig. 4 shows the chromatograms for a sample from the field
site that required analysis at a methanol content of 3% (v/v), due
to the low concentrations of certain target compounds. The twodimensional setup allowed separation of target peaks from nontarget peaks, impurities in the methanol and the methanol itself.
7
J. Zimmermann, P. Wanner and D. Hunkeler
Journal of Chromatography A 1655 (2021) 462480
Fig. 4. Chromatograms for analysis of a sample from the field site that was extracted with methanol for (a) first dimension and (b) second dimension. Methanol proportion
during purging is 3% (v/v).
Fig. 5. Chromatogram in the second dimension of target compounds in water spiked with 10% TGDE (v/v) for purging at 25 °C. Concentrations of 90 μg/L for DCM, CF, CT
and 1,1,2,2-TeCA; 45 μg/L for trans-1,2-DCE, cis-1,2-DCE, TCE and PCE; 16–17 μg/L for toluene, ethylbenzene, m-xylene and o-xylene. Purge time 10 min at 40 mL/min, dry
purge 1 min at 100 mL/min.
3.2.2. TGDE as extraction solvent
We spiked aqueous solutions containing target compounds with
different amounts of TGDE up to 10% (v/v) and purged them for
10 min at 25 °C and for 1,1,2,2-TeCA at 50 °C. For the sensitivity,
we observed some major advantages of TGDE over methanol. For
many of the compounds, the MDLs are on par with those measured in the best-case scenario, which is in pure water (Fig. 3 top).
Furthermore, with a TGDE spiking level of 10% (v/v), the maximum
permissible extraction solvent level for purge & trap analysis can
be increased by a factor of three over methanol, which in turn results in a lower MDL for soil extracts by a factor of three.
For some compounds, MDLs when spiking with TGDE are
higher compared to purging from pure water (Fig. 3 top). The peak
intensity for all target compounds peaks is diminished when the
sample is spiked with 10% TGDE (Fig. 5) compared to when purged
from pure water (Fig. 2(b)). For 1,1,2,2-TeCA, MDLs are not any
lower when increasing the purge temperature to 50 °C, in contrast to the heating effect observed in pure water for 1,1,2,2-TeCA
(Fig. 3). As discussed by Staudinger and Roberts [50], the presence
of other organic solvents can decrease Henry’s constants for target
VOCs, especially those that are poorly soluble in water, which is
the case for all of our studied target compounds. This so-called cosolvent effect occurs when another non-target organic solvent, in
our case TGDE, is present at concentrations higher than 10% (v/v),
causing it to not be fully hydrated. The molecules of interest will
then dissolve into the co-solvent and thus cannot be purged efficiently. The effect is less severe for the aromatic hydrocarbons,
which have a lower octanol-water coefficient than the aliphatic hydrocarbons [43]. This supports the hypothesis that it is indeed the
dissolution of the analytes into the co-solvent that causes the decrease in purging efficiency.
At high spiking levels, it became apparent that both TGDE
products that were used contained high amounts of volatile compounds. Jenkins and Schumacher [14] and Troost [31] purified the
TGDE used in their purge & trap studies by rotary evaporation under vacuum at 97 °C or purging with an ultrapure gas at 80 °C,
respectively. However, in these cases the TGDE was diluted in water by a factor of 60 or 50. A more sophisticated purification step
is necessary for a higher proportion of TGDE. Huybrechts et al.
[58] investigated proportions of TGDE up to 20% in water, and purified the TGDE through an aluminum oxide column to remove peroxides. These peroxides are easily formed by reaction of the TGDE
with ambient oxygen. An oxygen scavenger was also added to the
purified TGDE. Bouchard et al. [32] used TGDE proportions of up
to 15% (v/v) without a prior purification step; however, the analysis was limited to only two target compounds.
We attempted to purify the TGDE as suggested by Troost [31] by
heating an aliquot to 80 °C and passing a flow of ultrapure nitrogen
for several hours. Only one of the TGDE products improved significantly with regards to VOC contamination following this treatment.
Although the baseline in the first dimension remained noisy, target compounds, with the exception of CT, could be isolated from
the interfering compounds using the two-dimensional GC setup
(Fig. 5).
8
J. Zimmermann, P. Wanner and D. Hunkeler
Journal of Chromatography A 1655 (2021) 462480
Fig. 6. Two-dimensional analysis of a sample from the field site that was extracted with TGDE. TGDE proportion during purging is 10% (v/v).
A frequently encountered downside of TGDE is its tendency
to foam during purge & trap applications. This can be prevented
by adding anti-foaming agents. We tested two commercial silicone anti-foaming agents, one of them specifically marketed for
purge & trap analysis, and found both of them to contain unacceptable levels of interfering contaminants, which could not be eliminated even using GC-GC. Erickson et al. [59] studied several antifoaming agents and determined that they require prior purification
for purge & trap analysis. We dispensed with using anti-foaming
agents and did not observe troublesome levels of foaming at TGDE
proportions of up to 10% (v/v). Frequently analyzed blanks of ultrapure water did not indicate any carryover in the purge & trap
system.
At a TGDE spiking level of 10% (v/v), the δ 13 C offsets from δ 13 C
EA values are similar in magnitude to those measured when spiking with methanol (Fig. 3 bottom). For 1,1,2,2-TeCA, however, the
necessity of heating the sample during purging is demonstrated. In
pure water, sensitivity of 1,1,2,2-TeCA analysis is considerably improved by heating. At a high TGDE spiking level, sensitivity is not
improved by heating, however, it is required in order for the mean
δ 13 C value to show a similar offset to that measured in pure water
and when spiked with methanol. Fig. 6 shows the chromatograms
for a sample from the field site that required analysis at a TGDE
proportion of 10% (v/v), due to the low concentrations of certain
target compounds. The two-dimensional setup allowed separation
of target peaks from non-target peaks and impurities in the TGDE.
The δ 13 C values for samples from the field site taken at same
depths were in good agreement for both extraction solvents (data
not shown). Furthermore, our values showed an isotopic enrichment of parent compounds 1,1,2,2-TeCA and CF in the aquitard, indicating that degradation is taking place. This is in accordance with
the findings in the earlier study at this field site by Wanner et al.
[46], which had been performed on water extracts.
soil), hence values for CT, PCE and toluene were rejected. As opposed to the isotopic measurements of soil extracts, concentrations
were measured highly diluted in water, thus co-solvent effects are
not expected to be relevant.
The mean extraction efficiency of TGDE was for all compounds
lower than that achieved using methanol, but always above 75%
of the methanol extraction efficiency (Fig. 7). The performance of
these two extraction solvents has been the focus of previous studies. Jenkins and Schumacher [14] compared the extraction efficiency of TGDE for soils that had been spiked with VOCs through
vapor equilibration, with methanol performing as well or better
than TGDE. Hewitt [16] spiked soil specimen with VOCs in aqueous solutions or through a process called vapor fortification. Here,
methanol also achieved higher, quantitative recoveries of target
VOCs compared to TGDE, independent of the spiking method. This
discrepancy was found to become more pronounced with increasing organic carbon content of the soil specimen.
As our study applied these extraction methods to natural soil
samples from a contaminated site, some of our observed differences in recovery may also be due to soil and VOC distribution
heterogeneities.
The use of TGDE as soil extraction solvent allows higher proportions of extraction solvent of up to 10% (v/v) during purge & trap
analysis. Consequently, the lower soil extraction efficiency of TGDE
compared to methanol is offset by the higher permissible extraction solvent-to-water ratio. Even higher TGDE proportions might
be possible when further purifying the TGDE before soil extraction. Compared to direct injection of soil extracts containing VOC,
limited to a volume of a few μL for splitless injection, the use of
purge & trap allows the analysis of 2.5 mL of TGDE soil extract, or
830 μL of methanol soil extract, in a 25 mL purge vessel, hereby
lowering the MDL for compound-specific carbon isotope analysis
in soil by up to three orders of magnitude. In comparison to this
substantial improvement, the MDL increases by a factor of two for
most compounds at high spiking levels of extraction solvents are
of little consequence.
The samples from the field site were taken at a soil-toextraction-solvent ratio of 10–15 g of wet soil in 20 mL of solvent.
This yields an MDL for soil of, e.g., 0.22 μg/g for TCE (Calculation in
SI). Blessing [29] obtained MDLs of 10–20 μg/kg or 0.01–0.02 μg/g
in soil for PAH using a large volume injection of 150 μL extraction
solvent, not requiring dilution but rather concentration of the solvent, which is not easily possible for VOC as target compounds. As,
for example, the PAH naphtalene contains five times as many car-
3.3. Comparison of soil extraction efficiency of water, methanol and
TGDE for target compounds and implications for MDL
Normalized to the wet soil sample weight, we compared the
target compound concentrations of up to 28 soil extracts from the
field site in water, TGDE and methanol. Water was not able to extract a sufficient amount of VOC from the soil samples for δ 13 C
analysis, thus this extraction method is not discussed any further.
We limited the statistical treatment to those samples for which the
soil concentration in both methanol and TGDE was >5 μg/g (in wet
9
J. Zimmermann, P. Wanner and D. Hunkeler
Journal of Chromatography A 1655 (2021) 462480
Fig. 7. Comparison of extraction efficiency of TGDE compared to methanol for soil extracts from the field site. Diamonds denote mean values, circles are outliers according
to ±1.5 × interquartile ranges.
bon atoms as TCE, our MDLs are on a per carbon basis about 2–4
times higher than those obtained by Blessing [29]. As explained in
the introduction, methods that use a liquid injection of 1 μL solvent have MDLs several orders of magnitude higher. Herrero et al.
[60] have recently reported a carbon CSIA MDL for TCE in soil of
0.034 μg/g using dimethylacetamide as extraction solvent at a proportion of 20% in water (v/v) in combination with headspace solidphase microextraction (SPME). The method was tested on a mixture of four aliphatic chlorinated hydrocarbons and might not be
easily extended to complex VOC mixtures often found at contaminated sites.
Typical TCE levels encountered in an aquitard downgradient of
a TCE source zone might range between 1 and 15 μg/g [61], and
our method would allow measuring compound-specific δ 13 C values
even below this range. Depending on soil properties, water extraction might prove favorable as no further dilution is necessary and
MDLs are generally lower (Fig. 3 top). As noted, for our strongly
sorbing soil, this extraction method did not yield sufficient recoveries of target compounds.
TGDE turned out to be a viable alternative to methanol for GCC-IRMS analysis of matrix-rich soil extracts. Its low vapor pressure
is an advantage for purge & trap concentration and allows for a
high extraction solvent-to-water ratio of up to 10% (v/v), which
could possibly be increased.
The wide range of target compounds with different physicochemical properties that we investigated makes it difficult to draw
broad conclusions on purge & trap optimization. For this method,
water management must not be disregarded in any kind of matrix
when attempting to maximize purge efficiencies. Hence, shorter
purge times and lower temperatures may even prove favorable.
Dry-purge has been shown to be an important parameter that
could be further optimized. The method, as all headspace analysis methods, reaches its limit when semi-volatile compounds such
as 1,1,2,2-TeCA need to be analyzed, but can be adapted to many
volatile compound target analytes.
For environmental samples, our method allows demonstrating
contaminant degradation in lower-permeability layers, broadening
the application of carbon CSIA beyond groundwater samples.
4. Conclusion
Declaration of Competing Interest
We compared the suitability of two different extraction solvents, methanol and TGDE, for compound-specific carbon analysis of a range of petroleum and chlorinated hydrocarbon contaminants. Two-dimensional chromatography was necessary in order
to achieve baseline separation of peaks at high extraction solventto-water ratios. Trueness and precision of δ 13 C analysis were not
compromised compared to pure water as a matrix, although MDLs
were elevated for most compounds. A thick-film column capable of
high column loading was required in order to keep retention times
constant. The GC-GC setup required no additional oven.
The authors declare that they have no known competing financial interests or personal relationships that could have appeared to
influence the work reported in this paper.
CRediT authorship contribution statement
Jeremy Zimmermann: Conceptualization, Methodology, Validation, Formal analysis, Investigation, Writing – original draft, Visualization. Philipp Wanner: Conceptualization, Investigation, Writing
– review & editing. Daniel Hunkeler: Conceptualization, Writing
10
J. Zimmermann, P. Wanner and D. Hunkeler
Journal of Chromatography A 1655 (2021) 462480
– review & editing, Resources, Supervision, Project administration,
Funding acquisition.
[15] M.M. Minnich, B.A. Schumacher, J.H. Zimmerman, Comparison of soil VOCs
measured by soil gas, heated headspace, and methanol extraction techniques,
J. Soil Contam. 6 (1997) 187–203, doi:10.1080/15320389709383556.
[16] A.D. Hewitt, Comparison of sample preparation methods for the analysis of
volatile organic compounds in soil samples: solvent extraction vs vapor partitioning, Environ. Sci. Technol. 32 (1998) 143–149, doi:10.1021/es970431q.
[17] K. Dettmer-Wilde, W. Engewald, Practical Gas Chromatography: A Comprehensive Reference eds., Springer-Verlag, Heidelberg, 2014.
[18] B. Sherwood Lollar, S.K. Hirschorn, M.M.G. Chartrand, G. Lacrampe-Couloume,
An approach for assessing total instrumental uncertainty in compound-specific
carbon isotope analysis: implications for environmental remediation studies,
Anal. Chem. 79 (2007) 3469–3475, doi:10.1021/ac062299v.
[19] K.E.A. Ohlsson, P.H. Wallmark, Novel calibration with correction for drift and
non-linear response for continuous flow isotope ratio mass spectrometry applied to the determination of δ 15 N, total nitrogen, δ 13 C and total carbon in
biological material†, Analyst 124 (1999) 571–577, doi:10.1039/A900855A.
[20] W.P. Ball, G. Xia, D.P. Durfee, R.D. Wilson, M.J. Brown, D.M. Mackay, Hot
methanol extraction for the analysis of volatile organic chemicals in subsurface
core samples from dover air force base, Delaware, Groundw. Monit. Remediat.
17 (1997) 104–121, doi:10.1111/j.1745-6592.1997.tb01190.x.
[21] B.L. Parker, J.A. Cherry, S.W. Chapman, Field study of TCE diffusion profiles below DNAPL to assess aquitard integrity, J. Contam. Hydrol. 74 (2004) 197–230,
doi:10.1016/j.jconhyd.2004.02.011.
[22] P. Wanner, D. Hunkeler, Carbon and chlorine isotopologue fractionation of
chlorinated hydrocarbons during diffusion in water and low permeability sediments, Geochim. Cosmochim. Acta 157 (2015) 198–212, doi:10.1016/j.gca.2015.
02.034.
[23] P. Wanner, B.L. Parker, S.W. Chapman, R. Aravena, D. Hunkeler, Quantification of degradation of chlorinated hydrocarbons in saturated low permeability
sediments using compound-specific isotope analysis, Environ. Sci. Technol. 50
(2016) 5622–5630, doi:10.1021/acs.est.5b06330.
[24] P. Wanner, B.L. Parker, S.W. Chapman, R. Aravena, D. Hunkeler, Does sorption
influence isotope ratios of chlorinated hydrocarbons under field conditions?
Appl. Geochem. 84 (2017) 348–359, doi:10.1016/j.apgeochem.2017.07.016.
[25] W. Wilcke, M. Krauss, W. Amelung, Carbon isotope signature of polycyclic aromatic hydrocarbons (PAHs): evidence for different sources in tropical and temperate environments? Environ. Sci. Technol. 36 (2002) 3530–3535, doi:10.1021/
es020032h.
[26] M. Kim, M.C. Kennicutt, Y. Qian, Polycyclic aromatic hydrocarbon purification
procedures for compound specific isotope analysis, Environ. Sci. Technol. 39
(2005) 6770–6776, doi:10.1021/es050577m.
[27] M.C. Graham, R. Allan, A.E. Fallick, J.G. Farmer, Investigation of extraction and
clean-up procedures used in the quantification and stable isotopic characterisation of PAHs in contaminated urban soils, Sci. Total Environ. 360 (2006) 81–
89, doi:10.1016/j.scitotenv.2005.08.026.
[28] C. Bosch, A. Andersson, M. Kruså, C. Bandh, I. Hovorková, J. Klánová,
T.D.J. Knowles, R.D. Pancost, R.P. Evershed, Ö. Gustafsson, Source apportionment of polycyclic aromatic hydrocarbons in central european soils with
compound-specific triple isotopes (δ 13C, 14C, and δ 2H), Environ. Sci. Technol. 49 (2015) 7657–7665, doi:10.1021/acs.est.5b01190.
[29] M. Blessing, Compound-specific isotope analysis to delineate the sources and
fate of organic contaminants in complex aquifer systems, PhD Thesis, Universität Tübingen, 2008, 44-45. />handle/10900/49213 (accessed November 26, 2020).
[30] M. Blessing, M.A. Jochmann, S.B. Haderlein, T.C. Schmidt, Optimization of a
large-volume injection method for compound-specific isotope analysis of polycyclic aromatic compounds at trace concentrations: Optimized large-volume
injection method for isotopic analyzes of PAHs, Rapid Commun. Mass Spectrom. 29 (2015) 2349–2360, doi:10.1002/rcm.7389.
[31] J.R. Troost, An air to water bridge: Air sampling and analysis using tetraglyme,
Anal. Chem. 71 (1999) 1474–1478, doi:10.1021/ac981316g.
[32] D. Bouchard, P. Wanner, H. Luo, P.W. McLoughlin, J.K. Henderson, R.J. Pirkle,
D. Hunkeler, Optimization of the solvent-based dissolution method to sample volatile organic compound vapors for compound-specific isotope analysis,
J. Chromatogr. A 1520 (2017) 23–34, doi:10.1016/j.chroma.2017.08.059.
[33] P.Q. Tranchida, D. Sciarrone, P. Dugo, L. Mondello, Heart-cutting multidimensional gas chromatography: a review of recent evolution, applications, and future prospects, Anal. Chim. Acta 716 (2012) 66–75, doi:10.1016/j.aca.2011.12.
015.
[34] D.R. Deans, A new technique for heart cutting in gas chromatography [1],
Chromatographia 1 (1968) 18–22, doi:10.10 07/BF022590 05.
´ R.J. Ansell, D.A. Cowan, A.T. Kicman, Two[35] A.D. Brailsford, I. Gavrilovic,
dimensional gas chromatography with heart-cutting for isotope ratio mass
spectrometry analysis of steroids in doping control, Drug Test. Anal. 4 (2012)
962–969, doi:10.1002/dta.1379.
[36] D. Sciarrone, A. Schepis, M. Zoccali, P. Donato, F. Vita, D. Creti, A. Alpi, L. Mondello, Multidimensional gas chromatography coupled to combustion-isotope
ratio mass spectrometry/quadrupole MS with a low-bleed ionic liquid secondary column for the authentication of truffles and products containing truffle, Anal. Chem. 90 (2018) 6610–6617, doi:10.1021/acs.analchem.8b00386.
[37] Y. Horii, K. Kannan, G. Petrick, T. Gamo, J. Falandysz, N. Yamashita, Congenerspecific carbon isotopic analysis of technical PCB and PCN mixtures using twodimensional gas chromatography−isotope ratio mass spectrometry, Environ.
Sci. Technol. 39 (2005) 4206–4212, doi:10.1021/es050133q.
[38] H. Nara, F. Nakagawa, N. Yoshida, Development of two-dimensional gas chromatography/isotope ratio mass spectrometry for the stable carbon isotopic
Acknowledgments
We would like to thank Prof. Tadeusz Górecki (University of
Waterloo, Canada) and Prof. Violaine Ponsin (Université du Québec
à Montréal) for guidance in two-dimensional chromatography. We
would also like to thank the field crew who collected the soil samples: Steven Chapman, Flavia Isenschmid, Ryan Kroeker and Nathan
Glas.
Funding
This work was supported by the Swiss National Science Foundation (SNSF) [grant number 166233].
Supplementary materials
Supplementary material associated with this article can be
found, in the online version, at doi:10.1016/j.chroma.2021.462480.
References
[1] A. Badin, M.M. Broholm, C.S. Jacobsen, J. Palau, P. Dennis, D. Hunkeler, Identification of abiotic and biotic reductive dechlorination in a chlorinated ethene
plume after thermal source remediation by means of isotopic and molecular
biology tools, J. Contam. Hydrol. 192 (2016) 1–19, doi:10.1016/j.jconhyd.2016.
05.003.
[2] M. Braeckevelt, A. Fischer, M. Kästner, Field applicability of compound-specific
isotope analysis (CSIA) for characterization and quantification of in situ contaminant degradation in aquifers, Appl. Microbiol. Biotechnol. 94 (2012) 1401–
1421, doi:10.10 07/s0 0253- 012- 4077- 1.
[3] J. Palau, M. Marchesi, J.C.C. Chambon, R. Aravena, À. Canals, P.J. Binning,
P.L. Bjerg, N. Otero, A. Soler, Multi-isotope (carbon and chlorine) analysis for
fingerprinting and site characterization at a fractured bedrock aquifer contaminated by chlorinated ethenes, Sci. Total Environ. 475 (2014) 61–70, doi:10.1016/
j.scitotenv.2013.12.059.
[4] C. Wiegert, C. Aeppli, T. Knowles, H. Holmstrand, R. Evershed, R.D. Pancost,
J. Macháˇcková, Ö. Gustafsson, Dual carbon–chlorine stable isotope investigation of sources and fate of chlorinated ethenes in contaminated groundwater,
Environ. Sci. Technol. 46 (2012) 10918–10925, doi:10.1021/es3016843.
[5] T.C. Schmidt, M.A. Jochmann, Origin and fate of organic compounds in water:
characterization by compound-specific stable isotope analysis, Annu. Rev. Anal.
Chem. 5 (2012) 133–155, doi:10.1146/annurev- anchem- 062011- 143143.
[6] A.S. Ojeda, E. Phillips, B.S. Lollar, Multi-element (C, H, Cl, Br) stable isotope
fractionation as a tool to investigate transformation processes for halogenated
hydrocarbons, Environ. Sci. Process. Impacts 22 (2019) 567–582, doi:10.1039/
C9EM00498J.
[7] J. Zimmermann, L.J.S. Halloran, D. Hunkeler, Tracking chlorinated contaminants
in the subsurface using compound-specific chlorine isotope analysis: a review
of principles, current challenges and applications, Chemosphere 244 (2020)
125476, doi:10.1016/j.chemosphere.2019.125476.
[8] Y. Zhang, H.J. Tobias, G.L. Sacks, J.T Brenna, Calibration and data processing in
gas chromatography combustion isotope ratio mass spectrometry: calibration
in IRMS, Drug Test. Anal. 4 (2012) 912–922, doi:10.1002/dta.394.
[9] K.A. van Leeuwen, P.D. Prenzler, D. Ryan, F. Camin, Gas chromatographycombustion-isotope ratio mass spectrometry for traceability and authenticity
in foods and beverages, Compr. Rev. Food Sci. Food Saf. 13 (2014) 814–837,
doi:10.1111/1541-4337.12096.
[10] M.P. Ricci, D.A. Merritt, K.H. Freeman, J.M. Hayes, Acquisition and processing of
data for isotope-ratio-monitoring mass spectrometry, Org. Geochem. 21 (1994)
561–571, doi:10.1016/0146-6380(94)90 0 02-7.
[11] S.J. Lawrence, Description, properties, and degradation of selected volatile organic compounds detected in ground water - a review of selected literature, Open-File Report 20 06-1338 (20 06) 06/1338/,
doi:10.3133/ofr20061338.
˙ Polkowska, B. Zabiegała, J. Namies´ nik, Sample
[12] N. Jakubowska, B. Zygmunt, Z.
preparation for gas chromatographic determination of halogenated volatile organic compounds in environmental and biological samples, J. Chromatogr. A
1216 (2009) 422–441, doi:10.1016/j.chroma.2008.08.092.
[13] M.J. Charles, M.S. Simmons, Recovery studies of volatile organics in sediments using purge/trap methods, Anal. Chem. 59 (1987) 1217–1221, doi:10.
1021/ac00135a031.
[14] T.F. Jenkins, P.W. Schumacher, Comparison of Methanol and Tetraglyme as Extraction Solvents for Determination of Volatile Organics in Soil, Special Report
87-22, U.S. Army Cold Regions Research and Engineering Lab, Hanover, NH,
USA, 1987 />11
J. Zimmermann, P. Wanner and D. Hunkeler
[39]
[40]
[41]
[42]
[43]
[44]
[45]
[46]
[47]
[48]
Journal of Chromatography A 1655 (2021) 462480
analysis of C2–C5 non-methane hydrocarbons emitted from biomass burning,
Rapid Commun. Mass Spectrom. 20 (2006) 241–247, doi:10.1002/rcm.2302.
V. Ponsin, T.E. Buscheck, D. Hunkeler, Heart-cutting two-dimensional gas
chromatography–isotope ratio mass spectrometry analysis of monoaromatic
hydrocarbons in complex groundwater and gas-phase samples, J. Chromatogr.
A 1492 (2017) 117–128, doi:10.1016/j.chroma.2017.02.060.
W. Meier-Augenstein, P.W. Watt, C.D. Langhans, Influence of gas chromatographic parameters on measurement of 13C/12C isotope ratios by gas-liquid
chromatography-combustion isotope ratio mass spectrometry. I, J. Chromatogr.
A 752 (1996) 233–241, doi:10.1016/S0 021-9673(96)0 0498-0.
M.A. Jochmann, M. Blessing, S.B. Haderlein, T.C. Schmidt, A new approach to
determine method detection limits for compound-specific isotope analysis of
volatile organic compounds, Rapid Commun. Mass Spectrom. 20 (2006) 3639–
3648, doi:10.1002/rcm.2784.
C. Tang, J. Tan, S. Xiong, J. Liu, Y. Fan, X. Peng, Chlorine and bromine isotope fractionation of halogenated organic pollutants on gas chromatography
columns, J. Chromatogr. A 1514 (2017) 103–109, doi:10.1016/j.chroma.2017.07.
058.
R.P. Schwarzenbach, P.M. Gschwend, D.M. Imboden, Environmental Organic
Chemistry, 2nd Ed., John Wiley & Sons, 2003.
P. Boeker, J. Leppert, B. Mysliwietz, P.S. Lammers, Comprehensive theory of the
deans’ switch as a variable flow splitter: fluid mechanics, mass balance, and
system behavior, Anal. Chem. 85 (2013) 9021–9030, doi:10.1021/ac401419j.
F. Barani, N. Dell’Amico, L. Griffone, M. Santoro, C. Tarabella, Determination of
volatile organic compounds by headspace trap, J. Chromatogr. Sci. 44 (2006)
625–630, doi:10.1093/chromsci/44.10.625.
P. Wanner, B.L. Parker, S.W. Chapman, G. Lima, A. Gilmore, E.E. Mack, R. Aravena, Identification of degradation pathways of chlorohydrocarbons in saturated low-permeability sediments using compound-specific isotope analysis,
Environ. Sci. Technol. 52 (2018) 7296–7306, doi:10.1021/acs.est.8b01173.
F. Isenschmid, Assessing the Remediation of an Aquifer - Aquitard System Contaminated by Chlorinated Hydrocarbons, Université de Neuchâtel, 2018 Unpublished master’s thesis.
T. Manickum, W. John, Trace analysis of taste-odor compounds in water by
salt-free purgeand-trap sampling with GC-MS detection, J. Waste Water Treat.
Anal. 2 (2011), doi:10.4172/2157-7587.10 0 0121.
[49] S.A. Wercinski, Solid Phase Microextraction: A Practical Guide, 1st Ed., CRC
Press, 1999.
[50] J. Staudinger, P.V. Roberts, A critical review of Henry’s law constants for environmental applications, Crit. Rev. Environ. Sci. Technol. 26 (1996) 205–297,
doi:10.1080/10643389609388492.
[51] K.J. Lee, H. Pyo, S.J. Park, E.A. Yoo, D.W. Lee, A study on purge efficiency in
purge and trap analysis of VOCs in water a study on purge efficiency in purge
and trap analysis of VOCs in water, Bull. Korean Chem. Soc. 22 (2001) 171–178.
[52] L. Zwank, M. Berg, T.C. Schmidt, S.B. Haderlein, Compound-specific carbon isotope analysis of volatile organic compounds in the low-microgram per liter
range, Anal. Chem. 75 (2003) 5575–5583, doi:10.1021/ac034230i.
[53] P. Baertschi, W. Kuhn, H. Kuhn, Fractionation of Isotopes by distillation of some
organic substances, Nature 171 (1953) 1018–1020, doi:10.1038/1711018a0.
[54] D.C. Bradley, Fractionation of isotopes by distillation of some organic substances, Nature 173 (1954) 260–261, doi:10.1038/173260a0.
[55] L. Huang, N.C. Sturchio, T. Abrajano, L.J. Heraty, B.D. Holt, Carbon and chlorine isotope fractionation of chlorinated aliphatic hydrocarbons by evaporation,
Org. Geochem. 30 (1999) 777–785, doi:10.1016/S0146-6380(99)0 0 060-1.
[56] S.R. Poulson, J.I. Drever, Stable isotope (C, Cl, and H) fractionation during vaporization of trichloroethylene, Environ. Sci. Technol. 33 (1999) 3689–3694,
doi:10.1021/es990406f.
[57] S. Jeannottat, D. Hunkeler, Chlorine and carbon isotopes fractionation during volatilization and diffusive transport of trichloroethene in the unsaturated
zone, Environ. Sci. Technol. 46 (2012) 3169–3176, doi:10.1021/es203547p.
[58] T. Huybrechts, J. Dewulf, K. Van Craeynest, H. Van Langenhove, Evaluation of
tetraglyme for the enrichment and analysis of volatile organic compounds in
air, J. Chromatogr. A 922 (2001) 207–218, doi:10.1016/S0021-9673(01)00930-X.
[59] M.D. Erickson, M.K. Alsup, P.A. Hyldburg, Foam prevention in purge and trap
analysis, Anal. Chem. 53 (1981) 1265–1269, doi:10.1021/ac00231a031.
[60] J. Herrero, D. Puigserver, B.L. Parker, J.M. Carmona, A new method for determining compound specific carbon isotope of chlorinated solvents in porewater,
Groundw. Monit. Remediat. (2021) n/a, doi:10.1111/gwmr.12435.
[61] S.W. Chapman, B.L. Parker, Plume persistence due to aquitard back diffusion
following dense nonaqueous phase liquid source removal or isolation, Water
Resour. Res. (2005) 41, doi:10.1029/20 05WR0 04224.
12