Effect-directed analysis as a method for quality and authenticity estimation of Rhodiola rosea L. preparations
Bạn đang xem bản rút gọn của tài liệu. Xem và tải ngay bản đầy đủ của tài liệu tại đây (1.46 MB, 8 trang )
Journal of Chromatography A 1649 (2021) 462217
Contents lists available at ScienceDirect
Journal of Chromatography A
journal homepage: www.elsevier.com/locate/chroma
Effect-directed analysis as a method for quality and authenticity
estimation of Rhodiola rosea L. preparations
c
´
Hanna Nikolaichuk a, Rafał Typek a, Sebastian Gnat b, Marek Studzinski
,
a,∗
Irena Maria Choma
a
Department of Chromatography, Institute of Chemical Sciences, Faculty of Chemistry, Maria Curie-Skłodowska University, Maria Curie-Skłodowska sq.3,
20-031 Lublin, Poland
Department of Veterinary Microbiology, University of Life Sciences, Akademicka Str. 13, 20-950 Lublin, Poland
c
Department of Physical Chemistry, Institute of Chemical Sciences, Faculty of Chemistry, Maria Curie-Skłodowska University, Maria Curie-Skłodowska sq.3,
20-031 Lublin, Poland
b
a r t i c l e
i n f o
Article history:
Received 21 January 2021
Revised 23 April 2021
Accepted 25 April 2021
Available online 2 May 2021
Keywords:
Authenticity
Effect-directed analysis
Rhodiola rosea L.
Rosavins
Salidroside
p-Tyrosol
a b s t r a c t
Adulterations of food and pharmaceutical preparations are the important global problem. On the one
hand, fraud practices are becoming more and more sophisticated while on the other, monitoring and
uncovering falsifications are insufficient. One of the most common consumer concern is the quality and
authenticity of the purchased products, related to the confidence that they have composition and properties in accordance with the manufacturer’s declaration on the label. This refers also to pharmaceuticals
potentially delivering great health benefits such as Rhodiola rosea L. supplements. The aim of this study
was defining authenticity and possible adulterations of two R. rosea preparations basing on their TLCbioprofiles and the presence of biomarker compounds characteristic for this plant. The effect-directed
analysis (EDA), i.e. TLC hyphenated with micro-chemical and biological assays performed directly on
TLC plates followed by HPLC-ESI-MS was used for the bioprofiling of antioxidants, antibacterials, and
inhibitors of lipase, acetylcholine, α -glucosidase and tyrosinase as well as for the identification of the
biomarkers. The results pointed to the possible adulteration of one of the tested products related to the
absence of two rosavins, the most important quality markers of R. rosea.
© 2021 Maria Curie-Sklodowska University. Published by Elsevier B.V.
This is an open access article under the CC BY-NC-ND license
( />
1. Introduction
Rhodiola rosea L. (R. rosea) is a commonly known herbal drug
with a long history of using in several traditional healing systems,
such as Traditional Chinese Medicine. R. rosea has received the attention as an adaptogenic and ergogenic agent and has been used
for various medical purposes linked to acute and chronic stress, including physical performance. Herbal products containing the root
and/or rhizome of R. rosea are widely available on the European
market, mainly as so-called food supplements. These products have
to be proved for their quality, efficacy and safety prior to gaining
access to the market. Unfortunately, most of the supplements are
sold without any registration via Internet. The European Pharmacopoeia focuses on authenticity standardization of R. rosea prod-
∗
Corresponding author.
E-mail address: (I.M. Choma).
ucts based on a ratio of marker compounds i.e. salidroside and
rosavins, which should equals 1:3. In many cases the level of markers is too low what can be related to adulterations. It especially
concerns rosavins. However, the absence of rosavins may not always be an indicative for falsification. Enzymatic degradation of
rosavins can be caused by improper harvesting or processing of
the plant material. Another concern regarding the authenticity of
R. rosea is the admixture of root and/or rhizome from other Rhodiola species. In the European herbal supplement industry, R. rosea
raw material from Asia is often mixed with other Rhodiola species,
for example R. crenulata. Taking into account the above mentioned
facts, the R. rosea supplements may carry a high risk potential due
to insufficient definition, problems with identity, purity and falsifications [1–3].
According to the literature, R. rosea is rich in polyphenols,
flavonoids, proanthocyanidies, phenolic glycosides, organic acids,
sugars, tannins, terpenes and essential oils [4,5]. The plant contains
also so-called marker compounds characteristic for this species:
/>0021-9673/© 2021 Maria Curie-Sklodowska University. Published by Elsevier B.V. This is an open access article under the CC BY-NC-ND license
( />
H. Nikolaichuk, R. Typek, S. Gnat et al.
Journal of Chromatography A 1649 (2021) 462217
phenylpropanoids (rosavin, rosin, rosarin – the group of rosavins)
and phenylethanoids (salidroside, viridoside and p-tyrosol). The
adaptogenic properties of R. rosea are mostly related to the presence of these marker compounds [6,7], while antioxidant activity
mainly to organic acids and flavonoids.
Effect-directed analysis (EDA) based on planar chromatography
allows for screening of bioactive compounds in complex matrices
and identification of the type and structure of distinguishing substances. The separation, bioassays and visualization are performed
directly on a TLC plate for many samples in parallel, which allows
comparing them as well as the target and/or non-target detecting
compounds responsible for the bioactive response [8]. This effectdirected detection (EDD) step of EDA, followed by spectroscopic
identification gives full information on both structure and bioactivity of the sample constituents.
The aim of the paper is the investigation of authenticity, possible adulteration and bioactivity of two R. rosea preparations, available on the market in Europe, using TLC-fingerprints and EDA. The
bioprofiling of antioxidants and antibacterials as well as inhibitors
of lipase, acetylcholinesterase, α -glucosidase and tyrosinase, combined with TLC-UV-VIS, followed by TLC micro-fractionation and
HPLC-ESI-MS was performed to provide information about the
presence of marker and authenticity constituents such as salidroside, p-tyrosol and rosavins known for their therapeutic efficacy.
Additionally, for comparison, TLC fingerprinting, bioprofiling and
HPLC-ESI-MS of the R. rosea reference standard was performed.
2.3. Planar chromatography
The samples (plant extracts and standards) were applied as 8
mm bands (10 mm from the lower and left edge, at the distance of
13 mm between tracks) on TLC plates (silica gel 60 F254 , 20 × 10
cm, 1.05715.0 0 01, Merck, Germany) using the automatic TLC applicator Linomat 5 (Camag, Switzerland). The application volume
was 5 μL. TLC separation was carried out with ethyl acetatemethanol-water 77:13:10 (v/v/v) as a mobile phase in the DS sandwich chamber (Chromdes, Poland) up to the migration distance of
8 cm. After separation, chromatograms were dried on air. Then,
dry chromatograms were documented at UV 254 nm, UV 366 nm
and white light illumination (at a reflectance mode) using Visualiser with DigiStore 2 Documentation System, VideoScan 1.1 and
winCATS 1.4.7 software (Camag, Switzerland). The chromatograms
were derivatized by automatic piezoelectric spraying (TLC Derivatizer for 20 × 10 cm plates, Camag, Switzerland). The blanks control was done to screen false positive results.
2.4. Dot-blot
The samples (plant extracts and standards) were applied manually on the TLC plate silica gel 60 F254 (20 × 10 cm, 1.05715.0 0 01,
Merck, Germany) in 5 μL volume using microsyringe (Hamilton,
Switzerland). After application the plates were documented at UV
254 nm and UV 366 nm using Visualiser and subjected to bioassays.
2. Material and methods
2.5. Derivatization
2.1. Reagents
2.5.1. AS reagent
The chromatogram was derivatized with 4 mL of panisaldehyde sulfuric acid reagent (0.5 mL of p-anisaldehyde
was dissolved in 85 mL of methanol, then 10 mL of acetic acid
and 5 mL of sulfuric acid were added) by automatic piezoelectric
spraying (red nozzle, speed 6). After that, the plate was heated
on the TLC Heater (Camag, Switzerland) at 105°C for 7 min and
documented at VIS and UV 366 nm light using the Visualiser [9].
All reagents were of the analytical grade. Acetone, acetic acid,
ethanol, ethyl acetate, methanol, o-phosphoric acid, sodium hydroxide, sulfuric acid, phosphomolybdic acid (PMA), 2-isopropyl5-methyl-phenol (thymol), p-aminobenzoic acid (PABA), diphenylboryloxyethylamine (NP), polyethylene glycol – 40 0 0 (PEG40 0 0) sodium acetate buffer and phosphate buffer were from
POCH (Poland). p-Anisaldehyde (AS), bromocresol green (BCG),
2,2-diphenyl-1-picrylhydrazyl (DPPH), 2-naphthyl acetate, bovine
serum albumin (BSA), acetylocholinesterase (AChE) from Electrophorus electricus, Fast Blue B salt, TRIS buffer, 2-naphthyl α D glucopyranoside, α -glucosidase from Saccaromyces, 1-naphthyl
acetate, lipase from Porcine pancreas, L-DOPA, Triton X, tyrosinase from mushroom, 3-(4,5-dimethyldiazol-2-yl)-2,5 diphenyltetrazolium bromide (MTT) dye, Hepes buffer, rosavin, salidroside,
p-tyrosol, hydroquinone, caffeic acid, chlorogenic acid, ferulic acid,
gallic acid, luteolin, saccharose, glucose and galactose were purchased from Sigma Aldrich (Poland). Mueller-Hinton (M-H) agar
and M-H broth were purchased from Biocorp (Warsaw, Poland).
The Gram-positive bacteria, Bacillus subtilis (ATCC 6633) were from
American Type Culture Collections. Pure water was from Milipore
Q system (Millipore, Bedford, MA, USA).
2.5.2. PMA reagent
The chromatogram was derivatized with 4 mL of PMA reagent
(20 g of phosphomolybdic acid dissolved in 100 mL of ethanol) by
automatic piezoelectric spraying (blue nozzle, speed 6). After that,
the plate was heated at 100°C for 5 min and documented at VIS
light using the Visualiser [9].
2.5.3. Thymol reagent
The chromatogram was sprayed with 4 mL of thymol (0.5 g)
solution in 95 mL of ethanol and 5 mL of sulfuric acid by automatic
piezoelectric spraying (red nozzle, speed 6). After that, the plate
was heated at 120°C for 15 min and documented at VIS light and
UV 366 nm using the Visualiser [9].
2.5.4. PABA reagent
The chromatogram was sprayed with 4 mL of PABA reagent (0.5
g of p-aminobenzoic acid dissolved in 18 mL of glacial acetic acid
diluted with 20 mL of water, then added 60 mL of acetone and 1
mL of o-phosphoric acid) by automatic piezoelectric spraying (red
nozzle, speed 6). After that, the plate was heated at 140°C for 5
min and documented at VIS light and UV 366 nm using the Visualiser [10].
2.2. Sample preparation
Two samples of R. rosea diet supplements were purchased from
NatVita, Poland (dry root and rhizome) and Fushi, Great Britain
(dry root) while the United States Pharmacopeia (USP) reference
standard of R. rosea (dry root and rhizome) from Sigma Aldrich.
The samples were macerated in 70% methanol (1 g per 10 ml) for
72 h in the darkness at room temperature, then filtered through
a paper filter. After filtration, extracts were used for TLC application. The standards of rosavin, salidroside, p-tyrosol, hydroquinone,
caffeic acid, chlorogenic acid, ferulic acid, gallic acid, luteolin, saccharose, glucose and galactose were dissolved in methanol at the
concentration of 1 mg mL−1 . All samples were stored at -8°C.
2.5.5. BCG reagent
The chromatogram was derivatized with 4 mL of BCG solution
(40 mg BCG dissolved in 100 mL of ethanol and 5 mL of 0.1 M
NaOH) by automatic piezoelectric spraying (green nozzle, speed 6).
2
H. Nikolaichuk, R. Typek, S. Gnat et al.
Journal of Chromatography A 1649 (2021) 462217
After that, chromatogram was documented at VIS light using the
Visualiser [9].
2.6.5. Tyrosinase assay
The chromatogram was sprayed with 2.5 mL of substrate solution (0.1183 g of L-DOPA diluted in 49.5 mL of 0.02 M phosphate
buffer pH 6.8 and 0.5 mL of Triton X) by automatic piezoelectric
spraying (red nozzle, speed 6). Subsequently, the plate was sprayed
with 3.0 mL of enzyme solution (400 units of tyrosinase in 1 mL of
0.02 M phosphate buffer, pH 6.8) (red nozzle, speed 6). After that,
the plate was incubated for 10 min at room temperature in the
closed vessel in humid atmosphere. Tyrosinase inhibitors appeared
as white bands against grey background. Results were documented
at VIS light [15].
2.5.6. NP-PEG reagent
The chromatogram was sprayed with 4 mL of the NP solution
(1 g of NP dissolved in 100 mL of methanol) followed by 4 mL
PEG solution (5 g of PEG-40 0 0 dissolved in 10 0 mL of ethanol) by
automatic piezoelectric spraying (red nozzle, speed 6). After that,
chromatogram was documented at UV 366 nm light using the Visualiser [9].
2.6.6. Bacillus subtilis bioassay
The chromatogram was immersed for 8 s in the bacterial suspension (8.0 × 10⁷ CFU mL−1 ) using the TLC Immersion Device
(Camag, Switzerland). Then, the plate was placed in a plastic box
lined with the wetted paper and incubated at 37°C for 17 h. The
bioautogram was sprayed with visualization solution (0.2 % of
MTT aqueous solution with one drop of Triton X-100). After reincubation at 37°C for 0.5 h, white zones of bacterial growth inhibition were visible against the purple background. The bioautogram was documented at VIS light [16].
2.6. Effect directed detections
2.6.1. DPPH assay
The chromatogram was sprayed with 4 mL of 0.2 % DPPH solution in methanol by automatic piezoelectric spraying (blue nozzle,
speed 6). Results were observed after 30 min at VIS light. Radical
scavengers appeared as white bands against the purple background
[11].
2.6.2. AChE assay
The chromatogram was sprayed with 4 mL of substrate solution (150 mg of 2-naphthyl acetate solution dissolved in 50 mL of
ethanol) by automatic piezoelectric spraying (green nozzle, speed
6). After that, the plate was dried with a stream of cold air. Subsequently the plate was sprayed with 4 mL of the enzyme solution
(20 units of AChE and 150 mg of BSA in 150 mL of 0.05 M TRIS
buffer, pH 7.8) (red nozzle, speed 6). The plate was incubated horizontally in the humid atmosphere in a closed vessel at 37°C for
20 min. After incubation, the plate was sprayed with 2 mL of visualization solution (50 mg of Fast Blue B salt diluted in 100 mL of
water) (blue nozzle, 6 speed). AChE inhibitors appeared as white
bands against the purple background. Results were documented at
VIS light [12].
2.7. Micro-preparative analysis
The extracts (80 μL each) of the USP standard, NatVita and
Fushi were applied as 8 cm band on the analytical TLC plate
and separated into fractions with ethyl acetate-methanol-water
77:13:10 (v/v/v). The fractions were scraped, placed in the Eppendorf tubes and eluted with 2200 μL of methanol. After filtration
through the paper filter, the eluates were concentrated by evaporation of the solvent under a stream of nitrogen to dryness and reconstituted with 200 μL of methanol. Then, the fractions (Table 1S;
Fig. 1S) and the standards were subjected to HPLC-ESI-MS analysis
in negative ionization mode.
2.8. Mass spectrometry
2.6.3. α -Glucosidase assay
The chromatogram was sprayed with 2 mL of substrate solution
(60 mg of 2-naphthyl α - D glucopyranoside in 50 mL of ethanol)
by automatic piezoelectric spraying (green nozzle, speed 6) and
subsequently dried for removing ethanol using a stream of cold air.
Subsequently. the plate was sprayed with 4 mL of enzyme solution
(500 units of α -glucosidase in 50 mL of sodium acetate buffer pH
7.5) (red nozzle, 6 speed). After spraying, the plate was incubated
horizontally in the humid atmosphere in a closed vessel at 37°C
for 10 min. After incubation the plate was sprayed with 0.5 mL of
visualization solution (10 mg Fast Blue B salt diluted in 10 mL of
water) (blue nozzle, speed 6). α -Glucosidase inhibitors appeared
as white bands against the purple background. Results were documented at VIS light [13].
The HPLC-MS analysis was performed using the HPLC-MS system composed of the UHPLC chromatograph (UltiMate 30 0 0,
Dionex, Sunnyvale, CA, USA), the linear trap quadrupole-Orbitrap
mass spectrometer (LTQ-Orbitrap Velos, Thermo Fisher Scientific,
San Jose, CA), the ESI ionization source operating in the negative
polarization mode at the needle potential equal 4.5 kV. Nitrogen
(> 99.98%) was used as a sheath gas - 40 arbitrary units, an auxiliary gas - 10 arbitrary units, a sweep gas - 10 arbitrary units; capillary temperature equals 320°C. The scan cycle used a full-scan
event at the resolution of 60.0 0 0. For chromatographic separation
Gemini C18 column (4.6 × 100 mm, 3 μm; Phenomenex, USA) was
used. Mobile phase components were: A - 25 mM formic acid in
water and B - 25 mM formic acid in acetonitrile. The gradient program started at 5% B increasing to 95% for 60 min and was followed by isocratic elution (95% B) for 10 min. The total run time
was 70 min at the mobile phase flow rate 0.5 mL min−1 . The MS
spectra were continuously collected in the range of 100-1000 m/z
at 50 ms scan rate in the course of each run.
2.6.4. Lipase assay
The chromatogram was sprayed with 3 mL of substrate solution (150 mg of 1-naphthyl acetate in 100 mL ethanol) by automatic piezoelectric spraying (green nozzle, 6 speed) and dried using a stream of cold air to remove ethanol. After that, the plate was
sprayed with 4 mL of enzyme solution (500 units of lipase and 50
mg of BSA in 50 mL of 0.05 M TRIS-HCl buffer pH 7.4) (red nozzle,
speed 6). Then, the plate was incubated in the humid atmosphere
in a closed vessel at 37°C for 20 min. After incubation the plate
was sprayed with 2 mL of visualization solution (50 mg of Fast
Blue B salt in 100 mL of water) (blue nozzle, 6 speed). Lipase inhibitors appeared as white bands against the purple background.
Results were documented at VIS light [14].
2.9. TLC densitometry
Densitometric scans were performed using TLC Scanner version
4 (Camag, Switzerland). The spot dimensions were 4 × 0.3 mm,
scanning speed was 20 mm s−1 , and data resolution was 100 μm
per step. Spectral detection was performed in the range of 200–
700 nm with scanning speed 100 nm s−1 and data resolution 1 nm
per step. Both operations were under control of Camag WinCATS
version 1.4.9 Software.
3
H. Nikolaichuk, R. Typek, S. Gnat et al.
Journal of Chromatography A 1649 (2021) 462217
Table 1
HPLC-ESI-MS results for USP standard, Fushi and NatVita samples. Negative ionization mode.
F1-F7 micro-preparative fractions (see the Supplementary material Fig. 1S and Table 1S).
Compounds
∗
Rosavin
Rosarin
Rosin
∗
Salidroside
∗
p-Tyrosol
Viridoside
Galactose
∗
Saccharose
∗
Glucose
∗
Caffeic acid
∗
Chlorogenic acid
∗
Ferulic acid
∗
Gallic acid
Cinnamyl alcohol
Kaempferol
Luteolin-7-O-Glc
∗
Luteolin
Apigenin-7-Glc
Herbacetin
Rhodiosin
Rhodionin
Rhodioflavonoside
Gossypetin -7-O-rhamnopyranoside
∗
Hydroquinone
Molecular
formula
Theoretical
monoisotopic
ion mass [Da]
Measured
monoisotopic
ion mass [Da]
Mass
accuracy
[ ppm]
USP
standard
NatVita
Fushi
C20 H27 O10
C20 H27 O10
C15 H19 O6
C14 H19 O7
C8 H9 O2
C15 H21 O7
C6 H11 O6
C12 H21 O11
C6 H12 O6
C9 H7 O4
C16 H17 O9
C10 H9 O4
C7 H5 O5
C9 H9 O
C15 H9 O6
C21 H19 O11
C15 H9 O6
C21 H19 O10
C15 H9 O7
C27 H29 O16
C21 H19 O11
C27 H29 O17
C21 H19 O12
C6 H5 O2
427.16043
427.16043
295.11817
299.11308
137.06025
313.12873
179.05557
341.10839
179.05557
179.03444
353.08726
193.05009
169.01370
133.06534
285.03992
447.09274
285.03992
431.09783
301.03483
609.14557
447.09274
625.14048
463.08766
109.02896
427.16044
427.16049
295.11818
299.11310
137.06022
313.12882
179.05552
341.10843
179.05559
179.03437
353.08741
193.05009
169.01366
133.06529
285.03999
447.09271
285.03998
431.09780
301.03489
609.14556
447.09284
625.14049
463.08772
109.02894
0.03
0.15
0.05
0.07
0.23
0.29
0.25
0.12
0.13
0.36
0.42
0.02
0.24
0.38
0.26
0.07
0.23
0.06
0.20
0.02
0.22
0.02
0.14
0.10
F2
F2
F5
F4
F6
F4
F1
F2
F1
F6
F2
F6
F6
F6
F5
F4
F5
F4
F7
F2
F3
F2
F3
F6
F2
F2
F4
F4
F6
F3
F1
F1
F1
F6
F2
F6
F6
F7
F5
F4
F5
F4
F6
F2
F4
F2
F3
F6
NI
NI
F4
F4
F6
F3
F1
F2
F1
F6
F2
F6
F6
F7
F5
F4
F5
F4
F6
F2
F4
F2
F2
F6
F3
F3
F7
F2
F3
F2
F3
F7
F7
F6
F5
F6
F3
F4
F3
F7
F3
F3
F5
F7
F4
F2
F2 F3
F2
F3
F7
F6
F5
F6
F7
F3
F3
F7
F5
F7
F4
F2
F3
F2
F3
F7
F6
F5
F6
F7
F3
F3
F3
F7
NI - not identified
∗
The standards subjected to HPLC-ESI-MS analysis
3. Results and discussion
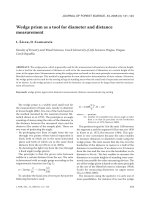
tected by BCG test at the start position) and polyphenols (revealed
by NP-PEG reagent) in all R. rosea extracts (Fig. 1). In particular,
saccharose, glucose and galactose were detected using thymol test
as brown bands at hRf 27, 36 and 31, respectively (Fig. 2). According to the literature [5], R. rosea contains phenolic acids including
caffeic, chlorogenic, ferulic and gallic acids with strong antioxidant
properties. In the NP-PEG test (Fig. 2) the standards of caffeic (hRf
67), chlorogenic (hRf 18), ferulic (hRf 68) and gallic (hRf 64) acids
were detected, however their presence in the extracts of R. rosea
couldn’t be confirmed, probably because of too low sensitivity of
TLC-NP-PEG test. Finally, DPPH test (Fig. 2) was done which confirmed antioxidant properties of the aforementioned acids. However, it was impossible to detect them unequivocally in the extracts. The bioassays, including DPPH, are discussed in more detail
in the next paragraph.
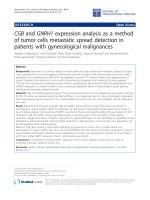
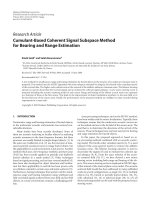
3.1. TLC fingerprints combined with TLC-UV-VIS
The preliminary experiments were focused on comparing fingerprints of two supplements of R. rosea: NatVita and Fushi in reference to the USP standard. The UV, micro-chemical (derivatization) and biological (EDD) profiles were compared, revealing their
differentiations (Fig. 1). The differences are already seen on the
chromatograms at UV 254 and 366 nm. The distinctive fingerprints
are revealed by most of the derivatization procedures – generally,
NatVita gives more sophisicated fingerprints similar to those obtained for the USP standard (Fig. 1).
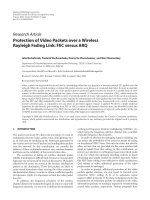
The major bioactive compounds of R. rosea, i.e. rosavin, salidroside and p-tyrosol, are often used for the quality evaluation of R.
rosea preparations [15,17,24]. After derivatization with AS reagent,
standards of rosavin, salidroside and p-tyrosol were detected as
color bands at hRf 24 - rosavin (violet), at hRf 47 - salidroside
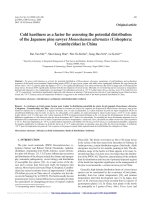
(green brown) and at hRf 78 - p-tyrosol (brown) (Fig. 2). The presence of rosavin was confirmed by the AS test both in the USP standard and the NatVita extracts (Fig. 2). However, this spot was missing in the Fushi extract. To check the possible presence of rosavin
in the extracts, UV-VIS spectra were taken using TLC densitometry
(Fig. 3). The obtained spectra confirmed the presence of rosavin in
the NatVita extract and the USP standard (overlapped spectra of
rosavin standard and related to it compound both in the NatVita
and the USP extracts, taken at the same hRf value i.e. 24). The
spectrum obtained for the band at hRf 24 of the Fushi extract was
different from that of rosavin. The results pointed to the absence
of rosavin in the Fushi sample, which may suggest the adulteration
of this supplement or improper manufacturing procedures [1,2].
The presence of the salidroside and p-tyrosol in the extracts
was hard to confirm using derivatization tests due to low intensity of the spots, what can be related to their low content in the
extracts. Additionally, the derivatization tests pointed to the presence of sugars (detected using thymol and PABA tests), acids (de-
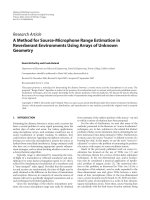
3.2. EDD - TLC bioactivity assays
The main experiments focused on biological properties of two
R. rosea preparations which were investigated using EDD that is
TLC-bioactivity assays. The bioassays were performed both for the
extracts and the standards (marker constituents - rosavin, salidroside, p-tyrosol and hydroquinone). The antioxidants, enzyme inhibitors and antimicrobials were revealed on bioautograms as
bright zones. The biological assays were performed both on the developed (Fig. 4) and not developed plates ( the dot-blots, Fig. 2S).
The dot-blots gave general information on biological properties of
the standards and of the whole, non-separated samples taking into
account possible synergistic or antagonistic effects in the plant
extracts. Table 2S contains detailed information on the bioactive
zones found in R. rosea extracts and those of the standards.
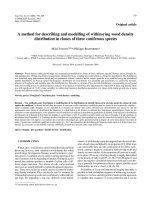
The DPPH assay showed antioxidative activities (Fig. 4) of all
three R. rosea extracts and standards of salidroside, p-tyrosol and
hydroquinone. The extract of Fushi had stronger antioxidant activity comparing to the NatVita and the USP standard ones. The standards of salidroside (hRf 47) and p-tyrosol (hRf 78) revealed rather
4
H. Nikolaichuk, R. Typek, S. Gnat et al.
Journal of Chromatography A 1649 (2021) 462217
Fig. 1. TLC chromatograms of the R. rosea extracts (USP standard, Natvita, Fushi).
weak antioxidant activity. These bands are also slightly seen at the
bioautograms of plant extracts. Rosavin had no antioxidant properties, which were confirmed also by the dot-blot test (Fig. 2S).
Strong antioxidative properties of R. rosea may play an essential
role in the adaptogenic, anti-aging and antifatigue activities of the
plant [17].
Based on the cholinergic hypothesis, AChE inhibitors may be
used in the Alzhemer‘s disease treatment [12]. Several studies
of R. rosea pointed out salidroside, p-tyrosol, gossypetin-7-O-Lrhamnopyranoside and rosarin as potential AChE inhibitors [18–
20]. Bioautogram of the USP standard extract revealed two bands
of AChE inhibition: at hRf 76 and 90. However, only single white
bands at hRf 80 were detected on AChE bioautograms of both
NatVita and Fushi extracts (Fig. 4). Among standards, only hydroquinone showed AChE inhibition. It was also confirmed by the dotblots (Fig. 2S). All R. rosea extracts showed weak anti-AChE activity in the dot-blot. The detection of inhibitors in the extracts was
disturbed by interfering brown zones seen on AChE bioautograms
(Figs. 4, 2S).
α -Glucosidase enzyme inhibitors are potential drugs in the
therapy of the type 2 diabetes. According to the literature, R. rosea
can be considered as a drug for the diabetes treatment [17]. However, the investigated herb samples revealed only a few slightly
visible white bands of α -glucosidase inhibition, probably related
5
H. Nikolaichuk, R. Typek, S. Gnat et al.
Journal of Chromatography A 1649 (2021) 462217
Fig. 2. TLC chromatograms of the R. rosea extracts: USP standard (USP), NatVita (N) and Fushi (F) and standards: rosavin (R), salidroside (S), p-tyrosol (T), hydroquinone (H),
galactose (Gal), saccharose (Sac), glucose (Glu), caffeic acid (Ca), chlorogenic acid (Ch), ferulic acid (Fe), gallic acid (Ga).
tected as wide zones in NP-PEG and DPPH tests, Fig. 2) [21].
However, the reaction of polyphenols, leading to the emergence
of brown zone, was not observed in the lipase assay, where the
Fast Blue B salt was also used as a visualization solution. This effect should be further investigated. This problem does not concern
standards: rosavin, salidroside, p-tyrosol and hydroquinone were
seen as bright zones in the α -glucosidase assay. In the dot-blot test
(Fig. 2S) bright inhibition zones were visible both for the R. rosea
extracts as well as for standards.
Lipase inhibitors could be effective in the treatment of obesity. According to the literature, R. rosea and p-tyrosol may prevent
obesity [17,22]. The lipase assay resulted in bright zones of inhibition in all three extracts of R. rosea (Fig. 4). The Fushi extract
revealed stronger anti-lipase activity then that of the USP standard and NatVita extracts. The standards, except hydroquinone, had
weak inhibition activities better visible in the lipase dot-blot assay
(Fig. 2S). Hydroquinone showed strong anti-lipase activity.
Tyrosinase inhibitors may be useful as skin whitening agents
in cosmetics and for treatment of some skin disorders related to
melanin hyperpigmentation [17]. The all three R. rosea extracts
and rosavin revealed tyrosinase inhibition (Fig. 4). Besides bright
zones of the tyrosinase inhibition also dark bands were observed
on bioautograms, what could be related to the enhancing tyrosinase activity. Bright bands related to rosavin and hydroquinone
proved their inhibition property (Figs. 4, 2S). The salidroside and
p-tyrosol were observed on bioautograms as dark bands. These results are in contrast with those reported by Wen who observed
tyrosinase inhibition effect of salidroside and p-tyrosol [23].
The antibacterial activity against Bacillus subtilis was revealed
both in three analyzed extracts and standards, with exception of
p-tyrosol (Figs. 4, 2S). The antibacterial zones are visible at hRf
ranges of 0 – 20, 0 – 20 and 0 – 25 for the USP standard,
NatVita and Fushi, respectively. Besides these wide-range antibacterial zones, three bands at hRf 25, 40 and 50 were detected for the
USP standard while two bands at hRf 45 and 70 were detected for
the NatVita and Fushi extracts. The rosavin and salidroside stan-
Fig. 3. The spectra of the rosavin standard (R) and corresponding to it zones in R.
rosea extracts: USP standards (USP), NatVita (N) and Fushi (F) at the same hRf value
i.e 24.
to the marker compounds: rosavin, salidroside and tyrosol (Fig. 4).
The inhibition zones of α -glucosidase are partially masked by
brown zones at hRf range from 0 to about 65 in the tracks of
all extracts. The brown zones, already observed in the AChE assay, may be the effect of reaction between the Fast Blue B salt
reagent applied as a visualization solution and polyphenols (de-
Fig. 4. TLC bioautograms of the R. rosea extracts: USP standard (USP), NatVita (N) and Fushi (F) and standards: rosavin (R), salidroside (S), p-tyrosol (T), hydroquinone (H).
6
H. Nikolaichuk, R. Typek, S. Gnat et al.
Journal of Chromatography A 1649 (2021) 462217
dards showed weak antimicrobial activity, while hydroquinone –
very strong.
Supplementary materials
Supplementary material associated with this article can be
found, in the online version, at doi:10.1016/j.chroma.2021.462217.
3.3. Detection of the target compounds in Rhodiola rosea L. by
HPLC-ESI-MS
CRediT authorship contribution statement
The HPLC-ESI-MS technique was used for identification of the
target compounds in the R. rosea extracts in the fractions with
biological activity. Table 1 lists compounds, their molecular formulas, measured and teoretical monoisotopic masses as well as
mass differences in parts per million (ppm) and the fractions in
which a given compound was found. The HPLC-ESI-MS analysis of
the fractions provided information on twenty four constituents of
the analyzed extracts detected in seven fractions. In NatVita and
the USP standard extracts three phenylpropanoids were identified
– rosavin (F2, F3), rosarin (F2, F3) and rosin (F4, F5), although in
the Fushi extract - only rosin (F4, F5). This is another evidence (besides TLC-bioprofiling and TLC-UV-VIS) of possible adulteration of
the Fushi supplement. The presence of salidroside (F4), viridoside
(F3, F4) and p-tyrosol (F6, F7) was confirmed in all three R. rosea
extracts. The saccharose, glucose and galactose were detected in
the NatVita (F1, F2, F3), Fushi (F1, F2, F3) and USP standard (F1,
F2, F3) extracts. The presence of phenolic acids was confirmed by
the standards of caffeic (F6), chlorogenic (F2, F3), ferulic (F6, F7)
and gallic (F6) acids also in all three R. rosea extracts. The HPLCESI-MS analysis identified also herbacetin (F6, F7), rhodioflavonoside (F2, F3), rhodiosin (F2, F3), rhodionin (F3, F4), gossypetin-7-Orhamnopyranoside (F2, F3), cinnamyl alcohol (F6, F7), kaempferol
(F5, F6), luteolin-7-O-Glc (F4, F5), luteolin (F5, F6), apigenin-7-Glc
(F4) and hydroquinone (F6, F7) in all three R. rosea samples. In vitro
and in vivo studies showed that herbacetin exerts an unspecific effect on membranes and enzyme activities linked to cancer progression [24]. Gossypetin-7-O-rhamnopyranoside and rhodioflavonoside are compouds with antibacterial and anticancer activity [6].
Hydroquinone shows strong anti-AChE activity [7]. Herbacetin, rhodiosin, rhodionin, cinnamyl alcohol, kaempferol, luteolin-7-O-Glc,
luteolin and apigenin-7-Glc are polyphenol compounds with strong
antioxidant properties [5,24].
Hanna Nikolaichuk: Conceptualization, Methodology, Investigation, Writing – original draft, Writing – review & editing.
Rafał Typek: Investigation. Sebastian Gnat: Investigation. Marek
Studzinski:
Investigation. Irena Maria Choma: Supervision, Con´
ceptualization, Writing – original draft, Writing – review & editing.
References
[1] B.E. Bejar, R. Upton, H. John, Adulteration of Rhodiola (Rhodiola rosea) rhizome
and root and extracts, Bot. Adulterants Bull. (2017) 1–8.
[2] A. Booker, B. Jalil, D. Frommenwiler, E. Reich, L. Zhai, Z. Kulic, M. Heinrich, The
authenticity and quality of Rhodiola rosea products, Phytomedicine 23 (2016)
754–762, doi:10.1016/j.phymed.2015.10.006.
[3] R. Bauer, G. Franz, Modern European monographs for quality control of Chinese
herbs, Planta Med. 76 (2010) 2004–2011, doi:10.1055/s- 0030- 1250532.
[4] G.S. Kelly, Rhodiola rosea: a possible plant adaptogen, Altern. Med. Rev. 6
(2001) 293–302.
[5] A. Panossian, G. Wikman, J. Sarris, Rosenroot (Rhodiola rosea): Traditional use,
chemical composition, pharmacology and clinical efficacy, Phytomedicine 17
(2010) 481–493, doi:10.1016/j.phymed.2010.02.002.
[6] D.S. Ming, B.J. Hillhouse, E.S. Guns, A. Eberding, S. Xie, S. Vimalanathan,
G.H.N. Towers, Bioactive compounds from Rhodiola rosea (Crassulaceae),
Phyther. Res. 19 (2005) 740–743, doi:10.1002/ptr.1597.
[7] Y.C. Ma, X.Q. Wang, F.F. Hou, J. Ma, M. Luo, S. Lu, P. Jin, N. Terevsky,
A. Chen, I. Xu, A.V. Patel, D. Gorecki, Rapid Resolution Liquid Chromatography (RRLC) analysis for quality control of Rhodiola rosea roots and
commercial standardized products, Nat. Prod. Commun. 6 (2011) 645–650
× 110 060 0515.
[8] I. Choma, W. JesionekC.F. Poole (Ed.), Effects-directed biological detection:
bioautography, Instrum. Thin-Layer Chromatogr. (2015) 279–312, doi:10.1016/
B978- 0- 12- 417223- 4.0 0 011-X.
[9] H. Wagner, S. Bladt, Plat Drug Analysis: A Thin Layer Chromatography, Second
Edition, Altlas, 2001.
[10] Á.M. Móricz, T.T. Häbe, P.G. Ott, G.E. Morlock, Comparison of high-performance
thin-layer with overpressured layer chromatography combined with direct
bioautography and direct analysis in real time mass spectrometry for tansy
root, J. Chromatogr. A 1603 (2019) 355–360, doi:10.1016/j.chroma.2019.03.068.
[11] A. Marston, Thin-layer chromatography with biological detection in phytochemistry, J. Chromatogr. A 1218 (2011) 2676–2683, doi:10.1016/j.chroma.2010.
12.068.
[12] Y. Zhongduo, Z. Xu, D. Dongzhu, S. Zhuwen, Y. Mingjun, L. Shuo, Modified TLC
bioautographic method for screening acetylcholinesterase inhibitors from plant
extracts, J. Sep. Sci. 32 (2009) 3257–3259, doi:10.1002/jssc.200900266.
[13] M. Jamshidi-Aidji, J. Macho, M.B. Mueller, G.E. Morlock, Effect-directed profiling of aqueous, fermented plant preparations via high-performance thin-layer
chromatography combined with in situ assays and high-resolution mass spectrometry, J. Liq. Chromatogr. Relat. Technol. 42 (2019) 266–273, doi:10.1080/
10826076.2019.1585631.
[14] A.M.S. Hassan, TLC bioautographic method for detecting lipase inhibitors, Phytochem. Anal. 23 (2012) 405–407, doi:10.1002/pca.1372.
[15] J. Taibon, A. Ankli, S. Schwaiger, C. Magnenat, V.I. Boka, C. Simões-Pires, N. Aligiannis, M. Cuendet, A.L. Skaltsounis, E. Reich, H. Stuppner, Prevention of
false-positive results: development of an HPTLC autographic assay for the
detection of natural tyrosinase inhibitors, Planta Med. 81 (2015) 1198–1204,
doi:10.1055/s- 0035- 1546250.
[16] E.M. Grzelak, B. Majer-Dziedzic, I.M. Choma, K.M. Pilorz, Development of a
novel direct bioautography-thin-layer chromatography test: optimization of
growth conditions for gram-positive bacteria, Bacillus subtilis, J. AOAC Int. 96
(2013) 386–391, doi:10.5740/jaoacint.11-466.
[17] H.M. Chiang, H.C. Chen, C.S. Wu, P.Y. Wu, K.C. Wen, Rhodiola plants: chemistry
and biological activity, J. Food Drug Anal. 23 (2015) 359–369, doi:10.1016/j.jfda.
2015.04.007.
[18] S.F. Nabavi, N. Braidy, I.E. Orhan, A. Badiee, M. Daglia, S.M. Nabavi, Rhodiola
rosea L. and Alzheimer’s disease: from farm to pharmacy, Phyther. Res. 30
(2016) 532–539, doi:10.1002/ptr.5569.
[19] W. Zhuang, L. Yue, X. Dang, F. Chen, Y. Gong, X. Lin, Y. Luo, Rosenroot (Rhodiola): potential applications in aging-related diseases, Aging Dis. 10 (2019) 134–
146, doi:10.14336/AD.2018.0511.
[20] B.J. Hillhouse, D.S. Ming, C.J. French, G.H.N. Towers, Acetylcholine esterase
inhibitors in Rhodiola rosea, Pharm. Biol. 42 (2004) 68–72, doi:10.1080/
13880200490505636.
´ A. Stochmal, W. Oleszek, M. Waksmundzka-Hajnos, Low[21] Ł. Cies´ la, J. Kryszen,
temperature thin-layer chromatography preliminary bioautographic tests for
detection of free radical scavengers and acetylcholinesterase inhibitors in
volatile samples, J. Planar Chromatogr. - Mod. TLC 25 (2012) 225–231, doi:10.
1556/JPC.25.2012.3.7.
4. Conclusions
The TLC fingerprinting and EDD followed by TLC-UV-VIS and
HPLC-ESI-MS are proved to be useful methods for defining authenticity, quality control, differentiation and possible adulterations of
herbal samples. The EDA of the supplements and the USP standard of Rhodiola rosea L. pointed to the adulteration of the Fushi
sample, what was related to the absence of rosavin and rosarin.
The absence of these rosavins could serve as an evidence of falsification or poor quality of the supplement, which questions its
authenticity. We believe that control and standardization of the
herb supplements is very important for understanding its activity
and for prevention of falsifications. The results revealed also biological activity of R. rosea preparation and the chosen standards.
The R. rosea extracts inhibit acetylcholinesterase, tyrosinase, lipase
and α -glucosidase and show antibacterial and antioxidant activity.
The rosavin standard show inhibition effect of α -glucosidase, tyrosinase and activity against Bacillus subtilis. The salidroside and
p-tyrosol standards are proved to be antioxidants as well as α glucosidase inhibitors. Additionally, salidroside shows antibacterial
activity against Bacillus subtilis.
Declaration of Competing Interest
The authors declare that they have no known competing financial interests or personal relationships that could have appeared to
influence the work reported in this paper.
7
H. Nikolaichuk, R. Typek, S. Gnat et al.
Journal of Chromatography A 1649 (2021) 462217
[22] O.H. Lee, Y.I. Kwon, E. Apostolidis, K. Shetty, Y.C. Kim, Rhodiola-induced inhibition of adipogenesis involves antioxidant enzyme response associated with
pentose phosphate pathway, Phyther. Res. 25 (2011) 106–115, doi:10.1002/ptr.
3236.
[23] K.C. Wen, C.S. Chang, Y.C. Chien, H.W. Wang, W.C. Wu, C.S. Wu, H.M. Chiang,
Tyrosol and its analogues inhibit alpha-melanocyte-stimulating hormone in-
duced melanogenesis, Int. J. Mol. Sci. 14 (2013) 23420–23440, doi:10.3390/
ijms141223420.
[24] Z. Péter Zomborszki, N. Kúsz, D. Csupor, W. Peschel, Rhodiosin and herbacetin
in Rhodiola rosea preparations: additional markers for quality control? Pharm.
Biol. 57 (2019) 295–305, doi:10.1080/13880209.2019.1577460.
8