Protein-protein interactions and reduced excluded volume increase dynamic binding capacity of dual salt systems in hydrophobic interaction chromatography
Bạn đang xem bản rút gọn của tài liệu. Xem và tải ngay bản đầy đủ của tài liệu tại đây (1.99 MB, 12 trang )
Journal of Chromatography A 1649 (2021) 462231
Contents lists available at ScienceDirect
Journal of Chromatography A
journal homepage: www.elsevier.com/locate/chroma
Protein-protein interactions and reduced excluded volume increase
dynamic binding capacity of dual salt systems in hydrophobic
interaction chromatography
Leo A. Jakob a, Beate Beyer a,b, Catarina Janeiro Ferreira b, Nico Lingg a,b, Alois Jungbauer a,b,∗,
Rupert Tscheließnig a
a
b
Department of Biotechnology, University of Natural Resources and Life Sciences, Vienna, Muthgasse 18, A-1190, Austria
Austrian Centre of Industrial Biotechnology, Muthgasse 18, Vienna A-1190, Austria
a r t i c l e
i n f o
Article history:
Received 28 February 2021
Revised 26 April 2021
Accepted 28 April 2021
Available online 7 May 2021
Keywords:
HIC
Mixed electrolytes
Dynamic binding capacities
Breakthrough curves
Adsorption isotherms
Self-avoiding random walk
a b s t r a c t
Deploying two salts in hydrophobic interaction chromatography can significantly increase dynamic binding capacities. Nevertheless, the mechanistic understanding of this phenomenon is lacking. Here, we investigate whether surface tension or ionic strength govern dynamic binding capacities of the chromatographic resin Toyopearl Butyl-650 M in dual salt systems. Small-angle X-ray scattering was employed to
analyze the model proteins and the protein-resin adduct in the respective dual salt systems. The dual
salt systems incorporate sodium citrate and a secondary sodium salt (acetate, sulfate, or phosphate). As
model proteins, we used lysozyme, GFP, and a monoclonal antibody (adalimumab).
Moreover, for the protein-resin adduct, we determined the model parameters of a self-avoiding random
walk model fitted into the pair density distribution function of the SAXS data. Ionic strength is more predictive for dynamic binding capacities in HIC dual salt systems than surface tension. However, dynamic
binding capacities still differ by up to 30 % between the investigated dual salt systems. The proteins
exhibit extensive protein-protein interactions in the studied dual salt HIC buffers. We found a correlation of protein-protein interactions with the well-known Hofmeister series. For systems with elevated
protein-protein interactions, adsorption isotherms deviate from Langmuirian behavior. This highlights the
importance of lateral protein-protein interactions in protein adsorption, where monomolecular protein
layers are usually assumed. SAXS analysis of the protein-resin adduct indicates an inverse correlation of
the binding capacity and the excluded volume parameter. This is indicative of the deposition of proteins
in the cavities of the stationary phase. We hypothesize that increasing protein-protein interactions allow
the formation of attractive clusters and multilayers in the cavities, respectively.
© 2021 The Author(s). Published by Elsevier B.V.
This is an open access article under the CC BY license ( />
1. Introduction
Senczuk et al. (2009) described the positive effect of so-called
dual salt buffer systems on dynamic binding capacities (DBC) in
hydrophobic interaction chromatography (HIC). Those dual salt systems showed increased dynamic binding capacities compared to a
single salt system [1] which has been confirmed by other groups
[2–4]. Hackemann et al. [5] has shown that dual salt systems
can either synergistically increase or decrease binding capacities
in adsorption isotherms. Altogether, a fundamental understanding
∗
Corresponding author at: Department of Biotechnology, University of Natural
Resources and Life Sciences, Vienna, Muthgasse 18, A-1190, Austria.
E-mail address: (A. Jungbauer).
of how two different buffers promote better binding than a single
one has not yet been provided. Commonly, a kosmotropic buffer is
added to the protein solution to promote binding. The addition of a
chaotropic salt would be counterintuitive according to the current
theory explaining the adsorption of proteins in HIC [6]. Both Müller
et al. [2] and Baumgartner et al. [3] postulated that mixing a kosmotropic salt for promoting binding to the hydrophobic stationary
phase surface and chaotropic salt, which is possibly increasing the
protein solubility, should be the preferred strategy when setting up
mixed salt buffer systems for chromatography. The current understanding is lacking a fundamental explanation of the mechanism.
The surface tension increment of the salt in the binding buffer
and the salting in and out properties govern the adsorption of proteins in HIC, as described in the solvophobic theory [6]. In gen-
/>0021-9673/© 2021 The Author(s). Published by Elsevier B.V. This is an open access article under the CC BY license ( />
L.A. Jakob, B. Beyer, C. Janeiro Ferreira et al.
Journal of Chromatography A 1649 (2021) 462231
eral, this theory describes the interaction behavior of a more polar solvent, in this case the mobile phase and a less polar solute,
the sample protein, by considering the changes in the system’s free
energy caused by the individual processes involved. The structural
forces of water formed by hydrogen bonding, in this context, represent a low energy state. In contrast, the water molecules near
the stationary phase’s hydrophobic surface are in an energetically
"loaded" state. The protein binding to the hydrophobic surface reduces the surface area in contact with the water molecules. The
energy released as a consequence of this can be described as a
function of the change in available free surface area A and the
surface tension of the mobile phase γ :
Energy =
A∗
γ
ing of the protein layer thickness [24] and binding conformations
[25] in chromatographic systems. In classical polymer chemistry,
SAXS experiments allow the characterization of polymers. Fractal
models can be used to describe linear and branched polymers,
characterizing the polymer’s inter-monomer conformational distribution. This includes several parameters, such as the excluded volume and the path length in-between the monomers [26] In this
work, we model the chromatographic resin as a self-avoiding random walk (SARW) with and without proteins bound. The resulting parameters are then interpreted to gain an understanding of
the binding topology. These experiments are performed with resin
slurries using a pipetting robot [27].
As model proteins for this study, a monoclonal antibody (adalimumab), lysozyme, and Green Fluorescent Protein (GFP) were
used, since they have previously been described in dual salt systems. Senczuk et al. postulated that their observations might be
due to specific interactions of the antibodies with the stationary
phase [1]. Lysozyme was first proposed by Müller et al. as an additional model protein for studying dual salt buffer systems. It has a
basic pI (10.7 [28]), similar to most monoclonal antibodies [2] and
adalimumab’s (7.9-9.1 [29]). GFP was added because of its acidic
range (pI = 5.8 [30]). Thus, if the claim of increased binding capacity with dual salt systems also holds for GFP, this would strongly
indicate that the pI of the sample protein does not influence stationary phase binding in mixed salt systems. Furthermore, the chosen model proteins differ significantly in regards to their molar
mass, having molar masses of 14.3 kDa (lysozyme [28]), 26.9 kDa
(GFP [30]) and 148 kDa (adalimumab [31]).
Ultimately, this study aims to identify whether surface tension
or ionic strength is the primary driving force for dynamic binding capacities in HIC. For that purpose, we prepared citrate buffers
containing a secondary salt (acetate, phosphate, or sulfate) and varied the concentrations of these salts to obtain buffers with identical surface tension. Dynamic binding capacities of a Toyopearl
Butyl-650M HIC column were determined for the systems with
identical surface tension. Similarly, we prepared buffers with more
or less the same ionic strength by variation of the citrate concentration. For those systems, the equilibrium and dynamic binding capacities were determined. SAXS was used to investigate the
impact on the model protein solution structure (such as the protein structure and protein-protein interaction) and the proteinresin topology when bound to the chromatographic resin. For modelling the protein-chromatographic resin adduct, we have derived a
SARW model that was then fitted to the pair density distribution
function (PDDF) of the adduct.
(1)
This means that the retention in both reversed-phase chromatography and HIC increases with the mobile phase’s surface
tension [6,7]. Based on this concept, higher hydrophobic energy
and thus a higher surface tension of the mobile phase should also
translate into higher protein binding capacities of the column.
Another parameter that could influence retention and binding
capacity in HIC is ionic strength. This parameter describes the total
concentration of ions in a solution. Thus, it can be vastly different
for solutions containing identical molar concentrations of different
salts depending on the valences of the salts in question. The ionic
strength I of a solution can be calculated based on the Lewis and
Randall equation:
I=
1
2
n
ci zi2
(2)
i
with n representing the number of ions in the solution, i representing one specific ion, ci being the corresponding concentration
of ion i in mol∗ l−1 , and zi denoting the valence of ion i.
In order to determine the ionic strength, the concentration of
the ions has to be determined using the Henderson-Hasselbalch
equation, defined as:
pH = pKa + log
[A − ]
[HA]
(3)
where [HA] is the molar concentration of the unassociated weak
acid and [A− ] is the molar concentration of the acid’s conjugate
base.
Apart from interactions between the protein and the HIC stationary phase [8,9], it is well known that ions modulate proteinprotein interactions [10–14]. Although speculations about proteinprotein interaction-based multilayer formation [15] and cluster formation [16] can be found in literature, experimental evidence is
scarce for those phenomena in HIC. However, interactive protein
clusters have already been reported for other surfaces. Langdon
et al. [17] showed that attractive protein-protein interactions responsible for cluster formation of BSA on a hydrophilic surface.
In the case of the presence of protein-protein interactions, the
Langmuir adsorption isotherm model is no longer valid since the
non-interactivity of the adsorbate is a prerequisite for its applicability [18]. Meng et al. [19] have shown that the isotherm type
shifted between Langmuir and Freundlich type depending on the
salt concentration. Moreover, they have hypothesized that proteinprotein interaction is responsible for Freundlich type isotherms.
Besides Freundlich type isotherms, the Brunauer-Emmett-Teller
(BET) theory describes multilayer adsorption protein chromatography [20,21].
As an analytical tool, small-angle x-ray scattering (SAXS) gives
a unique insight into the native solution structure of proteins. It
allows the investigation of the intramolecular and intermolecular
structure of proteins, such as the medium resolution protein conformation [22,23] and protein-protein interactions [12,14], respectively. More recently, SAXS has been utilized for online monitor-
2. Theory
2.1. SARW model
We follow the arguments of Hammouda [26], Zimm [32], and
Beaucage [33]. We consider a linear polymer chain first; it consists
of n elements. First, we define a segment of reference. It can be
any segment, i. The probability of finding another segment, j of
the same molecule is [26]:
πi1j (r ) = 4π r2 (3/2 π r
)
−2 3/2
exp −3/2r 2 r
−2
.
(4)
Then, we link the inter-segment distance, r, and the average
inter-monomer distance, r . We follow Hammouda and put it
r 2 = a2 |i − j|2ν [26]. Herein r resembles the inter-segment distance, and ν gives the excluded volume parameter while a is the
statistical segment length. If we put the excluded volume parameter to 1, we get the probability to find two pairs i, j of a nonself-avoiding random chain. It is easy to show that the Eq. (4) is
1
normalized to one, ∫∞
0 dr πi j (r ) = 1. The linear polymer chain is finite and consists of N segments; still following the argument of
2
L.A. Jakob, B. Beyer, C. Janeiro Ferreira et al.
Journal of Chromatography A 1649 (2021) 462231
Zimm, we give the PDDF of this particular construct:
N
p(r ) = ∫ dn(N − n )πn1 (r ).
With the PDDF describing the SARW model (Eq. (11)), the experimental PDDF p(r) can be fitted. The fitting procedure minimizes the difference between the experimental PDDF and the
PDDF describing the SARW by adjusting
(5)
0
2
The norm of it equals
= ∫∞
0 dr p(r ) = N /2. It seems incorrect as from any N segment long chain, random, or random selfavoiding can pair N(N-1)/2 nonidentical segments. Thus, we correct
the norm and find the PDDF:
p (r ) =
(N − 1 )
N
p(r ).
minargr
3.1. Buffer preparation
The salts used for the buffers tested in the experiments were
supplied by Merck (Germany) and were all of analytical grade. All
buffers were prepared from stock solutions of 1.5 M of sodium citrate monobasic, 1 M of sodium phosphate, 0.6 M of sodium sulfate,
2 M of sodium acetate, and then adjusted to pH 6 with NaOH. The
specific dual salt mixtures of 0.329 M of citrate + 0.5 M of sulfate were prepared from a 0.8 M sodium sulfate stock solution. The
buffer preparation was followed by filtration using a 0.22 μm filter
supplied by Merck Millipore (Ireland).
(7)
Please note one important thing. The segments are equally distributed, π (n ) = 1. What if they are not? What if specific segment pairs are not to be taken into account? What if the segments are fractally distributed, and their probability is given by
π (n ) = (nλ )c ? We follow the arguments of Hammouda [26], we
introduce a fractal distribution of n. Moreover, we compute the
norm:
∫ dr pcλ (. . . |r ) = λc
c + 1 − N c + 2 − N c+1
3.2. Model proteins
(8)
(c + 1 ) (c + 2 )
0
Lysozyme was obtained from Merck in the crystalline state.
GFP and the antibody were produced in-house and kept as low
ionic strength stock solutions at 4°C for the experiments’ duration.
GFP was previously expressed in E. coli and purified in a threestep chromatographic process. In contrast, the monoclonal antibody (mAb), an in-house produced adalimumab, was expressed in
CHO and purified solely by protein A capture. For the SAXS experiments analyzing the protein in solution, the monoclonal antibody was purified using a HiLoad 26/600 Superdex 200 pg (Cytiva, Sweden). The model proteins have been analyzed with highperformance size exclusion chromatography (HP-SEC). The corresponding chromatograms can be found in the Supplementary Material (Fig. S1).
It is straightforward to show that in c=0, the norm equals:
N(N-1)/2. We proceed and give pair density of a self-avoiding
random walk explicitly. Therefore, we introduce a set of abbreviations: α =
c− ν2 +1
ν
, α = α + ν1 , β =
1− 3 ν
3r 2 (c2 +3c+2 )(1−N )N 2
ν (N +c+1)
b3
3r 2
,
2b2
β = β N−ν , γ =
3
, and then find for the PDDF for an
π
ensemble of self-avoiding random walks, with fractal distributed
pairs:
pcλ (b, N, ν, c|r )=γ N c+2 Eα
β −Eα β
+N 2 ν (N Eα (β )−Eα (β ) )
3
(9)
∫∞
1
Therein En (z ) =
is the exponential integral
function.
π (n ) = (nλ )c accounts, within the integral for the average
number of minimum paths with a path length n [3].
dt t −n exp(−zt )
3.3. Measurement of surface tension
The surface tension measurements were performed using the
pendant drop (PD) method, an optical method for determining the
surface tension of a drop of liquid by using the drop profile’s curvature. The measurements of the different salt buffers were performed using the Drop Shape Analyzer (Krüss, Germany) instrument. The determination of the surface tension using the PD requires the drop to be distorted by gravity, which is ensured by using a tip large enough to support the needed drop size (in this
case, the needle had a diameter of 1.835 mm). Water was used
as a reference at the beginning of all sets of experiments. Its surface tension is between 72 and 73 mN∗ m−1 , depending on the
surrounding temperature and humidity conditions. The measurements were repeated at least three times each (each one is already the average of one minute of measurements). The system
was always flushed with the intended test buffer between different buffers’ measurements for fifteen minutes to ensure that there
were no traces of other buffers left in the tubes. As determined
by a pycnometer, both the buffers’ density and the temperature of
the room were measured and taken into account by the software
Krüss Advanced (Krüss, Germany) to get the most accurate results
possible.
For obtaining buffers with comparable surface tension, the surface tension value measured for 0.55 M citrate was used as a reference point. The other buffers’ salt concentrations, as previously
2.2. Chromatographic stationary phase as a SARW
If we embed a random walk in a spherical volume, we assume that a spherical PDDF distributes the minimum paths’ average number with a path length n. Think of a sphere that is filled
by random points, up to infinite density. Then any randomly chosen pair will have a minimum path that equals their Euclid net distance. This is true for a hypothetical resin absent of any pore. The
introduction of pores and their decoration by proteins is then measurable by the difference in their particular PDDF. We introduce
the normalized probability to identify minimum paths of length n,
r ∝ λn, and R ∝ λN
π (n ) = λ−1
9n3
3n5
3n2
−
+ 3
16N 6
4N 4
N
(10)
Finally, we obtain the PDDF for a hypothetical resin. It resembles a resin absent of pores.
pSARW (b, N, ν|r ) ∝ 1/16/N 6 pcλ (b, N, ν, 5|r )+3/4/N 4 pcλ (b, N, ν, 3|r )
+1/N 3 pcλ (b, N, ν, 2|r )
(12)
3. Material & methods
The equation is still inappropriate as in nonidentical pairs, the
lower boundary of the integration over n must read one and not 0.
Then the appropriate PDDF reads:
∞
2
While parameters a, cB, and D are due to the norm and the
overall stochastic background, parameters b, N and ν characterize
the system’s morphology on a smaller scale.
(6)
N N
∫ dn(N − n )π (n )πn1 (r )
p (r ) =
N−1 1
p(r ) − a pSARW (b, N, ν r ) + cB r D
(11)
3
L.A. Jakob, B. Beyer, C. Janeiro Ferreira et al.
Journal of Chromatography A 1649 (2021) 462231
Table 1
Surface tension of the buffers used by Senczuk et al. [1] (left-hand side), buffers with adjusted salt concentrations that resulted in similar surface tension values (right-hand
side).
Starting Buffers as used by Senczuk et al. [1]
Surface Tension [mN∗ m−1 ]
Buffers with adjusted salt concentrations to
achieve similar surface tension
Surface Tension [mN∗ m−1 ]
Citrate
Citrate
Citrate
Citrate
73.5
70.4
74.7
73.7
Citrate
Citrate
Citrate
Citrate
73.5
73.4
74.3
73.7
0.55
0.55
0.55
0.55
M
M + 1 M Acetate
M + 0.5 M Phosphate
M + 0.3 M Sulfate
0.55
0.55
0.35
0.55
M
M + 0.5 M Acetate
M + 0.5 M Phosphate
M + 0.3 M Sulfate
described by Senczuk et al., were adjusted to achieve either a decrease or an increase in surface tension, which was then confirmed
by pendant drop measurements. Based on these measurements,
the buffers listed in Table 1 were used for chromatographic experiments.
column and system were subtracted. The resulting value times the
concentration of the load (cload ) divided by the volume of the column was treated as the DBC at 10 % breakthrough (DBC10% ):
3.4. Measurement of dynamic binding capacities
3.5. Calculation of buffer ionic strength
Dynamic binding capacity measurements for protein samples in
the different high salt buffers were performed using a Toyopearl
Butyl-650 M (Tosoh Bioscience, Germany) column. A 4.8 × 0.5 cm
column with a column volume (CV) of 0.94 ml and a 1.3 × 1.0
cm column with a CV of 1.02 ml were used for the breakthrough
(BT) experiments. To test packing quality, 1 % acetone (v/v) was
injected to evaluate the peak asymmetry. The asymmetry ranged
from 1.2-1.6. All chromatographic experiments were carried out on
an ÄKTATM Pure 25 chromatography system (Cytiva, Sweden).
The tested buffers’ ionic strength was calculated using
Eqs. (2) and (3). For preparing buffers with comparable ionic
strengths, the ionic strength value obtained for 0.55 M citrate was
again used as a reference point. The salt concentrations of the
other buffers were adjusted to match that value. Since significant
amounts of NaOH had to be used to adjust the experiment buffers
to a pH of 6, this also had to be considered. Based on these calculations, the buffers listed in Table 1 were used for the chromatographic experiments investigating ionic strength as a possible driving force.
3.4.1. Column packing
A 10/20 tricorn column housing (Cytiva, Sweden) was packed
with TOYOPEARL Butyl-650M (Tosoh Cooperation, Japan) resin using 50 mM phosphate buffer with 1 M of NaCl as packing buffer. A
5 ml∗ min−1 flow rate was chosen for packing based on the manufacturer’s instruction manual. Once the packing operation was
completed, the column was equilibrated with 5 – 10 CVs of low
ionic strength buffer (50 mM of phosphate buffer). While not in
use, both columns were stored in 20 % (v/v) ethanol at room temperature.
3.6. Adsorption isotherms
DBC10% =
(loaded volume10%BT − void volume )∗cload
column volume
(13)
The procedure for the adsorption isotherms was based on a
previous publication [25]. Protein stock solutions were prepared
by mixing a concentrated protein stock (> 60 mg∗ ml−1 ), dH2 O,
and salt stock solutions to achieve the desired buffer composition
and a protein concentration of approximately 7 mg∗ ml−1 . The protein stock solution was then further diluted in a 96 UV Star Microplate (Greiner Bio-One, Austria) to achieve a final concentration
range of 0.5 mg∗ ml−1 – 5 mg∗ ml−1 with a total of ten different
concentrations. Before adding the chromatographic resin, the resin
slurry was set to the concentration of 50 % and washed two times
with dH2 O and six times with the corresponding buffer. 50 μl of
the 50 % slurry were added to the protein solutions to achieve
a total volume of 250 μl and a slurry concentration of 10 %. The
chromatographic resin and the corresponding model protein were
incubated for 24 h on a thermomixer (Thermo Fisher Scientific,
Waltham, MA) at 950 rpm and 21.5°C. The resulting supernatant
was analyzed spectrophotometrically via absorbance at 280 nm to
determine the protein concentration. When the plateau in the adsorption isotherm was not reached, additional measurements were
performed with a 3 - 4.5 mg∗ ml−1 mobile phase concentration at
a resin concentration of 5 %. Adsorption isotherms incorporating
such data points are marked in the corresponding figure.
The Langmuir (Eq. (14)) [18], BET (Eq. (15)) [20] and Freundlich
(16) [19] models were used to describe the adsorption isotherm
data:
3.4.2. Breakthrough curves and calculation of DBC
All samples were transferred into the corresponding high salt
buffer before the experiment either by resolubilizing the crystallized protein in the buffer (in the case of lysozyme) or diluting
the sample protein from a stock solution (for the mAb and GFP).
The stock solution concentrations were set so that the protein was
diluted at least 1:5 in the experimental buffer to achieve a final
load concentration of approximately 5 g∗ l−1 . The precise concentration of the sample solution was then determined spectrophotometrically by measuring the absorbance at 280 nm.
For the chromatographic runs, the column was first equilibrated
in the corresponding high salt experiment buffer. The flow rate for
the loading step was set to achieve a residence time of 10 min.
Sample loading was followed by a 5–10 CV wash step with the experiment buffer. For elution, a linear gradient from 0-100 % B was
performed with water as buffer B over 10 CV, followed by 5 CV at
100 % buffer B. For column CIP, 0.1 M NaOH was used. All experiments were performed in a temperature-controlled room with a
temperature ranging from 21–25°C.
For DBC calculations, the load’s absorbance value was determined in a by-pass experiment on the Äkta system. This value was
then treated as a 100 % breakthrough. The volume was then determined, at which 10 % of the absorbance value at 100 % breakthrough was reached (loaded volume10%BT ). Absorbance at 10 %
breakthrough was below 1 AU for all breakthrough experiments.
From the volume at 10 % breakthrough, the void volume of the
q= c
q=
qmax ∗Ka
1 + qmax ∗Ka
qmonoKs c
(1 − KL c )(1 − KL c + KS c )
q = KF ∗cnF
(14)
(15)
(16)
where q describes the binding capacity in mg protein per ml resin,
c the mobile phase concentration in mg∗ ml−1 , qmax the maximum binding capacity in mg protein per ml resin, Ka the affinity
4
L.A. Jakob, B. Beyer, C. Janeiro Ferreira et al.
Journal of Chromatography A 1649 (2021) 462231
constant of the protein towards the stationary phase in ml∗ mg−1 ,
qmono the binding capacity of a monolayer, KS the affinity constant
towards the stationary phase (equivalent to Langmuir KA ), KL the
affinity constant towards deposited layers [20], KF the adsorption
constant in ml∗ mg−1 and nF the adsorption exponent [19].
In the case of a distinct plateau, the Langmuir isotherm model
was used to fit the data. Data with a second liftoff was fitted
with the BET adsorption isotherm model. Data that showed neither a second liftoff nor a plateau was fitted with the Freundlich
isotherm. The fitted adsorption isotherm model was evaluated
based on trends in residuals. Since protein-protein interaction must
not be negligible for the validity of the Langmuir model [18] and
present in the case of the BET model [21], protein-protein interactions were evaluated from SAXS analytics of the model proteins in
solution (Section 2.7.1).
Eq. 17 ([34]).
d=
2π
q
(17)
where d is the real-space distance in nm and q is the scattering
vector in nm−1 .
3.7.4. Plotting of the background-corrected scattering data
For the measurements of the protein in solution, the
background-corrected scattering data were normalized to q = 0.55
nm−1 and plotted to facilitate the comparison of the low and high
q-range. For the measurements of the protein-chromatographic
resin suspension, the background-corrected scattering data were
normalized to q = 0.09 nm−1 . The curves of the triplicates were
stacked by multiplying the intensity by 1, 101, and 102 , respectively,
to facilitate the comparison between the measurements.
3.7. SAXS
3.7.5. Pair density distribution function
The PDDF p(r) of scattering data was calculated via an inverse
Fourier transform [35]:
All SAXS experiments were performed at the Elettra synchrotron in Trieste, Italy. The scattering vector q (q = 4 π sin(ϴ)
λ−1 , where ϴ is the scattering angle) ranged from 0.896–6.998
nm−1 at a wavelength of λ = 0.154 nm. All protein solutions were
prepared from dH2 O, protein, and salt stock solutions. The recently
described high throughput robot was used for all SAXS experiments [27].
I (q ) = 4
Dmax
π ∫ p (r )
0
sin(q r )
dr
qr
(18)
I(q) is the scattering intensity at the scattering vector q. Dmax is
the maximum dimension of correlated pairs and r is the distance
between the correlated pairs.
The scattering data of the protein-chromatographic resin suspension was transformed to fit the SARW model. The scattering
data after background subtraction (Ie (q)) was fitted to the PDDF
p(r) via Eq. (19):
3.7.1. Proteins in solution
The resulting protein concentration was 5 mg∗ ml−1 for the proteins’ measurements in solution.
20 μl of the protein solution was pipetted into the measuring
cell, and a total of 12 images were measured. For each image, the
exposure time was 10 s followed by a 2 s pause between every image. For each sample, the respective buffer was measured without
an analyte for background subtraction.
minarg
I ( q ) − Ie ( q ) )
2
(19)
where I(q) is calculated according to Eq. (18) to find the PDDF describing our data (p(r)). The minimum of the argument was determined by applying the Mathematica FindArgMin function. Only 0
≤ p(r) were accepted in the inverse Fourier transform. Dmax was
set to 70 and p(r) contained a total of 70 data points (r=1, 2, 3…
70). This fitting procedure resulted in excellent fits throughout all
protein-chromatographic resin suspension experiments, as seen in
the overlay of the experimental data and the produced fit (Supplementary Material, Fig. S3, left-hand side).
The resulting PDDF (p(r)) is then further used to fit the SARW
model derived in Section 3. Again, the difference between p(r) (the
experimental PDDF) and the PDDF of the SARW model is minimized (Eq. (12)). Minimization is achieved by applying the FindArgMin function. This results in considerably good fits for distances
up to 45 nm (Supplementary Material, Fig. S3, right-hand side)
For calculation of the theoretical scattering curves, the atomic
coordinates of the PDBs of lysozyme (1dpx), an IgG1 monoclonal
antibody (1hzh), and GFP (1gfl) were used to calculate the theoretical PDDF by summing up all pair distances of all atoms. The intensities were calculated for every scattering angle between 0.896
and 3.0 0 0 nm−1 according to Eq. (18). The theoretical scattering
curves were used as a benchmark for attractive and repulsive interactions in the low q-range.
3.7.2. Protein-chromatographic resin suspension
For the suspension experiments, the protein concentration was
5 mg∗ ml−1 , and the chromatographic resin slurry was prepared as
described in Section 2.6. The model proteins were GFP and the
monoclonal antibody. The adsorption experiments were performed
at a protein concentration of 5 mg∗ ml−1 and a slurry concentration of 5 % to achieve the chromatographic resin’s full saturation.
The reaction was conducted in 2 ml Eppendorf reaction tubes (Eppendorf GmbH, Germany) at a total volume of 1 ml. The reaction
was incubated for 15 h on a thermomixer (Thermo Fisher Scientific, Waltham, MA) at 900 rpm and room temperature. After incubation, the resin slurry was briefly washed two times with the
respective buffer. For the measurements, the slurry concentration
was set to 40 %. The samples were prepared in triplicates.
For the measurement, 25 μl of a slurry suspension was pipetted into the measuring cell. To increase the throughput and keep
the time between the protein incubation and the actual measurement to a minimum, 20 images were recorded in a total time of
20 s. The exposure time was 950 ms for each image, followed by
a 50 ms pause between the measurements. For each sample, the
respective buffer was measured without an analyte for background
subtraction.
4. Results & discussion
4.1. Determination of buffer surface tension
3.7.3. Data treatment
Data evaluation was performed using the program Mathematica 12.1 (Wolfram Research, Inc., USA). Intensities were averaged
over all 20 images for the sample and the background, respectively. After normalization at 4.95-5.05 nm−1 , the background was
subtracted from the scattering data, resulting in the background
corrected scattering data. Q values of distinctive features and regions of the reciprocal space were converted to the real-space via
The buffers tested in Senczuk et al. (2009) were replicated and
their surface tension was measured (Table 1). Since the surface
tension values varied greatly between buffers, the concentration of
one of the salts in the dual salt mixtures was adjusted until similar surface tension values were reached using the surface tension
measured for 0.55 M citrate (73.5 mN∗ m−1 ) as a reference point
5
L.A. Jakob, B. Beyer, C. Janeiro Ferreira et al.
Journal of Chromatography A 1649 (2021) 462231
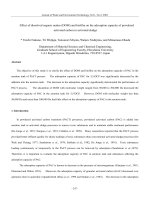
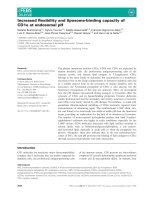
Fig. 1. Breakthrough curves for lysozyme (A, left) and mAb (B, right) at a sample concentration of 5 mg∗ ml−1 using different buffer systems with comparable surface tension
as the mobile phase and a TOYOPEARL Butyl-650 M HIC column. DBC was determined for a residence time of 10 min.
and target value. Based on these measurements, the buffers listed
in Table 1 (right-hand side) were then chosen as the appropriate
buffers for chromatographic experiments for comparing the binding capacities of a HIC column when different dual salt mixtures
with similar surface tension are used as the mobile phases.
At first glance, it might seem counterintuitive that for two of
the dual salt buffer systems (citrate + sulfate and citrate + acetate), the addition of 0.3 M or 0.5 M of the secondary salt resulted in surface tension values that are almost identical to the
one obtained for 0.55 M citrate alone. In this context, it has to
be stated that the surface tension of a mixed salt system is not
the sum of the contributions of the individual salts present in the
mixture. Instead of being additive, the mixture’s surface free energy, which determines the surface tension, is reduced by an excess of the component with the lower surface free energy, which
is enriched in the surface layer [36]. In a dual salt mixture, the salt
with the lower surface tension increment determines the mixture’s
surface tension. This phenomenon was also observed by Baumgartner et al. It led them to state that in their mixtures of kosmotropic
and chaotropic salt, "the surface tension seems to be more influenced by the chaotropic salt" [3].
This behavior is also the reason why it was not possible to
achieve a surface tension value more similar to the reference point
for the mixture of citrate and phosphate, even by further reducing the concentration of phosphate present in the solution down
to 0.1 M. It was, therefore, decided to keep the concentration
of phosphate at its original value of 0.5 M in order to have a
meaningful amount of secondary salt in the solution and instead,
slightly decrease the amount of citrate in the buffer, which resulted
in a surface tension value still within the acceptable range of ±
1 mN∗ m−1 .
For all the dual salt systems investigated in these experiments,
the measured binding capacity was noticeably higher than for
citrate alone. The resulting DBC values varied strongly between
the different buffers (Fig. 1 and Table 2). While this confirms, to
some degree, previous observations of dual salt systems leading to
higher binding capacities in HIC, the results are still slightly different to what Senczuk et al. reported. Our study of the dual salt system with phosphate as a secondary salt does not lead to the largest
increase in binding capacity, as was previously reported [1]. Among
the dual salt systems investigated, higher binding capacities did
not correlate with the slight differences in buffer surface tension
remaining after concentration adjustment. Therefore, it seems unlikely that these small variations in surface tension are the cause
for the observed phenomenon.
4.3. The ionic strength of the buffers
The results described in the previous section indicated that the
surface tension of the mobile phase solution might not be the decisive influencing factor when it comes to the dynamic binding
capacities of a HIC column. Thus the influence of ionic strength
on protein binding was investigated. The salt concentration in the
buffer systems was adjusted to ionic strength values comparable to
the reference buffer (0.55 M citrate pH 6.0).
Eqs. (2) and (3) were used to calculate the ionic strength. The
citrate concentration in the buffers was then adjusted to get a
value that closely matched the reference (ionic strength of 3.1 M).
For the buffer containing the secondary salt sulfate, we have decided to adjust the secondary salt concentration to 0.5 M to match
the secondary salt concentration of all dual salt systems. Since pH
adjustment to pH 6.0 required the addition of significant amounts
of NaOH, which, when taken into account, led to the new citrate
concentrations and ionic strength values listed in Table 3.
4.2. Binding capacity in buffers with equal surface tension
4.4. Binding capacity in buffers with equal ionic strength
Based on the relationship described in Eq. (1), it could be expected that different buffers at the same pH and with similar surface tension values would have the same hydrophobic energy and,
hence, lead to the same dynamic binding capacity of the HIC resin.
This expectation was put to the test by measuring the dynamic
binding capacity of a Toyopearl Butyl 650-M column for lysozyme
(Fig. 1 A) and the mAb (Fig. 1 B) in breakthrough experiments using the dual salt buffers with comparable surface tension (Table 1)
as mobile phases. Table 2 provides a list with the DBC values calculated at 10 % BT for all the individual curves.
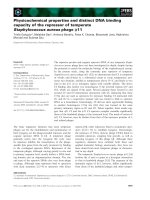
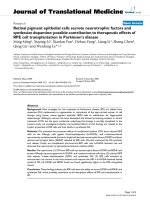
The DBC was studied with lysozyme, GFP, and mAb at sample
concentrations of approx. 5 mg∗ ml−1 (Fig. 2). Dynamic binding capacities differ substantially between the mono- and dual salt systems (Table 4). For lysozyme and GFP, the breakthrough curves of
dual salt systems group closer together. For mAb, dynamic binding
capacities differ vastly depending on the secondary salt. Altogether,
differences are less pronounced compared to the buffers of equal
surface tension, especially in the case of lysozyme. All proteins exhibit the lowest binding capacity in the mono salt buffer 0.55 M
6
L.A. Jakob, B. Beyer, C. Janeiro Ferreira et al.
Journal of Chromatography A 1649 (2021) 462231
Table 2
Comparing capacities at 10 % BT for lysozyme, mAb, and GFP when solubilized in buffers sharing comparable surface tension. The DBC was determined
for a residence time of 10 min. Differences between the lowest and highest binding capacities are shown, where either all buffers or only dual salt buffers
are compared to each other.
Buffer
Buffer Surface tension [mN∗ m−1 ]
DBC10% for lysozyme [mg∗ ml−1 ]
DBC10% for mAb [mg∗ ml−1 ]
0.55 M Citrate
0.55 M Citrate + 0.50 M Acetate
0.35 M Citrate + 0.50 M Phosphate
0.55 M Citrate + 0.30 M Sulfate
Highest difference, all systems [%]
Highest difference, dual salt systems only [%]
73.5
73.4
74.3
73.7
-
7
23
12
21
70
48
8
21
17
22
64
23
Table 3
New citrate concentrations calculated to achieve dual salt systems sharing the same ionic strength considering the citrate buffer as a reference (3.1 M).
Buffer
Citrate concentration [M]
Ionic strength after pH adjustment [M]
0.55 M Citrate
Citrate + 0.50 M Acetate
Citrate + 0.50 M Phosphate
0.463
0.441
3.1
2.9
2.8
Citrate + 0.50 M Sulfate
0.329
2.8
Fig. 2. Breakthrough curves for lysozyme (A, top left), mAb (B, top right) and GFP (C, bottom left) at a sample concentration of approx. 5 mg∗ ml−1 using different buffer
systems with matching ionic strength as the mobile phase and a TOYOPEARL Butyl-650 M HIC column. DBC was determined for a residence time of 10 min.
sodium citrate. The breakthrough curves with the secondary salt
sulfate induce the highest dynamic binding capacities for lysozyme
and GFP, whereas it ranks close second for mAb. Besides, it is difficult to deduce trends for the investigated systems, and further
analytics are needed to gain better understanding of driving forces
governing binding to the stationary phase.
4.5. Adsorption behavior, internal structure, protein-protein
interactions, and binding topology in buffers with equal ionic strength
The breakthrough experiments showed that ionic strength
seems to be the more decisive factor for the DBC. Nevertheless,
ionic strength alone is not sufficiently describing the phenomenon.
Therefore, we have conducted SAXS and adsorption isotherm ex7
L.A. Jakob, B. Beyer, C. Janeiro Ferreira et al.
Journal of Chromatography A 1649 (2021) 462231
Table 4
Comparing capacities at 10 % BT for lysozyme, mAb, and GFP when solubilized in buffers sharing comparable ionic strength. The DBC was determined for a residence time of 10 min. Differences between the lowest and highest binding capacities are shown, where either all buffers or only
dual salt buffers are compared to each other.
Buffers
DBC10 % for lysozyme [mg∗ ml−1 ]
DBC10% for mAb [mg∗ ml−1 ]
DBC10% for GFP [mg∗ ml−1 ]
0.55 M Citrate
0.463 M Citrate + 0.50 M Acetate
0.441 M Citrate + 0.50 M Phosphate
0.329 M Citrate + 0.50 M Sulfate
Highest difference, all systems [%]
Highest difference, dual salt systems only [%]
7
17
16
18
61
11
8
14
20
19
60
30
6
12
13
14
57
14
periments to investigate possible explanations for the differences
in dynamic binding capacities. Firstly, we hypothesize that the protein structure could be altered in the respective buffer, resulting
in either an expanded or collapsed conformation. This would then
result in modulation of the protein’s footprint on the chromatographic resin and therefore cause differences in the dynamic binding capacities. Alternatively, protein-protein interactions could be
responsible for modulating the surface coverage, allowing closer
packing when protein-protein interactions are attractive and looser
packing when protein-protein interactions are repulsive, respectively. Moreover, attractive protein-protein interaction could trigger
multilayer formation. In order to investigate the internal structure
and intermolecular interactions, the model proteins were analyzed
via SAXS. Furthermore, adsorption isotherms were performed to
evaluate the impact of protein-protein interaction on protein adsorption. Lastly, the protein-resin adduct was analyzed using SAXS.
The self-avoiding random walk model was fitted into the pair density distribution function. The resulting model parameters were analyzed to investigate the protein topology on the chromatographic
resin.
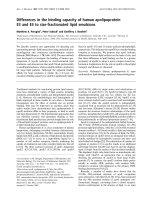
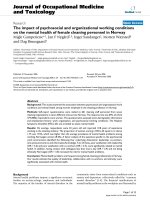
4.5.1. SAXS: proteins in buffers of equal ionic strength
In Fig. 3, SAXS traces of the model proteins in the investigated
mono and dual salt buffers are shown. Moreover, the theoretical
scattering profile of PDB crystal structures 1dpx, 1hzh and 1gfl are
depicted. Notably, the intermediary and high q-range of all SAXS
curves (~ 0.4 nm−1 < q) are comparable to the crystal structure’s
theoretical scattering curve. However, noise increases substantially
at q = 1.5 nm−1 , resulting in more significant deviations from the
theoretical scattering curve. This is believed to be due to the high
electronic contrast. Since SAXS traces are comparable between 0.4
and 1.5 nm−1 , real-space distances of 4.1-15.7 nm are accordingly
(as their reciprocal relation is given by Eq. (17), which includes the
intramolecular distances of mAb and GFP (Dmax mAb and GFP: 16.4
nm [37] and 7 nm [38]) but exceeds that of lysozyme (Dmax of
lysozyme: 4.0 nm [39]). This indicates comparable intramolecular
structures of mAb and GFP > 4.1 nm in all investigated buffer systems.
In the low q-range (q > 0.2 nm−1 ), the scattering intensities
differ substantially for mAb in different HIC buffers (Fig. 3 B). For
lysozyme and GFP (Fig. 3 A & B), differences in the low q-range are
observable but less pronounced. Generally, the low q-range is dominated by long-range correlations, indicating the respective buffer’s
modulation of protein-protein interactions. To classify whether the
interactions are attractive or repulsive, the theoretical scattering
profiles of the crystal structures of the corresponding model proteins were calculated and compared to the experimental data in
the low q-range. Lysozyme shows attractive interactions (Fig. 3
A), whereas mAb shows both attractive, neutral and repulsive behavior, respectively (Fig. 3 B). For GFP, no or minor repulsive interactions can be observed in the respective mono or dual salt
buffers. Trends towards attraction and repulsion correlate with the
pI of the model protein: the acidic GFP (pI = 5.8 [30]) exhibits
no or weak repulsive interactions, mAb (pI = 7.9-9.1 [29]) both
Fig. 3. SAXS profiles of lysozyme (A), the mAb (B), and GFP (C) in solution (5
mg∗ ml−1 ). Attractive and repulsive categorizations are referred to as the theoretical scattering profile of the corresponding PDB. Respective PDBs are visualized in
the top right corner for each protein.
8
L.A. Jakob, B. Beyer, C. Janeiro Ferreira et al.
Journal of Chromatography A 1649 (2021) 462231
pronounced attractive and repulsive interactions, respectively, and
lysozyme (pI = 10.7 [28]) are dominated by attractive interactions
in the dual salt buffers.
The attractivity (and vice versa repulsion) induced by the secondary salt follows a trend: the presence of divalent anions (SO4 2−
and HPO4 2− ) induce the highest attractive/lowest repulsive forces
followed by the monovalent acetate anion. This trend is in line
with the Hofmeister series [13]. The mono- and dual salt system’s
comparison reveals inconsistencies with the Hofmeister series: at
pH 6, citrate2− and citrate3− are the predominant anion species
in aqueous solution [40] and rather kosmotropic anions. (citrate3−
> SO4 2− > HPO4 2- > citrate2− > CH3 COO− > citrate− [13,41,42])
However, the single salt sodium citrate buffer induces higher repulsive/lower attractive interactions than the citrate and acetate
system.
Ultimately, the SAXS analysis of the proteins in the respective
buffer indicates that the internal structure of mAb and GFP >
4.1 nm is comparable. Moreover, protein-protein interactions depend on the kosmotropic nature of the secondary anion and the
pI of the protein. mAb systems generally span the broadest range
of protein-protein interactions, ranging from the repulsive to the
attractive regime. Lysozyme systems are strictly in the attractive
regime, whereas GFP shows no to slightly repulsive interactions.
Attractive interactions correlate with dynamic binding capacities,
as highly attractive systems (such as the systems with the secondary salt sulfate) coincide with higher dynamic binding capacities. More repulsive systems (especially citrate alone) coincide with
low dynamic binding capacities. For mAb, both the variations in
dynamic binding capacity (30 % for mAb’s dual salt systems compared to 11–14 % for GFP and lysozyme, as seen in Table 4) and
protein-protein interactions are high (Fig. 3), whereas they are
smaller for the other two proteins. The single salt system 0.550
M citrate shows an interesting behavior. Judging from the proteinprotein interaction data alone, we would postulate generally lower
binding capacities than the dual salt system, as the citrate system
is rather repulsive (Fig. 3). However, the difference for citrate alone
to the system with the highest binding capacity is 57–61 %, but the
difference between the lowest and highest binding capacity ranges
from 11–30 % for the dual salt systems (Table 4). Although we only
have a qualitative measure for protein-protein interactions at hand,
this vast difference cannot be explained in the protein-protein interaction analysis (Fig. 3). This underlines the need for a quantitative comparison of protein-protein interactions and dynamic binding capacities.
Altogether, we hypothesize that protein-protein interactions
could explain high dynamic binding capacities and play a crucial
role in protein adsorption. In the following section, we will focus
on the implications of protein-protein interactions in protein adsorption in general and investigate whether the binding mode of
the protein is influenced.
Fig. 4. Adsorption isotherms for lysozyme (A, top), mAb (B, middle), and GFP (C,
bottom). A total volume of 250 μl was incubated for 24 h in 96 well plates at a
slurry conc. of 10 % and 5 %, respectively. Data points where a resin concentration of
5 % where used are denoted with a star. 95 % confidence intervals are displayed in
the corresponding color. Time effects were tested by reducing the incubation time
to 3 h for the mAb in 0.441 M citrate & 0.5 M phosphate. As seen in Fig. S2, Supplementary Material, the difference between 3 and 24 h is small.
4.5.2. Isotherms in buffers with equal ionic strength
Equivalent to the breakthrough curves (Fig. 2), adsorption
isotherms were determined for the model proteins in mono- and
dual salt buffers of equal ionic strength (Fig. 4). Generally, the
ranking of the binding capacities in the adsorption isotherm experiments is comparable to the breakthrough curves for GFP and mAb.
For lysozyme, however, this is not the case except for the mono
salt buffer. The 0.55 M citrate buffer induces the lowest binding in
the adsorption isotherms and breakthrough experiments.
As discussed above, most model proteins exhibit proteinprotein interactions in the investigated systems, where GFP shows
the weakest protein-protein interactions. Factoring in the proteinprotein interactions from our SAXS analysis, Langmuir adsorption
isotherm behavior is not expected for systems exhibiting protein-
protein interactions, which is true for the majority of the experiments (Fig. 4).
When only the adsorption isotherm data is considered, the
Langmuir model describes the GFP adsorption isotherms reasonably well (Fig. 4 A). Considering also the SAXS data; GFP in solution showed the lowest protein-protein interaction of all investigated model proteins. Only GFP in citrate and citrate plus phosphate shows weak repulsive protein-protein interaction (Fig. 3 C).
Since the protein-protein interaction analysis here is only qualitative, it is challenging to state whether the measured protein9
L.A. Jakob, B. Beyer, C. Janeiro Ferreira et al.
Journal of Chromatography A 1649 (2021) 462231
protein interactions are high enough to diminish the model’s validity or they can be neglected to allow for a good fit.
Adsorption isotherms of the mAb only follow Langmuir behavior when acetate is employed as a secondary salt (Fig. 4 B), which
is in line with the protein-protein interaction data from the SAXS
analytics (Fig. 3 B). When phosphate and sulfate are employed as
secondary salts, a non-Langmuirian ascent can be observed that
can be fitted well with the Freundlich isotherm. When phosphate
is employed as a secondary salt, a non-Freundlich plateau is eventually reached, making both models unsuitable for the description of the isotherm. For the secondary salt sulfate, however, a
plateau could not be reached. Here, we could not collect data
at higher mobile phase concentrations due methodological limitations. Lastly, the 0.55 M citrate buffer induces the Freundlich type
binding for mAb. This non-Langmuirian behavior is also in line
with our protein-protein interaction data since the mAb is in the
repulsive regime when 0.55 M citrate is used as a buffer.
The adsorption isotherm experiments with lysozyme reveal
Freundlich and BET behavior, respectively (Fig. 4 A). For the
lysozyme experiments, non-Langmuirian behavior is also in line
with the SAXS data since a strictly attractive regime is observed
for lysozyme in all investigated systems (Fig. 3 A). Adsorption
isotherms that follow the BET model indicate multilayer formation,
but it is unclear whether the multilayer forming interactions are
reversible or irreversible.
Conclusively, we hypothesize that either the surface coverage is
increased or multilayer formation does occur in systems that follow the Freundlich and BET isotherm model, respectively, being
consistent with our protein-protein interaction data. However, it
cannot be stated whether reversible self-association or irreversible
aggregation occurs. Furthermore, GFP in citrate only and citrate
plus phosphate could show pseudo-Langmuirian behavior or too
little repulsive interaction to impact the protein adsorption.
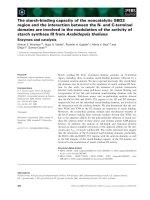
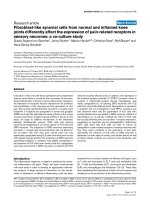
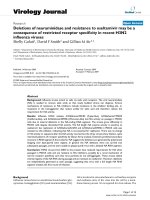
Fig. 5. A: Self-avoiding random walk (SARW) excluded volume parameter (ν ) deduced from SAXS measurements of resin slurry (5 %) incubated with protein at 5
mg∗ ml−1 for 15 h. The average of three independent experiments is shown, including standard deviation. B: Conceptual visualization of the impact of protein binding on a SARW polymer. As proteins deposit in the cavities of the chromatographic
resin, the excluded volume parameter (ν ) of the protein-resin adduct decreases.
area. When a fractal object is considered, this is most likely caused
by the deposition of the protein in the cavities of the chromatographic resin. Deposition of proteins in the cavities of the chromatographic resin would decrease overall accessible surface area
(Fig. 5 B).
On the other hand, preferential binding of the protein to flat
or convex regions of the chromatographic resin would increase the
accessible surface area and, therefore, the excluded volume parameter of the whole object, which could not be observed. This curvature dependency was previously highlighted in a theoretical work
[44]. There, concave hemicylindrical carbon nanotubes were simulated in water, and they were more hydrophobic than their convex counterpart. When we now also consider the SAXS analytics
of the proteins in solution, buffer-dependent protein-protein interactions could play a role in the topology of the protein-resin
adduct. Protein-protein interactions could lead to increased deposition onto already occupied cavities and decreased surface coverage due to repulsion, respectively. Altogether, we believe that the
excluded volume parameter decreases due to the deposition of the
protein in the cavities of the chromatographic resin. Nevertheless,
this hypothesis is only based on theoretical considerations and demands further validation.
Similarly, the path length of the resulting self-avoiding random walk increases when mAb and GFP are loaded onto the resin,
whereas the increase is more pronounced for mAb than GFP. In
contrast to the excluded volume parameters, only two buffering
systems show significantly different path lengths, namely mAb incubated with citrate alone exhibited shorter path lengths than citrate plus sulfate (Fig. S4, Supplementary Material).
4.5.3. SAXS: protein-resin adduct fitted via SARW model
For the analysis of the protein-resin adduct, the chromatographic resin was incubated for 15 h with either mAb, GFP or only
buffer, respectively. The resin suspensions were measured via SAXS
and a self-avoiding random walk model was fitted into the resulting pair density distribution function after inverse Fourier transform of the scattering data (Fig. S3, Supplementary Material). The
resulting model parameters are presented in Fig. 5 A, as well as
Fig. S4 (Supplementary Material).
Fig. 5 A shows that the excluded volume decreases when protein (GFP and mAb) is loaded onto the resin. When comparing the
bound model protein’s impact, the resulting excluded volume parameter is lower for resin incubated with mAb compared to GFP.
Besides the impact of the loaded protein, the excluded volume parameter depends on the buffering system. For either model protein,
the excluded volume parameter is significantly higher in the mono
salt system (0.55 sodium citrate) than all other dual salt systems.
Furthermore, the excluded volume parameter is lowest for systems
incubated with the dual salt buffer citrate plus sulfate. This buffer
results in a significantly lower excluded volume parameter compared to all others in mAb systems. Moreover, it induces a significantly lower excluded volume parameter for GFP systems compared to citrate alone and citrate plus acetate.
Altogether, the excluded volume parameter correlates inversely
with the equilibrium binding capacity determined via the adsorption isotherms. This of course raises the question how protein
adsorption could impact the excluded volume parameter of the
adduct as a whole. Generally, the excluded volume parameter can
be correlated with the accessible surface area, as the accessible
surface area encompasses the excluded volume [43]. Therefore, we
believe that the reduction of the excluded volume parameter can
be best understood with the reduction of the accessible surface
5. Conclusion
The ionic strength of dual salt HIC buffers is a more decisive parameter for dynamic binding capacities than their surface tension.
However, dynamic binding capacities still differ up to 30 % depending on the secondary salt employed, and the model protein used,
even with comparable ionic strength of the buffering systems. To
gain better mechanistic insight into dual salt systems in HIC, SAXS
10
L.A. Jakob, B. Beyer, C. Janeiro Ferreira et al.
Journal of Chromatography A 1649 (2021) 462231
analytics have been used to investigate the model proteins in the
respective dual salt systems alone and when bound to the chromatographic resin.
We conclude that protein-protein interactions increase surface
coverage for mAb and trigger multilayer formation for lysozyme,
as the adsorption isotherms show a deviation from Langmuirian
behavior, respectively. Protein-protein interactions are modulated
in general agreement with the Hofmeister series and the pI of the
model protein. The excluded volume parameter correlates with the
maximum isotherm binding capacities. We hypothesize that the
decrease of the excluded volume parameter is caused by the deposition of proteins in the cavities of the chromatographic resin.
Furthermore, we postulate that attractive protein-protein interactions can enhance deposition in said cavities, as it allows closer
packing due to the formation of attractive clusters and multilayers,
respectively.
The protein’s internal structure is not responsible for the increased binding capacity. The internal solution structure of mAb
and GFP at distances > 4.1 nm is comparable in the investigated
buffers, suggesting unaltered protein conformation.
[3] K. Baumgartner, S. Amrhein, A. Oelmeier Stefan, J. Hubbuch, The influence
of mixed salts on the capacity of HIC adsorbers: a predictive correlation to
the surface tension and the aggregation temperature, Biotechnol. Prog. 32 (2)
(2015) 346–354, doi:10.1002/btpr.2166.
[4] A. Werner, H. Hasse, Experimental study and modeling of the influence of
mixed electrolytes on adsorption of macromolecules on a hydrophobic resin,
J. Chromatogr. A 1315 (2013) 135–144, doi:10.1016/j.chroma.2013.09.071.
[5] E. Hackemann, H. Hasse, Influence of mixed electrolytes and pH on adsorption of bovine serum albumin in hydrophobic interaction chromatography, J.
Chromatogr. A 1521 (2017) 73–79, doi:10.1016/j.chroma.2017.09.024.
[6] C. Horváth, W. Melander, I. Molnár, Solvophobic interactions in liquid chromatography with nonpolar stationary phases, J. Chromatogr. (125) (1976)
129–156.
[7] I. Molnár, Searching for robust HPLC methods – CSABA Horváth and the
Solvophobic theory, Chromatographia 62 (13) (2005) s7–s17, doi:10.1365/
s10337- 005- 0645- 1.
[8] M.E. Lienqueo, A. Mahn, J.C. Salgado, J.A. Asenjo, Current insights on protein
behaviour in hydrophobic interaction chromatography, J. Chromatogr. B Analyt
Technol. Biomed. Life Sci. 849 (1-2) (2007) 53–68, doi:10.1016/j.jchromb.2006.
11.019.
[9] M. Baca, J. De Vos, G. Bruylants, K. Bartik, X. Liu, K. Cook, S. Eeltink, A comprehensive study to protein retention in hydrophobic interaction chromatography, J. Chromatogr. B Analyt. Technol. Biomed. Life Sci. 1032 (2016) 182–188,
doi:10.1016/j.jchromb.2016.05.012.
[10] R. Majumdar, P. Manikwar, J.M. Hickey, H.S. Samra, H.A. Sathish, S.M. Bishop,
C.R. Middaugh, D.B. Volkin, D.D. Weis, Effects of salts from the Hofmeister series on the conformational stability, aggregation propensity, and local flexibility of an IgG1 monoclonal antibody, Biochemistry 52 (19) (2013) 3376–3389,
doi:10.1021/bi400232p.
[11] A.Y. Xu, M.M. Castellanos, K. Mattison, S. Krueger, J.E. Curtis, Studying excipient modulated physical stability and viscosity of monoclonal antibody formulations using small-angle scattering, Mol. Pharm. 16 (10) (2019) 4319–4338,
doi:10.1021/acs.molpharmaceut.9b00687.
[12] B.J. Dear, J.A. Bollinger, A. Chowdhury, J.J. Hung, L.R. Wilks, C.A. Karouta, K. Ramachandran, T.Y. Shay, M.P. Nieto, A. Sharma, J.K. Cheung, D. Nykypanchuk,
P.D. Godfrin, K.P. Johnston, T.M. Truskett, X-ray scattering and coarse-grained
simulations for clustering and interactions of monoclonal antibodies at high
concentrations, J. Phys. Chem. B 123 (25) (2019) 5274–5290, doi:10.1021/acs.
jpcb.9b04478.
[13] C.P. Schneider, D. Shukla, B.L. Trout, Arginine and the Hofmeister Series: the
role of ion-ion interactions in protein aggregation suppression, J. Phys. Chem.
B 115 (22) (2011) 7447–7458, doi:10.1021/jp111920y.
[14] O. Matsarskaia, F. Roosen-Runge, G. Lotze, J. Moller, A. Mariani, F. Zhang,
F. Schreiber, Tuning phase transitions of aqueous protein solutions by multivalent cations, Phys. Chem. Chem. Phys. PCCP 20 (42) (2018) 27214–27225,
doi:10.1039/c8cp05884a.
[15] J. Chen, S.M. Cramer, Protein adsorption isotherm behavior in hydrophobic interaction chromatography, J. Chromatogr. A 1165 (1-2) (2007) 67–77, doi:10.
1016/j.chroma.2007.07.038.
[16] A.P. Minton, Effects of excluded surface area and Adsorbate clustering on surface adsorption of proteins. II. Kinetic models, Biophys. J. 80 (4) (2001) 1641–
1648, doi:10.1016/S0 0 06- 3495(01)76136- X.
[17] B.B. Langdon, M. Kastantin, R. Walder, D.K. Schwartz, Interfacial protein-protein
associations, Biomacromolecules 15 (1) (2014) 66–74, doi:10.1021/bm401302v.
[18] R.A. Latour, The Langmuir isotherm: a commonly applied but misleading approach for the analysis of protein adsorption behavior, J. Biomed. Mater Res. A
103 (3) (2015) 949–958, doi:10.1002/jbm.a.35235.
[19] Q. Meng, J. Wang, G. Ma, Z. Su, Isotherm type shift of hydrophobic interaction
adsorption and its effect on chromatographic behavior, J. Chromatogr. Sci. 51
(2) (2013) 173–180, doi:10.1093/chromsci/bms123.
[20] A. Ebadi, J.S. Soltan Mohammadzadeh, A. Khudiev, What is the correct form of
BET isotherm for modeling liquid phase adsorption? Adsorption 15 (1) (2009)
65–73, doi:10.1007/s10450- 009- 9151- 3.
[21] S. Brunauer, P.H. Emmett, E. Teller, Adsorption of Gases in Multimolecular Layers, J. Am. Chem. Soc. 60 (2) (1938) 309–319, doi:10.1021/ja01269a023.
[22] N. Codina, D. Hilton, C. Zhang, N. Chakroun, S.S. Ahmad, S.J. Perkins, P.A. Dalby,
An expanded conformation of an antibody fab region by X-Ray scattering,
molecular dynamics, and smfret identifies an aggregation mechanism, J. Mol.
Biol. 431 (7) (2019) 1409–1425, doi:10.1016/j.jmb.2019.02.009.
[23] M.C. Thompson, B.A. Barad, A.M. Wolff, H. Sun Cho, F. Schotte, D.M.C. Schwarz,
P. Anfinrud, J.S. Fraser, Temperature-jump solution X-ray scattering reveals
distinct motions in a dynamic enzyme, Nat Chem. (2019), doi:10.1038/
s41557- 019- 0329- 3.
[24] J. Plewka, G.L. Silva, R. Tscheliessnig, H. Rennhofer, C. Dias-Cabral, A. Jungbauer,
H.C. Lichtenegger, Antibody adsorption in protein-A affinity chromatography in situ measurement of nanoscale structure by small-angle X-ray scattering, J.
Sep. Sci. 41 (22) (2018) 4122–4132, doi:10.10 02/jssc.20180 0776.
[25] G.L. Silva, J. Plewka, H. Lichtenegger, A.C. Dias-Cabral, A. Jungbauer, R. Tscheliessnig, The pearl necklace model in protein a chromatography: molecular
mechanisms at the resin interface, Biotechnol. Bioeng. 116 (1) (2019) 76–86,
doi:10.1002/bit.26843.
[26] B. Hammouda, Small-angle scattering from branched polymers, Macromol.
Theory Simul. 21 (6) (2012) 372–381, doi:10.1002/mats.201100111.
[27] R. Haider, B. Sartori, A. Radeticchio, M. Wolf, S. Dal Zilio, B. Marmiroli,
H. Amenitsch, μDrop: a system for high-throughput small-angle X-ray scat-
Declaration of Competing Interest
The authors declare that they have no known competing financial interests or personal relationships that could have appeared to
influence the work reported in this paper.
CRediT authorship contribution statement
Leo A. Jakob: Conceptualization, Methodology, Formal analysis, Investigation, Data curation, Writing – original draft, Visualization. Beate Beyer: Conceptualization, Formal analysis, Investigation, Methodology, Writing – original draft. Catarina Janeiro Ferreira: Investigation, Writing – original draft. Nico Lingg: Methodology, Writing – review & editing. Alois Jungbauer: Conceptualization, Writing – review & editing, Supervision, Project administration. Rupert Tscheließnig: Conceptualization, Formal analysis,
Writing – review & editing, Supervision.
Acknowledgments
The work was funded by the Austrian Science Fund FWF within
the frame of the PhD Program “Biomolecular Technology of Proteins” (W1224-B09). The COMET center: acib: Next Generation Bioproduction is funded by BMK, BMDW, SFG, Standortagentur Tirol,
Government of Lower Austria und Vienna Business Agency in the
framework of COMET - Competence Centers for Excellent Technologies. The COMET-Funding Program is managed by the Austrian Research Promotion Agency FFG. The funding agencies had no influence on the conduct of this research. We are deeply grateful to Dr.
Bernhard Sissolak and Prof. Rainer Hahn for supplying monoclonal
antibody and GFP, respectively.
Supplementary materials
Supplementary material associated with this article can be
found, in the online version, at doi:10.1016/j.chroma.2021.462231.
References
[1] A.M. Senczuk, R. Klinke, T. Arakawa, G. Vedantham, Y. Yigzaw, Hydrophobic
interaction chromatography in dual salt system increases protein binding capacity, Biotechnol. Bioeng. 103 (5) (2009) 930–935, doi:10.1002/bit.22313.
[2] E. Müller, J. Vajda, D. Josic, T. Schröder, R. Dabre, T. Frey, Mixed electrolytes in
hydrophobic interaction chromatography, J. Sep. Sci. 36 (8) (2013) 1327–1334,
doi:10.10 02/jssc.20120 0704.
11
L.A. Jakob, B. Beyer, C. Janeiro Ferreira et al.
[28]
[29]
[30]
[31]
[32]
[33]
[34]
[35]
[36]
Journal of Chromatography A 1649 (2021) 462231
tering measurements of microlitre samples, J. Appl. Crystallogr. 54 (1) (2021),
doi:10.1107/s160 0576720 014788.
T. Sakaguchi, T. Wada, T. Kasai, T. Shiratori, Y. Minami, Y. Shimada, Y. Otsuka,
K. Komatsu, S. Goto, Effects of ionic and reductive atmosphere on the conformational rearrangement in hen egg white lysozyme prior to amyloid formation, Colloids Surf B Biointerf. 190 (2020) 110845, doi:10.1016/j.colsurfb.2020.
110845.
L. Magnenat, A. Palmese, C. Fremaux, F. D’Amici, M. Terlizzese, M. Rossi,
L. Chevalet, Demonstration of physicochemical and functional similarity between the proposed biosimilar adalimumab MSB11022 and Humira(R), MAbs
9 (1) (2017) 127–139, doi:10.1080/19420862.2016.1259046.
A.M. dos Santos, Thermal effect on Aequorea green fluorescent protein anionic
and neutral chromophore forms fluorescence, J. Fluoresc 22 (1) (2012) 151–
154, doi:10.1007/s10895- 011- 0941- 0.
W. Wang, S. Singh, D.L. Zeng, K. King, S. Nema, Antibody structure, instability,
and formulation, J. Pharm. Sci. 96 (1) (2007) 1–26, doi:10.1002/jps.20727.
B.H. Zimm, The Scattering of Light and the Radial Distribution Function of
High Polymer Solutions, J. Chem. Phys. 16 (12) (1948) 1093–1099, doi:10.1063/
1.1746738.
G. Beaucage, Determination of branch fraction and minimum dimension
of mass-fractal aggregates, Phys. Rev. E 70 (3) (2004) 031401, doi:10.1103/
PhysRevE.70.031401.
M.A. Blanco, H.W. Hatch, J.E. Curtis, V.K. Shen, Evaluating the effects of hinge
flexibility on the solution structure of antibodies at concentrated conditions, J.
Pharm. Sci. 108 (5) (2019) 1663–1674, doi:10.1016/j.xphs.2018.12.013.
O. Glatter, A new method for the evaluation of small-angle scattering data, J.
Appl. Crystallogr. 10 (5) (1977) 415–421, doi:10.1107/S0021889877013879.
J.W. Gibbs, The collected works of J. Willard Gibbs, Yale University Press,
New Haven, 1948.
[37] C.R. Mosbaek, P.V. Konarev, D.I. Svergun, C. Rischel, B. Vestergaard, High
concentration formulation studies of an IgG2 antibody using small angle X-ray scattering, Pharm. Res. 29 (8) (2012) 2225–2235, doi:10.1007/
s11095- 012- 0751- 3.
[38] D.P. Myatt, L. Hatter, S.E. Rogers, A.E. Terry, L.A. Clifton, Monomeric green fluorescent protein as a protein standard for small angle scattering, Biomed. Spectrosc. Imaging 6 (3-4) (2017) 123–134, doi:10.3233/bsi-170167.
[39] C. Kulsing, A.Z. Komaromy, R.I. Boysen, M.T. Hearn, On-line determination by
small angle X-ray scattering of the shape of hen egg white lysozyme immediately following elution from a hydrophobic interaction chromatography column, Analyst 141 (20) (2016) 5810–5814, doi:10.1039/c6an00851h.
[40] C. Gervais, C.A. Grissom, N. Little, M.J. Wachowiak, Cleaning marble with ammonium citrate, Stud. Conserv. 55 (3) (2013) 164–176, doi:10.1179/sic.2010.55.
3.164.
[41] C. Drummond, L. Pérez-Fuentes, D. Bastos-González, Can polyoxometalates Be
considered as superchaotropic ions? J. Phys. Chem. C 123 (47) (2019) 28744–
28752, doi:10.1021/acs.jpcc.9b08324.
[42] F. Hofmeister, Zur Lehre von der Wirkung der Salze, Archiv für experimentelle
Pathologie und Pharmakologie 24 (4) (1888) 247–260, doi:10.1007/BF01918191.
[43] T.J. Richmond, Solvent accessible surface area and excluded volume in proteins: Analytical equations for overlapping spheres and implications for the hydrophobic effect, J. Mol. Biol. 178 (1) (1984) 63–89, doi:10.1016/0022-2836(84)
90231-6.
[44] E. Xi, V. Venkateshwaran, L. Li, N. Rego, A.J. Patel, S. Garde, Hydrophobicity of proteins and nanostructured solutes is governed by topographical and
chemical context, Proc. Natl. Acad. Sci. USA 114 (51) (2017) 13345–13350,
doi:10.1073/pnas.170 0 092114.
12