Evaluation of the automated micro-solid phase extraction clean-up system for the analysis of pesticide residues in cereals by gas chromatography-Orbitrap mass spectrometry
Bạn đang xem bản rút gọn của tài liệu. Xem và tải ngay bản đầy đủ của tài liệu tại đây (1.68 MB, 11 trang )
Journal of Chromatography A 1652 (2021) 462384
Contents lists available at ScienceDirect
Journal of Chromatography A
journal homepage: www.elsevier.com/locate/chroma
Evaluation of the automated micro-solid phase extraction clean-up
system for the analysis of pesticide residues in cereals by gas
chromatography-Orbitrap mass spectrometry
Elena Hakme∗, Mette Erecius Poulsen
National Food Institute, Technical University of Denmark, Søborg, Denmark
a r t i c l e
i n f o
Article history:
Received 19 April 2021
Revised 23 June 2021
Accepted 28 June 2021
Available online 3 July 2021
Keywords:
μ-SPE clean-up
Robotic system
Cereals
Pesticide residues
Evaluation study
a b s t r a c t
Food analysis is a tremendously broad field that is constantly evolving. New methods have emerged to increase productivity, such as modern miniaturized and robotic analytical techniques. In this paper, a microsolid-phase extraction system (μ-SPE) for clean-up was combined with a robotic autosampler to yield
ready-to-analyze extracts. The system was evaluated for its applicability in routine laboratories. The new,
automated, high-throughput μ-SPE clean-up method was applied to acetonitrile extracts and was developed for the analysis of pesticide residues in cereals by gas chromatography-Orbitrap mass spectrometry
(GC-Orbitrap-MS). The μ-SPE clean-up efficiency was demonstrated in the removal of matrix-interfering
components and in the recovery of pesticides. The sorbent bed mixture consisted of magnesium sulfate,
primary-secondary amine, C18 , and CarbonX, and effectively retained matrix components without loss of
target analytes. Analysis of five types of cereals (barley, oat, rice, rye, and wheat) by GC-Orbitrap-MS
showed that the method removed more than 70% of matrix components. The clean-up method was validated for 170 pesticides in rye, 159 pesticides in wheat, 142 pesticides in barley, 130 pesticides in oat,
and 127 pesticides in rice. Spike recovery values were 70–120% for all pesticides and the repeatability,
calculated as the relative standard deviation, was less than 20%. The limits of quantitation achieved were
0.005 mg kg−1 for almost all analytes, ensuring compliance with the maximum residue limits.
© 2021 The Author(s). Published by Elsevier B.V.
This is an open access article under the CC BY license ( />
1. Introduction
Pesticide residues, among the large variety of contaminants, are
continuously monitored and controlled to ensure legislative compliance. Pesticide residue analysis is crucial in estimating maximum residue limits, reviewing toxicological data, and ensuring
food safety. Similar to other food analysis applications, the sample
preparation step is often the key parameter in method development, particularly in the isolation and detection of contaminants.
Besides the accuracy and validity of the method, the time required
to complete the analytical process and the cost of the consumables (e.g., solvents and sorbents) used in the analysis are particularly considered. It is estimated that 60–80% of the work activity
and operational costs in analytical laboratories are spent preparing samples for analysis. It is also estimated that this step is responsible of 50% of the error in the final reported data [20]. There-
∗
Corresponding author.
E-mail address: (E. Hakme).
fore, faster, automated, cost-effective, and greener alternative sample preparation techniques with good accuracy are needed.
According to the literature, several sample preparation techniques, such as liquid-liquid extraction (LLE) [5], gel permeation
chromatography (GPC) [14], solid phase microextraction (SPME)
[24], and matrix solid phase dispersion [12], have been explored,
and some have been successfully applied to the multiresidue analysis of pesticides in food. Despite the effectiveness of these methods, the methods require large amounts of solvents, are time consuming and tedious, and require intense labor. The sample preparation approach known as QuEChERS (quick, easy, cheap, effective,
rugged, and safe), developed by Anastassiades et al. in 2003 [2],
met the changing needs of multiresidue analysis and has been successfully applied to the recovery of pesticide residues in food. In
2007, the QuEChERS-d-SPE was published by the Association of Official Analytical Chemists (AOAC, [3]) and by the European Committee for Standardization [6]. In its basic scheme, the method consists of an extraction with acetonitrile, partitioning with salts to
promote water separation from the organic solvent, and clean-up
of the final acetonitrile extract with dispersive solid phase extrac-
/>0021-9673/© 2021 The Author(s). Published by Elsevier B.V. This is an open access article under the CC BY license ( />
E. Hakme and M.E. Poulsen
Journal of Chromatography A 1652 (2021) 462384
tion (d-SPE) sorbents to remove organic acids, sugars, and polar
pigments.
SPE sorbents, used in dispersive form or packed in a cartridge,
are demonstrated suitable to a wide variety of food and agricultural products when appropriate adsorbing/sorbent materials are
selected [4,10,13]. The availability of pre-packaged dispersive kits
has enabled fast sample preparation and has added advantages
of the dispersive SPE (d-SPE) in terms of time and operational
conditions. However, some studies have shown that the clean-up
efficiency with cartridge-SPE is better than with d-SPE, because
there is better surface contact between the sorbent and the sample [1]. Moreover, cartridge-SPE permits either solvent reduction
or solvent exchange prior to clean-up, as well as the possibility
of using different solvent mixtures that effectively elute the target analytes, which preserves the accuracy of the method [22,23].
The main disadvantages of the cartridge-SPE are the extended operation time and procedure steps, the susceptibility to loss or
degradation of the target analytes, and other potential sources
of repeatability errors arising from the use of an SPE vacuum
manifold.
In recent years, much effort has been devoted to eliminate
these drawbacks. This has led to the development of robotic automated techniques. Currently, an automated micro-solid phase extraction (μ-SPE) clean-up method for acetonitrile extracts is available as an alternative to cartridge-SPE. μ-SPE is a simple scaledown or miniaturization of the cartridge-SPE procedure. The use of
automated μ-SPE clean-up was originally reported by Morris et al.
[17] for the analysis of pesticide residues in avocado and citrus.
Automated mini-SPE clean-up was also evaluated, and was found
to be efficient for the analysis of pesticide residues in spices, including chili powder, turmeric, black pepper, cumin, coriander, and
cardamom [11]. Lehotay et al. demonstrated the clean-up efficiency
of mini-SPE on avocado, salmon, pork loin, and kale [15]. Ederina
et al. demonstrated the efficiency of robotic mini-SPE clean-up for
the analysis of pesticides and their metabolites in catfish muscle
[18]. Pandey et al. also demonstrated the high-quality results of
this automated system for diverse types of analytes and food matricesf [19]. The automation of the μ-SPE method for the cleanup and pre-concentration of polyfloroalkyl substances from surface
water has also been demonstrated [16].
Laboratory automation is expected to increase in food testing
laboratories because of their time and space efficiency. Thus, it is
of great importance that laboratories adopt robotic automated systems that guarantee high sample throughput without much labor,
and that, most importantly, are reliable. The objective of this study
was to evaluate the performance of the automated μ-SPE technique in the analysis of 172 pesticide residues in cereals, and to
determine if the technique could be used in national and official
routine analysis laboratories. The μ-SPE clean-up method used in
this study consisted of a removal/trapping strategy, where the matrix components were retained and the analytes of interest were
eluted. Since the procedure is intended to be scaled-up for application to all raw cereal products, five cereal matrices were selected for the validation study. Most of the pesticides included in
this study are included in the EU multi-annual control program [7].
Two evaluation studies were designed to demonstrate the cleanliness of the extract and the clean-up efficiency. In the first, blank
extracts subjected to automated μ-SPE clean-up were compared
to extracts subjected to d-SPE clean-up. In the second study, acetonitrile extracts were spiked with pesticides prior to clean-up to
demonstrate the recovery efficiency of the method. Finally, the
method was validated according to the guidance document on analytical quality control and method validation procedures for pesticide residues and analysis in food and feed [9] in terms of linearity, recovery, and repeatability. The matrix effect of each cereal
was evaluated for quantitation purposes.
2. Material and methods
2.1. Chemicals
Pesticide standards (purity >96%) were purchased from SigmaAldrich and LGC Standards. Pesticide standard stock solutions of
1 mg mL−1 were prepared in toluene and stored at −18 °C in ampoules under an argon atmosphere. A standard solution of 10 μg
mL−1 was prepared from these stock solutions. Working calibration
standard solutions were prepared by diluting 1:1 (v/v) with acetonitrile to obtain five concentration levels: 0.2 μg mL−1 , 0.0667 μg
mL−1 , 0.02 μg mL−1 , 0.0067 μg mL−1 , and 0.002 μg mL−1 . Acetonitrile (HPLC Grade 5) was purchased from Rathburn Chemicals.
μ-SPE cartridges (Cart-uSPE-GC-QUE-0.3 mL) were purchased from
CTC-Analytics. Supel TM QuE QuEChERS tubes containing 4 g magnesium sulfate (MgSO4 ), 1 g sodium chloride (NaCl), 0.5 g sodium
citrate sesquihydrate, and 1 g sodium citrate dihydrate were purchased from Thermo Scientific. The clean-up sorbent SupelTM QuE
(EN) tubes were purchased from Supelco.
2.2. Extraction method
The samples were extracted using the citrate-buffered QuEChERS (EN 15662) (CEN 2008) method without clean-up. In brief, 5 g
of each sample was prepared. The procedural standard dichlorvosd6 was added to all samples before extraction. Then, 10 mL cold
water was added, followed by 10 mL acetonitrile. To aid the extraction, a ceramic homogenizer was used. The tubes were shaken for
1 min by hand. Next, 4.0 g of MgSO4 , 1.0 g NaCl, 1.0 g sodium citrate dihydrate, and 0.5 g sodium citrate sesquihydrate were added.
After 1 min of shaking by hand and centrifugation for 10 min at
4500 rpm, 8 mL of the supernatant was transferred to a clean
tube and stored at –80 °C for at least 1 h. The extracts were then
thawed, and while they were still very cold, they were centrifuged
at 4500 rpm for 5 min at 5 °C. Thereafter, 6 mL of the cold supernatant was collected.
For the μ-SPE automated clean-up, the extracts were diluted
(1:1 v/v) with acetonitrile and placed in 1 mL glass vials on the
sample tray of the robotic autosampler. A minimum volume of 500
μL is recommended to avoid the aspiration of air bubbles into the
10 0 0 μL μ-SPE syringe, or else the syringe depth in the instrumental method should be modified accordingly. Triphenyl phosphate
(15 μl of a 0.1 μg mL−1 internal standard solution) which is used
as an internal standard to check the performance of the injection
system of the instrument, was added automatically on the robotic
autosampler.
For the d-SPE clean-up, a dispersive sorbent mixture consisting of 150 mg PSA and 900 mg MgSO4 was added to the 6 mL
extract. The tubes were shaken for 30 s, and then centrifuged at
4500 rpm for 5 min at room temperature. After centrifuging, 4 mL
supernatant was collected and 5% formic acid was added. The extracts were diluted (1:1 v/v) in 1 mL glass vials with acetonitrile,
and the internal standard (triphenyl phosphate) was added.
2.3. Chromatographic separation and high-resolution mass
spectrometry
The analyses were performed on an GC-Exactive MS (Thermo
Fisher Scientific), consisting of a Trace 1300 Series GC, a TriPlus
RSH Autosampler GC-liquids, and an Exactive GC-Orbitrap-MS.
The samples were injected in a programmable temperature vaporizer (PTV) through a PTV baffle liner (2 × 2.75 × 120 mm)
designed for Thermo GCs (Siltek). The injection volume was 1 μL
and the injection temperature was set to 70 °C. Helium was used
as the carrier gas at a flow rate of 1.2 mL/min for analyte separation on a Thermo Scientific Trace GOLD TG-5SILMS column (30 m
2
E. Hakme and M.E. Poulsen
Journal of Chromatography A 1652 (2021) 462384
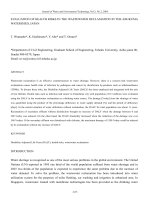
Fig. 1. Schematic of the TriPlus RSH robotic PAL autosampler.
length × 0.25 mm i.d. × 0.25 μm film thickness). The GC oven program started with an initial temperature of 60 °C, which was held
for 1.5 min, followed by a ramp of 25 °C/min to 90 °C. This temperature was held for 1.5 min, followed by a ramp of 25 °C/min up
to 180 °C, then up to 280 °C at 5 °C/min. Finally, to clean the column, the temperature was raised to 300 °C at a rate of 10 °C/min
and held for 12 min.
The analyses were performed in electron ionization (EI) positive
mode. Eluting peaks were transferred through an auxiliary transfer
line into the EI source. The EI source and the transfer line temperatures were set to 280 °C. The instrument operated at a resolution of 60k and the automatic gain control (AGC) target was set
to 1 × 10⁶ . The MS data were acquired in a scan mode covering a
mass range from 50 to 500 m/z.
The instrument was tuned using the Thermo Scientific Exactive
GC Tune software (v 2.9 SP3 Build 290204). The vacuum inside
the Orbitrap Analyzer was maintained below 1 × 10⁻⁹ mbar. The
instrument method was developed on Thermo Scientific XCalibur
software. The full scan MS data were processed using a quantitation master method on the Thermo Scientific TraceFinder 4.1 software. The studied compounds were transferred into the quantitation method from an in-house compound database. The database
included retention time, target ion, and at least 2 confirming ions
for each compound. The Genesis algorithm was used for peak integration. The method is shown in the Supplementary Material.
tosampler. It uses two solvents: acetonitrile (fast wash station position 1) and a mixture of acetonitrile, methanol, and water (1:1:1
v/v/v) (fast wash station position 2).
The μ-SPE tray holder, also attached to the PAL bus, has three
slots. The first slot is the sample tray where the crude extracts obtained from acetonitrile extraction were placed. The second slot
is the eluate tray where empty vials were placed to collect the
cleaned-up μ-SPE extracts. μ-SPE cartridges were placed in the
third slot.
2.5. μ-SPE clean-up workflow
Table 1 shows the automatic μ-SPE program steps and their
duration. In the automatic tool change station, the 10 0 0 μL μSPE syringe was automatically selected. The syringe was robotically
moved to the fast wash station module and rinsed with pure acetonitrile (2 rinsing cycles). A 300 μL aliquot of crude extract was
loaded into the syringe after 3 filling strokes. The tool with the
filled μ-SPE syringe was moved to the third slot to pick one μ-SPE
cartridge and then back to the eluate tray to load the extract into
the cartridge. Approximately 240 μL cleaned extract was eluted at
a flow rate of 30 μL s−1 and collected in the empty vial placed
in the eluate tray. Once the clean-up was completed, the syringe
was moved back to the fast wash station to be rinsed again with
Table 1
Automatic μ-SPE program steps with a total duration of 13 min.
2.4. TripPlus RSH autosampler
The μ-SPE system is coupled to the GC-Orbitrap-MS. The TriPlus
RSH robotic PAL autosampler comprises three tools: the μ-SPE tool
(LS3) that holds a 10 0 0 μL syringe, the analyte protectant or internal standard tool that holds a 25 μL syringe (LS2), and the injection tool (LS1) that holds a 10 μL syringe. A schematic of the
robotic PAL autosampler is presented in Fig. 1.
The system also contains a standard wash module, a solvent
station module, and a fast wash module. The solvent station module was not used because the experiment was done without conditioning of the cartridges and without additional solvent elution,
which also saved solvents and time. The standard wash module
tray holds 2 mL glass vials, reserved for internal standards or analyte protectants, and three 25 mL glass vials, reserved for aliquots
of blank extracts or acetonitrile for automated matrix-matched calibration curves and automated sample dilution, respectively. The
fast wash station for fast syringe washing is connected to the au-
Time (mm:ss)
Steps
0:30
Required tool selected
Syringe wash: 2 cycles at wash position 1
Load sample onto μ-SPE
Perform 3 filling strokes
Load sample onto μ-SPE cartridge: 300 μL
Syringe wash: 2 cycles at wash position 1
Required tool selected
Syringe wash: 2 cycles at wash position 1
Rinse
Add 15 μL internal standard
Perform 3 filling strokes
Add internal standard: 15 μL
Required tool selected
Syringe wash: 1 cycle at wash position 2
Rinse
Move to sample at position 1
Perform 3 filling strokes
Aspirate 1 μL
Inject sample
01:30
04:30
05:30
06:30
07:30
08:30
09:30
10:30
11:30
12:00
13:00
3
E. Hakme and M.E. Poulsen
Journal of Chromatography A 1652 (2021) 462384
acetonitrile (2 rinsing cycles). The tool holding the 25-μL syringe
was then selected. The syringe was moved to the fast wash module to be washed with acetonitrile (2 cycles). The syringe was then
moved to the standard wash module. After 3 filling strokes, 15 μL
internal standard was added to the cleaned-up extract. Then, the
required injection tool, holding a 10-μL syringe, was selected. The
syringe was washed with the acetonitrile, methanol, and water solvent mixture (one rinsing cycle). The syringe was moved to the
eluate tray. Three filling strokes were performed before 1 μL was
aspirated and injected.
For this purpose, a semi-procedural standard calibration was
prepared by spiking a series of blank test portions of rye with different amounts of analyte just before the clean-up step. It is referred to it as a “semi-procedural calibration” because the spiking
was done just prior to clean-up, and not prior to the whole extraction method. The extracts (0.5 g mL−1 matrix) obtained from the
QuEChERS extraction were diluted 1:1 with a standard mixture of
172 pesticides prepared in acetonitrile at 0.2 μg mL−1 , 0.0667 μg
mL−1 , 0.02 μg mL−1 , 0.0067 μg mL−1 , and 0.002 μg mL−1 . The final
concentrations prepared were 100 μg kg−1 , 33 μg kg−1 , 10 μg kg−1 ,
3 μg kg−1 , and 1 μg kg−1 , respectively. The vials were placed on
the robotic autosampler for automated μ-SPE clean-up. The amount
of cleaned-up matrix injected in this experiment was 0.25 g mL−1 .
The semi-procedural standard calibration was compared to a
matrix-matched calibration. The set of matrix-matched calibration
curves was prepared using the blank extracts (0.5 g mL−1 blank
matrix extract obtained from the QuEChERS extraction). The extracts were placed on the robotic autosampler for μ-SPE cleanup. After clean-up, the eluates were diluted 1:1 with a series of
standards, giving a series of matrix-matched calibration samples at
100 μg kg−1 , 33 μg kg−1 , 10 μg kg−1 , 3 μg kg−1 , and 1 μg kg−1 . The
amount of matrix injected onto the GC system was 0.25 g mL−1 ,
which enabled the comparison of the two calibrations. In this latter calibration, the pesticides were not loaded into the μ-SPE cartridge; therefore, the matrix-matched calibration was considered a
reference calibration to evaluate pesticide recovery.
The slopes of the two calibration curves were compared. The
data obtained from this experiment were also processed to calculate the pesticide recovery after the robotic μ-SPE clean-up.
2.6. Experiment 1: extract cleanliness assessment
Whether cartridge-SPE, d-SPE, or μ-SPE, the critical piece in all
SPE methods is the selection of the sorbent. It is necessary to
consider chemical and physical characteristics that allow maximal
interaction between the sorbent and the analytes, which ensures
selectivity of extraction, removal, or preconcentration of analytes
present in analytical matrices. In order to check the cleanliness
of the extracts obtained with μ-SPE, blanks of barley, wheat, oat,
rice, and rye were extracted using both the conventional QuEChERS
extraction method with manual dispersive SPE clean-up and the
robotic μ-SPE clean-up system. Both extracts were injected onto
the GC-Orbitrap-MS. The same amount of matrix was used in both
SPE methods, both in the clean-up step (0.5 g mL−1 ) and in the
injection step (0.25 g mL−1 , following a 1:1 dilution with acetonitrile). In these comparison experiments, two factors were considered: differences in automation and sorbents. In the manual dSPE clean-up, 25 mg of PSA/mL of extract and 150 mg of MgSO4
/mL of extract were used. In the μ-SPE, 40 mg of PSA/mL of extract and 66 mg of MgSO4 /mL of extract were used, in addition to
40 mg/mL of C18 and 66 mg/mL of CarbonX.
The total ion chromatograms (TICs) of blanks obtained with
the two different clean-up procedures were overlaid using XCalibur software. For a closer examination of the clean-up effectiveness, the deconvolution plugin software (v 1.3), in conjunction with
the TraceFinder software (v 4.1), was used. The software automatically deconvoluted coeluted chromatographic peaks into multiple
components by aligning mass spectral peaks, according to their
slightly different retention times. The software also automatically
performed a peak search and a library search. Combined with the
unknown screening functionality of TraceFinder software, the deconvolution software was used to do a cross-sample overlay of analytes.
2.8. Experiment 3: method validation
Method validation was performed according to SANTE/
12682/2019 guidelines. Five sets of semi-procedural calibration curves were prepared using extracts of blank samples of
each of the five matrices (barley, oat, rice, rye, and wheat) as
described in the previous section. The extracts were cleaned-up
using the automatic μ-SPE robotic system. The linearity range
was determined for the 172 compounds in the 0.0033 - 0.1 μg
mL−1 range. In gas or liquid chromatography systems, the matrix
effect is caused by the unwanted interference of compounds
during ionization in the MS source or during injection, and it
can dramatically influence the analysis for both identification and
quantification of an analyte. Usually, the matrix effect is calculated
as the percentage difference between the slopes of the matrixmatched calibration curves and the solvent calibration curve. In
this study, the matrix effect was investigated by comparing the
slopes of the semi-procedural calibration curves, obtained with
barley, rice, oat, and wheat, to the semi-procedural calibration
curves prepared with rye, which was chosen as a representative
matrix among the cereals included in the current study. The rye
matrix provides good protection of analytes and has a moderate
matrix effect compared to those of other cereal matrices.
Five samples each of barley, oat, rice, rye and wheat matrices were spiked before extraction at each of three concentration
levels (5 μg kg−1 , 10 μg kg−1 , and 50 μg kg−1 ) to study the extraction effectiveness. Therefore, in total, the validation study was
performed on 75 spiked samples. The trueness and the precision
of the method were evaluated by calculating the recovery and
the repeatability, respectively. Acceptable mean recovery is usually
within the range of 70 – 120%. Repeatability refers to the variation
in repeated measurements made on the same subject under identical conditions. Therefore, repeatability was evaluated by calculating
the relative standard deviation (RSD) based on the recovery results
of the five spiked samples of each matrix at each spiking concentration level. The precision of the method was also investigated by
2.7. Experiment 2: calibration assessment
In order to evaluate the possible loss of pesticides during cleanup by μ-SPE, and to assess if a procedural standard calibration was
required, a preliminary evaluation study was carried out before
proceeding with the validation study. Matrix-matched calibrations
are routinely used for quantitation of pesticide residues in food
matrices, and they use standards prepared from blank extracts of
the same matrix. The blanks used to prepare matrix-matched calibrations were extracted in the same manner as the samples. After
extraction and clean-up, the blank extracts were diluted with a series of calibration standards. The procedural standard calibration
approach is typically used when dealing with difficult matrices to
compensate for matrix effects and low extraction recovery associated with certain pesticide/commodity combinations. It consists
of spiking a series of blank test portions with different amounts
of analytes prior to extraction. In order to assess the clean-up efficiency, the matrix effect, and the recovery of pesticides on the
robotic μ-SPE system, rather than in the whole acetonitrile extraction method, blanks of rye were spiked before and after the cleanup step.
4
E. Hakme and M.E. Poulsen
Journal of Chromatography A 1652 (2021) 462384
calculating the reproducibility, which was derived from the range
of recovery results obtained with different matrices of the cereals
at each of the concentration levels.
3.3. Experiment 2: calibration assessment
The deviation between the slopes of the matrix-matched calibration and the semi-procedural-standard calibration was less than
25% for almost all of the compounds. Additionally, pesticide recovery was calculated at each of the five spiked levels. This recovery
study is not a full validation study, but rather an estimation of
the pesticide recovery (or loss) and an assessment of the robotic
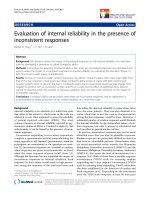
clean-up method. Recovery results between 70 - 120% were considered successful. Fig. 4 shows the percentage of compounds recovered after clean-up at the five different spiked concentration
levels. Almost all of the compounds were successfully recovered
at a concentration level of 100 μg kg−1 . For instance, at each of
the concentration levels (100, 33, 10, 3, and 1 μg kg−1 ), 98%, 94%,
112%, 99%, and 109% of toclophos-methyl were recovered, respectively. Poorer results were obtained with ditalimphos, where only
58%, 59%, 57%, 55%, and 50% of the analyte were recovered from
the samples with concentration levels of 100, 33, 10, 3, and 1 μg
kg−1 , respectively. Some compounds, such as spiroxamine, fenhexamid, fenpropidin, deltamethrin, and iprodione were not recovered
at high levels. For the first two acidic compounds and the cationic
potential compound (fenpropidin), recovery values obtained were
less than 15%, probably due to interaction with PSA. The two latter
compounds exhibited a signal enhancement after passing through
the μ-SPE, with recovery around 140%. On average, 85% of the compounds were successfully recovered at the levels of 33, 10, and
3 μg kg−1 . The highest percentage of compounds (27%) was lost in
the lowest spiking level (1 μg kg−1 ) during the clean-up, likely by
adsorbing onto the μ-SPE bed sorbents. Compound loss could also
have occurred in the injector. In the injector, matrix components
protect the analytes from thermal decomposition and block them
from adsorption onto the active sites of the GC system. Thus, in
a cleaner extract, compounds are no longer protected from degradation. According to SANTE guidelines, recovery values outside the
70 - 120% range can be accepted if the results are consistent, and a
correction factor can be applied. However, due to the very low recovery of the compounds as mentioned above, a correction factor
for recovery was not used. Instead, a more accurate approach was
adopted, which consisted of the use of a semi-procedural standard
calibration for routine analysis.
Therefore, in the light of these results, a semi-procedural standard calibration was used for accurate quantitative method validation, and it is recommended for use in routine analysis to compensate for possible clean-up automation and extraction efficiency
errors or the retention/loss of compounds, especially at the lowest
concentration levels.
3. Results and discussion
3.1. Performance expectations of the automated sample preparation
system
The time needed for performing manual d-SPE clean-up on a
batch of four samples was approximately 14 min. The addition of
clean-up salts to the collected QuEChERS extracts took 2 min. Mixing using an automatic agitator took 1 min. Centrifugation was performed in 5 min, according to the citrate-buffered QuEChERS (EN
15662) (CEN 2008) method. Collecting the final extracts took up
to 4 min, and the addition of the internal standard was achieved
in 2 min, resulting in a total clean-up time of 14 min. Using the
robotic μ-SPE, the automated clean-up and addition of the internal standard for a batch of 4 samples took a total of 52 min
(13 min/sample). Surface-level thinking would lead to the conclusion that the automated μ-SPE system is not advantageous in terms
of saving time. However, a robotic system that could be operating
24/7 undoubtedly enables higher productivity because more samples can be processed outside of the normal work schedule or even
overnight. Hence, overall, the robotic system results in a significant
reduction of labor. Moreover, the automated μ-SPE system allows
more consistent preparation by avoiding human laboratory errors
in the final clean-up step.
Although the system was coupled to the GC-Orbitrap-MS, the
autosampler was not equipped with a cooling system. With a nonthermostatic autosampler, samples had to stand in the sample
tray at room temperature for a long time, since the GC analysis time of each injection was 45 min. Therefore, in the case of
non-availability of a thermostatic tray, a stand-alone robotic μ-SPE
clean-up system is recommended. Yet, a μ-SPE coupled to a chromatographic and spectrometric system would be advantageous, because the clean-up of an extract can be performed while another
extract is being analysed.
3.2. Experiment 1: extract cleanliness assessment
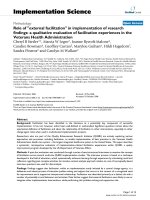
The integrated area of the TIC obtained with a blank of wheat
extract (0.5 g mL−1 ) cleaned-up with d-SPE was 1.2 × 10⁹ . The integrated area of the TIC of the same blank (0.5 g mL−1 ) after μ-SPE
clean-up was 3.34 × 10⁸ . The μ-SPE method resulted in the removal of approximately 70% more matrix interferences than the dSPE method. Fig. 2 shows the overlay of the TICs of the two blanks.
The TIC corresponding to d-SPE shows the most intense peaks at
9.34 min (corresponding to linoleic acid (C18 H32 O2 )), at 16.7 min
(corresponding to linolenic acid (C18 H30 O2 )), and at 31.47 min (corresponding to campesterol (C28 H48 O)). The comparison of these
profiles showed that the extract obtained with d-SPE seems to
have had a higher concentration of interfering compounds or matrix components. In the μ-SPE sample, these unwanted matrix
components remained bound to the μ-SPE sorbent and had a much
lower concentration in the final extracts. The two adsorbents (C18
and CarbonX) embedded in the μ-SPE cartridge also allowed the
adsorption and removal of fatty acids and other matrix interference
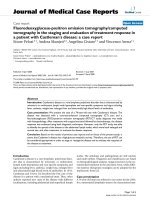
compounds. Fig. 3 shows the cross-sample peak overlay of lignoceric acid methyl ester, a saturated fatty acid with the chemical
formula C23 H47 COOH, in rye blanks after d-SPE and μ-SPE cleanup methods. The most effective removal of this matrix interference compound was by μ-SPE. Moreover, the number of peaks detected in a blank of rye after deconvolution analysis was 172 and
123 peaks for d-SPE and μ-SPE, respectively. The same results were
observed with the four other cereal matrices.
3.4. Experiment 3: method validation
The method showed a linear response over the studied concentration range of 1–100 μg kg−1 with the four matrices, and it
had a coefficient of correlation greater than 0.99. The matrix effect percentage was calculated for each of the 172 pesticides. Fig. 5
shows the percentage of compounds that exhibited a weak, moderate, and strong matrix effect. The matrix effect is caused by coeluting compounds from the matrix, which generate a signal suppression or enhancement. A strong matrix effect corresponds to a
value above ±50%. A weak matrix effect is less than ±25%. A moderate matrix effect is between ±25% and ±50%. An efficient extraction and clean-up method will generate clean extracts and retention of all matrix-interfering components, and thus will have a
smaller matrix effect. A weak matrix effect was observed for 75%
of the compounds in wheat, in comparison to rye. For oat and barley matrices, in comparison to rye, 65% of the compounds showed
a weak matrix effect. In rice, 45% of the compounds showed weak
matrix effect. A moderate matrix effect was observed for 14% of
5
E. Hakme and M.E. Poulsen
Journal of Chromatography A 1652 (2021) 462384
Fig. 2. Total ion chromatograms of a blank of wheat extracted with d-SPE (blue) and μ-SPE clean-up (red).
Fig. 3. Cross-sample peak overlay of lignoceric acid methyl ester in 0.5 g mL−1 rye blank extracted with d-SPE (black; peak area: 5667.091), μ-SPE clean-up of 0.5 g mL−1
matrix (red; peak area: 75.399), and μ-SPE clean-up of 0.25 g mL−1 matrix (green; peak area: 420.236).
Fig. 4. Percentage of compounds with recoveries within the range 70–120% after
clean-up of acetonitrile extracts spiked at five concentration levels of spiking (1, 3,
10, 33, 100 μg kg−1 ).
Fig. 5. Percentage of compounds showing a weak (±25%), moderate (ǀ25–50ǀ%), and
strong (>± 50%) matrix effect in the barley, oat, rice and wheat matrices compared
to the rye matrix.
the compounds in barley, 8% of the compounds in oat, 25% of the
compounds in rice, and 17% of the compounds in wheat. The obvious explanation for a weak-to-moderate matrix effect is that the
matrix-interfering components were successfully retained by the
μ-SPE sorbents. Although matrix effect was not significant compared to rye, signal enhancement between 0 and +20% was observed for almost all pesticides in wheat, but mainly in rice, barley, and oat. For all compounds showing a weak-to-moderate matrix effect, the matrix-matched calibration prepared with the rye
blank was used for the qualitative and quantitative analyses of
those compounds in different kinds of cereal samples (barley, oat,
rice, and wheat). Preparing semi-procedural calibration curves with
each type of cereals is a tremendous effort in routine analysis laboratories, and a significant reduction of labor is achieved by preparing one semi-procedural calibration with rye.
A strong matrix effect was observed for 9% of the compounds in
wheat, 14% of the compounds in barley, 27% of the compounds in
oat, and 30% of the compounds in rice. The more complex a ma6
E. Hakme and M.E. Poulsen
Journal of Chromatography A 1652 (2021) 462384
Fig. 6. Extracted chromatograms of pirimiphos-methyl and chlormephos at a spiking level of 5 μg kg−1 in rye, wheat, barley, oat, and rice.
trix, and the higher the amount of fatty components it contains,
the stronger the matrix effect. Cereal grain is a complex, heterogeneous mixture of a relatively wide range of chemical substances.
The gross composition differs among cereals. The total amount of
fatty acids in wheat, rye, barley, rice, and oat are 2, 2.3, 2.4, 2.9,
and 6.5 g per 100 g matrix, respectively [21], which explains why
the strongest matrix effect was observed in rice (30% of the compounds) and in oat (27% of the compounds). In cases of a strong
matrix effect, the analyte should be quantified using standard ad-
dition or an external matrix-matched calibration prepared with the
same matrix as the sample. Therefore, using a semi-procedural calibration of rye, the current study validated 170, 159, 142, 130, and
127 compounds in rye, wheat, barley, oat, and rice, respectively.
Table 2 shows the limit of quantitation (LOQ), recovery, repeatability obtained for each compound at the spiking levels of 5, 10,
and 50 μg kg-1, and the corresponding MRLs. Successful results
had a recovery between 70 and 120% and a relative standard deviation (RSD) of less than 20%. These analytical figures validate the
7
E. Hakme and M.E. Poulsen
Journal of Chromatography A 1652 (2021) 462384
Table 2
Compound recoveries (%), LOQs (mg kg−1 ), repeatability (%) for each spiking level in cereal matrices, and corresponding MRLs (EU pesticides
database, 2021) [8].
1
2
3
4
5
6
7
8
9
10
11
12
13
14
15
16
17
18
19
20
21
22
23
24
25
26
27
28
29
30
31
32
33
34
35
36
37
38
39
40
41
42
43
44
45
46
47
48
49
50
51
52
53
54
55
56
57
58
59
60
61
62
63
64
65
66
67
68
69
Compound
MRL (mg.kg−1 )
Matrix
LOQ (mg kg−1 )
Spiking levels (mg kg−1 )
Recovery% (RSD)
0.005
0.01
0.05
Acrinathrin
3-Hydroxycarbofuran
Aldrin
Atrazine
Azinphos-ethyl
Azinphos-methyl
Azoxystrobin
Bifenthrin
Bitertanol
Boscalid
Bromophos-ethyl
Bromopropylate
Bromuconazole
Bupirimate
Buprofezin
Cadusafos
Carbofuran
Carbosulfan
Carboxin
Chlorfenapyr
Chlorfenson
Chlorfenvinphos
Chlormephos
Chlorobenzilate
Chlorpropham
Chlorpyrifos
Chlorpyrifos-methyl
Clomazone
Cyfluthrin
Cyhalothrin-lambda
Cypermethrin
Cyproconazole
Cyprodinil2
Demeton-S-methyl
Diazinon
Dichlorvos
Dicloran
Dicofol
Dieldrin
Difenoconazole
Dimethoate
Dimethomorph
Diphenylamine
Disulfoton
Ditalimphos
DMST
Endosulfan-alpha
Endosulfan-beta
Endosulfan-sulfate
Endrin
EPN
Epoxiconazole
Ethiofencarb
Ethion
Ethoprophos
Ethoxyquin
Etofenprox
Fenamiphos
Fenamiphos-sulfone
Fenarimol
Fenazaquin
Fenbuconazole
Fenhexamid
Fenitrothion
Fenoxycarb
Fenpropathrin
Fenpropidin
Fenpropimorph
Fenson
0.01
0.013
0.011
0.05
0.05
0.01
0.52
0.012
0.01
0.82
0.01
0.01
0.032
0.05
0.01
0.01
0.011
0.011
0.031
0.02
0.01
0.01
0.013
0.02
0.01
0.01
0.01
0.01
0.04
0.051 , 2
22
0.12
0.5
0.021 , 2
0.01
0.01
0.02
0.02
0.011
0.1
0.022
0.01
0.05
0.022
0.013
0.013
0.051
0.051
0.051
0.01
0.013
0.62
0.013
0.01
0.02
0.05
0.01
0.021
0.021
0.02
0.01
0.12
0.01
0.05
0.01
0.01
0.12
0.152
0.013
Barley, oat, rye, and wheat
0.005
104 (15)
86 (10)
79 (19)
Barley, oat, rice, rye, and wheat
Barley, oat, rice, rye, and wheat
Rye and wheat
Rye and wheat
Rye and wheat
Barley, oat, rice, rye, and wheat
Rye
Barley, rye, and wheat
Barley, oat, rice, rye, and wheat
Barley, oat, rice, rye, and wheat
Barley, oat, rice, rye, and wheat
Barley, oat, rice, rye, and wheat
Barley, oat, rice, rye, and wheat
Barley, oat, rice, rye, and wheat
Rye
Barley, oat, rice, rye, and wheat
Barley, oat, rice, rye, and wheat
Barley, oat, rice, rye, and wheat
Barley, oat, rice, rye, and wheat
Barley, oat, rice, rye, and wheat
Barley, oat, rice, rye, and wheat
Barley, oat, rice, rye, and wheat
Barley, oat, rice, rye, and wheat
Barley, oat, rice, rye, and wheat
Barley, oat, rice, rye, and wheat
Barley, oat, rice, rye, and wheat
Rye and wheat
Barley, oat, rye, and wheat
Barley, rye, and wheat
Barley, oat, rice, rye, and wheat
Barley, oat, rice, rye, and wheat
Barley, oat, rice, rye, and wheat
Barley, oat, rice, rye, and wheat
Barley, oat, rice, rye, and wheat
Barley, oat, rice, rye, and wheat
Barley, oat, rice, rye, and wheat
Barley, oat, rice, rye, and wheat
Barley, oat, rice, rye, and wheat
Barley, oat, rice, rye, and wheat
Barley, rice, rye, and wheat
Barley, rice, rye, and wheat
Barley, oat, rice, rye, and wheat
Barley, oat, rice, rye, and wheat
Barley, oat, rice, rye, and wheat
Barley, oat, rice, rye, and wheat
Barley, oat, rice, rye, and wheat
Barley, oat, rice, rye, and wheat
Barley, oat, rice, rye, and wheat
Barley, oat, rice, rye, and wheat
Barley, oat, rice, rye, and wheat
Barley, oat, rice, rye, and wheat
Barley, oat, rice, rye, and wheat
Barley, oat, rice, rye, and wheat
Barley, oat, rice, rye, and wheat
Rye and wheat
Barley, oat, rice, rye, and wheat
Rye
Barley, oat, rice, rye, and wheat
Barley, oat, rice, rye, and wheat
Rye and wheat
Barley, rice and rye
Barley, oat, rice, rye, and wheat
Rye
Barley, oat, rice, rye, and wheat
Rye
Barley, oat, rice, rye, and wheat
Barley, oat, rice, rye, and wheat
0.005
0.005
0.005
0.01
0.01
0.005
0.05
0.01
0.005
0.005
0.005
0.005
0.005
0.005
0.005
0.005
0.005
0.005
0.005
0.005
0.005
0.005
0.005
0.005
0.005
0.005
0.01
0.005
0.05
0.005
0.005
0.005
0.005
0.05
0.005
0.005
0.005
0.005
0.005
0.05
0.005
0.005
0.005
0.005
0.005
0.005
0.005
0.005
0.005
0.005
0.05
0.005
0.005
0.005
0.005
0.005
0.005
0.005
0.005
0.005
0.05
0.005
0.005
0.005
0.05
0.005
0.005
77 (7)
95 (9)
112 (11)
75
82
86
87
86
90
73 (8)
85 (6)
83 (10)
80 (13)
101 (9)
84 (10)
97 (6)
99 (16)
82 (7)
90 (9)
94 (8)
91 (7)
89 (6)
79 (8)
101 (12)
91 (5)
86 (9)
96 (6)
94 (8)
88 (9)
91 (11)
95 (7)
91 (7)
84 (5)
83 (8)
85 (13)
98 (15)
96 (14)
88 (12)
96 (8)
82 (9)
81 (10)
88 (5)
77 (20)
84 (8)
97 (8)
85 (6)
90 (17)
85 (12)
113 (11)
72 (12)
79 (6)
82 (17)
84 (18)
85 (6)
82 (6)
86 (8)
82 (6)
95 (10)
93 (9)
78 (14)
92 (9)
93 (6)
48 (17)
87 (10)
98 (15)
75 (7)
99 (11)
85 (14)
97 (8)
114 (18)
86 (8)
119 (11)
95 (12)
102 (14)
74 (17)
93 (5)
121 (8)
125 (9)
95 (9)
114 (7)
107 (8)
106 (8)
109 (14)
92 (5)
98 (6)
103 (8)
102 (6)
99 (16)
98 (10)
111 (12)
86 (8)
106 (9)
89 (10)
99 (9)
104 (9)
115 (6)
(16)
(8)
(10)
(14)
(8)
(7)
96 (20)
106 (10)
84 (5)
90 (6)
92 (5)
90 (7)
87 (7)
79 (12)
104 (16)
88 (7)
84 (6)
89 (6)
91 (5)
88 (9)
90 (36)
89 (7)
90 (13)
88 (8)
88 (8)
77 (7)
96 (11)
91 (12)
110 (9)
89 (9)
101 (13)
96 (8)
93
80
77
89
94 (11)
109 (16)
91 (9)
111 (12)
112 (12)
89 (7)
111 (11)
84 (5)
86 (6)
85 (11)
74 (10)
81 (7)
91 (11)
106 (12)
86 (9)
90 (11)
112 (11)
91 (10)
109 (14)
87 (11)
74
77
70
76
85
83
90
83
91
98
(11)
(12)
(11)
(21)
(5)
(6)
(5)
(6)
(8)
(7)
113 (8)
106 (8)
81 (7)
95 (10)
109 (19)
115 (8)
109 (8)
110 (8)
112 (12)
91
99
67
82
97
98
95
95
90
(7)
(8)
(12)
(8)
(11)
(4)
(7)
(10)
(15)
112 (10)
100 (5)
115 (9)
85 (8)
98 (1)
94 (6)
92 (13)
98 (9)
78 (14)
87 (7)
(7)
(8)
(12)
(9)
(continued on next page)
8
E. Hakme and M.E. Poulsen
Journal of Chromatography A 1652 (2021) 462384
Table 2 (continued)
Compound
70
71
72
73
74
75
76
77
78
79
80
81
82
83
84
85
86
87
88
89
90
91
92
93
94
95
96
97
98
99
100
101
102
103
104
105
106
107
108
109
110
111
112
113
114
115
116
117
118
119
120
121
122
123
124
125
126
127
128
129
130
131
132
133
134
135
136
137
138
139
Fenthion
Fenthion-sulfone
Fenthion-sulfoxide
Fenvalerate
Fipronil
Fluazifop-butyl
Fludioxonil
Flufenoxuron
Fluquinconazole
Flusilazole
Flutriafol
Fluvalinate-tau
Formothion
Fosthiazate
HCH-alpha
HCH-beta
Heptenophos
Hexaconazole
Imazalil
Indoxacarb
Iprodione
Iprovalicarb
Isofenphos-methyl
Isoprothiolane
Isoproturon
Jodfenphos
Kresoxim-methyl
Lindane
Linuron
Malaoxon
Malathion
Mecarbam
Mepanipyrim
Metalaxyl
Metconazole
Methacrifos
Methidathion
Methiocarb
Methiocarb-sulfone
Methoxychlor
Metribuzin
Mevinphos
Monocrotophos
Monolinuron
Myclobutanil
Nuarimol
Ofurace
Omethoate
Oxadixyl
Paclobutrazol
Paraoxon-methyl
Parathion
Parathion-methyl
Penconazole
Pencycuron
Pendimethalin
Permethrin
Phenthoate
Phosalone
Phosmet
Phosphamidon
Pirimicarb
Pirimicarb-desmethyl
Pirimiphos-methyl
Prochloraz
Procymidone
Profenofos
Propargite
Propiconazole
Propoxur
MRL (mg.kg−1 )
1
0.01
0.011
0.011
0.22
0.051
0.01
0.01
0.01
0.01
0.01
0.152
0.052
0.01
0.02
0.01
0.01
0.013
0.01
0.01
0.01
0.01
0.01
0.013
0.012
0.01
0.013
0.082
0.01
0.01
81
81
0.01
0.01
0.011 , 2
0.062
0.01
0.022
0.11
0.11
0.01
0.1
0.01
0.02
0.01
0.01
0.013
0.013
0.012
0.01
0.01
0.021
0.052
0.021
0.01
0.05
0.05
0.05
0.013
0.01
0.052
0.01
0.05
0.013
0.52
0.21 , 2
0.01
0.01
0.01
0.092
0.05
LOQ (mg kg−1 )
Matrix
Spiking levels (mg kg−1 )
Recovery% (RSD)
0.005
0.01
0.05
74
91
95
82
88
91
89
87
92
92
93
89
(6)
(6)
(10)
(58)
(9)
(7)
(6)
(8)
(13)
(6)
(8)
(7)
90
86
88
85
81
91
91
86
72
88
98
88
89
94
96
76
(17)
(27)
(13)
(10)
(23)
(6)
(12)
(30)
(10)
(7)
(6)
(12)
(7)
(6)
(15)
(10)
(8)
(7)
(8)
(7)
(8)
82 (11)
95 (12)
99 (11)
78 (16)
94 (11)
97 (8)
98 (11)
82 (11)
93 (11)
86 (7)
101 (12)
87 (15)
72 (15)
74 (13)
80 (4)
80 (6)
77 (15)
96 (9)
94 (10)
83 (16)
105 (19)
97 (7)
90 (6)
98 (8)
96 (11)
91 (12)
91 (6)
83 (3)
97 (16)
94 (19)
73 (18)
83 (9)
95 (11)
91 (5)
102 (9)
Barley, oat, rice, rye, and wheat
Barley, oat, rice, rye, and wheat
Rye and wheat
Barley, oat, rice, rye, and wheat
Barley, oat, rice, rye, and wheat
Barley, oat, rice, rye, and wheat
Barley, oat, rice, rye, and wheat
Barley, oat, rice, rye, and wheat
Barley, rice, rye, and wheat
Barley, oat, rice, rye, and wheat
Barley, oat, rice, rye, and wheat
Rye and oat
Rye and wheat
Barley, rye, and wheat
Barley, oat, rice, rye, and wheat
Barley, oat, rice, rye, and wheat
Barley, oat, rice, rye, and wheat
Barley, oat, rice, rye, and wheat
Barley, oat, rice, rye, and wheat
Barley, oat, rice, rye, and wheat
Barley, oat, rice, rye, and wheat
Rye and wheat
Barley, oat, rice, rye, and wheat
Barley, oat, rice, rye, and wheat
Barley, oat, rice, rye, and wheat
Barley, oat, rice, rye, and wheat
Barley, oat, rice, rye, and wheat
Barley, oat, rice, rye, and wheat
Barley, oat, rice, rye, and wheat
Barley, oat, rice, rye, and wheat
Rye
Barley, oat, rye, and wheat
Barley, oat, rice, rye, and wheat
Barley, oat, rice, rye, and wheat
Barley, oat, rice, rye, and wheat
0.005
0.005
0.005
0.005
0.005
0.005
0.005
0.005
0.005
0.005
0.005
0.005
0.05
0.01
0.005
0.005
0.005
0.05
0.005
0.01
0.05
0.005
0.005
0.005
0.005
0.005
0.005
0.005
0.01
0.05
0.005
0.005
0.005
0.005
0.005
84 (7)
112 (9)
120 (18)
117 (13)
105 (12)
107 (9)
106 (10)
111 (16)
103 (11)
115 (8)
117 (12)
82 (13)
65 (3)
107 (13)
102 (11)
103 (8)
117 (8)
95
87
86
89
92
Barley, oat, rye, and wheat
Rye and wheat
Barley, oat, rice, rye, and wheat
Barley, oat, rice, rye, and wheat
Barley, oat, rice, rye, and wheat
Barley, oat, rice, rye, and wheat
Barley, rye, and wheat
Barley, oat, rice, rye, and wheat
Barley, oat, rice, rye, and wheat
Barley, oat, rice, rye, and wheat
Barley, oat, rice, rye, and wheat
Barley, rye, and wheat
Barley, oat, rice, rye, and wheat
Barley, oat, rice, rye, and wheat
Barley, oat, rice, rye, and wheat
Barley, oat, rice, rye, and wheat
Barley, oat, rice, rye, and wheat
Barley, oat, rice, rye, and wheat
Barley, oat, rice, rye, and wheat
Barley, oat, rice, rye, and wheat
Rye and wheat
Barley, oat, rice, rye, and wheat
Rye and wheat
Barley, oat, rye, and wheat
Rye
Barley, oat, rice, rye, and wheat
Barley, oat, rice, rye, and wheat
Barley, oat, rice, rye, and wheat
Rye
Barley, oat, rice, rye, and wheat
Barley, oat, rye, and wheat
Barley, oat, rice, rye, and wheat
Barley, oat, rice, rye, and wheat
Rye
0.01
0.005
0.05
0.005
0.005
0.005
0.005
0.01
0.005
0.005
0.005
0.01
0.005
0.005
0.01
0.005
0.005
0.005
0.005
0.005
0.005
0.005
0.005
0.005
0.01
0.005
0.005
0.005
0.005
0.005
0.005
0.005
0.005
0.005
88 (29)
98 (10)
87 (10)
93 (25)
117 (18)
99 (8)
86 (19)
103 (16)
89 (6)
83 (7)
61 (43)
83 (1)
82 (12)
90 (7)
111 (11)
93 (9)
74 (12)
92 (6)
90 (8)
71 (9)
96 (11)
86 (9)
86 (7)
61 (45)
80 (9)
98 (21)
84 (7)
92 (8)
84 (18)
95 (1)
86 (8)
97 (14)
105 (5)
103 (5)
86 (6)
92 (8)
105 (17)
96 (6)
88 (19)
87 (8)
93 (11)
103 (13)
125 (10)
106 (8)
106 (12)
100 (8)
110 (7)
92 (10)
108 (10)
106 (9)
93 (10)
106 (10)
109 (16)
120 (11)
104 (10)
105 (10)
111 (10)
117 (12)
100 (9)
75 (17)
96 (9)
98 (13)
108 (11)
112 (11)
107 (15)
94 (9)
108 (8)
100 (10)
119 (15)
99 (9)
116 (15)
114 (19)
110 (9)
94 (4)
87 (13)
106 (11)
92 (12)
81 (14)
88 (5)
72 (19)
77 (18)
87 (21)
94 (6)
97 (8)
92 (9)
56 (23)
95 (6)
93 (8)
60 (34)
90 (9)
85 (10)
92 (6)
83 (10)
83 (8)
89 (6)
83 (8)
90 (6)
77 (14)
59 (20)
90 (5)
86 (6)
92 (8)
87 (6)
91 (6)
81 (10)
90 (11)
94 (8)
101 (15)
(continued on next page)
9
E. Hakme and M.E. Poulsen
Journal of Chromatography A 1652 (2021) 462384
Table 2 (continued)
140
141
142
143
144
145
146
147
148
149
150
151
152
153
154
155
156
157
158
159
160
161
162
163
164
165
166
167
168
169
170
171
172
1
2
3
Compound
MRL (mg.kg−1 )
Matrix
LOQ (mg kg−1 )
Propyzamide
Prosulfocarb
Prothiofos
Pyraclostrobin
Pyrazophos
Pyridaben
Pyridaphenthion
Pyrimethanil
Pyriproxyfen
Quinoxyfen
Simazine
Spirodiclofen
Spiroxamine
Tebuconazole
Tebufenpyrad
Tecnazene
Tefluthrin
Tetraconazole
Tetradifon
Thiamethoxam
Thiometon
Tolclofos-methyl
Triadimefon
Triadimenol
Triallate
Triazophos
Tricyclazole
Trifloxystrobin
Trifluralin
Triticonazole
Vamidothion
Vinclozolin
Zoxamide
0.01
0.01
0.013
0.22
0.01
0.01
0.013
0.052
0.05
0.022
0.01
0.02
0.052
0.32
0.01
0.01
0.05
0.052
0.01
0.022
0.013
0.01
0.01
0.012
0.013
0.02
0.01
0.32
0.01
0.01
0.013
0.01
0.02
Barley, oat, rice, rye, and
Barley, oat, rice, rye, and
Barley, oat, rice, rye, and
Rye and wheat
Rye and wheat
Rye and wheat
Rye and wheat
Barley, oat, rice, rye, and
Barley, rye, and wheat
Barley, oat, rice, rye, and
Barley, oat, rice, rye, and
Barley, rye, and wheat
Barley, oat, rice, rye, and
Barley, oat, rice, rye, and
Barley, oat, rice, rye, and
Barley, oat, rice, rye, and
Barley, oat, rice, rye, and
Barley, oat, rice, rye, and
Barley, oat, rice, rye, and
Barley, oat, rice, rye, and
Barley, oat, rice, rye, and
Barley, oat, rice, rye, and
Barley, oat, rice, rye, and
Barley, oat, rice, rye, and
Rye and wheat
Rye and wheat
Barley, oat, rice, rye, and
Barley, oat, rice, rye, and
Barley, oat, rice, rye, and
Rye and wheat
Barley, oat, rice, rye, and
Barley, oat, rice, rye, and
Barley, rye, and wheat
wheat
wheat
wheat
wheat
wheat
wheat
wheat
wheat
wheat
wheat
wheat
wheat
wheat
wheat
wheat
wheat
wheat
wheat
wheat
wheat
wheat
wheat
wheat
Spiking levels (mg kg−1 )
Recovery% (RSD)
0.005
0.01
0.05
0.005
0.005
0.005
0.01
0.005
0.005
0.005
0.005
0.005
0.005
0.005
0.005
96 (12)
106 (9)
100 (7)
0.005
0.005
0.005
0.005
0.005
0.005
0.005
0.005
0.005
0.005
0.005
0.005
0.005
0.05
0.005
0.005
0.005
0.05
0.005
0.05
113 (7)
112 (9)
83 (8)
96 (7)
101 (9)
94 (9)
93 (18)
80 (9)
94 (8)
103 (11)
112 (15)
92 (8)
109 (12)
85 (7)
89 (10)
86 (6)
82 (16)
87 (7)
84 (16)
89 (6)
74 (33)
87 (6)
83 (5)
82 (7)
91 (6)
81(10)
108 (10)
94 (6)
68 (43)
83 (7)
90 (6)
87 (8)
81 (8)
74 (18)
90 (8)
89 (7)
93 (11)
83 (12)
89 (7)
109 (9)
95 (7)
114 (10)
93 (7)
78 (8)
93 (9)
99 (8)
88 (6)
87 (5)
87 (5)
83 (9)
79 (49)
90 (8)
85 (9)
91 (7)
85 (8)
90 (8)
80 (9)
85 (6)
82 (7)
87(7)
100 (11)
97 (8)
78 (7)
83 (5)
94 (6)
90 (5)
78 (16)
75 (9)
88 (5)
90 (7)
100 (10)
89 (7)
92 (6)
65 (26)
94 (8)
80 (7)
97 (8)
77 (23)
88 (5)
91 (11)
115 (10)
106 (9)
113 (9)
88 (9)
103 (10)
99 (9)
99 (10)
112 (10)
Metabolites included in the residue definition.
Assignment of MRLs for rye where MRLs for cereals’ category is not mentioned.
Application of a general default MRL of 0.01 mg.kg−1 where a pesticide is not specifically mentioned.
effectiveness of the developed method. Reproducibility, estimated
as the relative response deviation among cereal samples, was less
than 20% for almost all of the studied compounds. Fig. 6 shows
the overlay of the ion chromatograms of pirimiphos-methyl and
chlormephos in the five cereal matrices at a spiking level of 5 μg
kg-1. The μ-SPE method was not feasible for the determination
of two compounds, 3-hydroxycarbofuran and methacrifos, which
were not successfully validated, with 3-Hydroxycarbofuran being
difficult to analyze by GC. LOQs reached were below the MRLs except for 11 compounds. Among these, some were also not validated
in house with QuEChERS and d-SPE (hexaconazole and formothion)
and others were validated using LC-MS/MS (fenhexamid, ethiofencarb, and vamidothion). Dichlorvos is very volatile which can explain its loss during the analysis and the relatively high LOQ obtained. Additionally, and based on laboratory experience, the GCOrbitrap is not as sensitive as the triple quadrupole MS with the
Advanced Electron Ion (AEI) source used in the laboratory routine
analysis.
static autosampler, a larger size tray, and an automatic de-capping
and capping system, would be optimal.
Authors’ contribution
Elena Hakme (conception and design of the study, acquisition of data, analysis and/or interpretation of data, drafting the
manuscript)
Mette Erecius Poulsen (conception and design of the study, revising the manuscript critically for important intellectual content)
Declaration of Competing Interest
The authors declare that they have no known competing financial interests or personal relationships that could have appeared to
influence the work reported in this paper.
Acknowledgments
The authors received funding from the European Union Reference Laboratory of pesticide residues in cereals and feeding stuff
(EURL-CF). The authors thank Thomi Preiswerk from CTC Analytics
for his technical support.
4. Conclusion
The main benefit of μ-SPE is the increase in laboratory productivity and sample throughput, with an associated reduction of
labor. The best strategy for accurate pesticide determination and
quantitation is the use of semi-procedural matrix calibration. The
automated μ-SPE system could be used as a standalone system, or
it could be coupled to a high-sensitivity analytical instrument. In
the latter case, the addition of some features, such as a thermo-
Supplementary materials
Supplementary material associated with this article can be
found, in the online version, at doi:10.1016/j.chroma.2021.462384.
10
E. Hakme and M.E. Poulsen
Journal of Chromatography A 1652 (2021) 462384
References
[12] S.X. Guan, Z.G. Yu, H.N. Yu, C.H. Song, Z.Q. Song, Z. Qin, Multi-walled carbon
nanotubes as matrix solid-phase dispersion extraction adsorbent for simultaneous analysis of residues of nine organophosphorus pesticides in fruit and
vegetables by rapid resolution LC-MS-MS, Chromatographia 73 (1–2) (2011)
33–41, doi:10.1007/s10337-010-1840-2.
[13] S.S. Herrmann, M.E. Poulsen, Clean-up of cereal extracts for gas chromatography – tandem quadrupole mass spectrometry pesticide residues analysis using primary secondary amine and C18, J. Chromatogr. A 1423 (2015) 47–53,
doi:10.1016/j.chroma.2015.10.086.
´ M. Serdar, Screening of fresh fruit and vegetables for pesticide
[14] Z. Kneževic,
residues on Croatian market, Food Control 20 (4) (2009) 419–422, doi:10.1016/
j.foodcont.2008.07.014.
[15] S.J. Lehotay, L. Han, Y. Sapozhnikova, Automated mini-column solid-phase extraction clean-up for high-throughput analysis of chemical contaminants in
foods by low-pressure gas chromatography—tandem mass spectrometry, Chromatographia 79 (17) (2016) 1113–1130, doi:10.1007/s10337- 016- 3116- y.
[16] T.E. Lockwood, M. Talebi, A. Minett, S. Mills, P.A. Doble, D.P. Bishop, Micro
solid-phase extraction for the analysis of per- and polyfluoroalkyl substances
in environmental waters, J. Chromatogr. A 1604 (2019), doi:10.1016/j.chroma.
2019.460495.
[17] B.D. Morris, R.B. Schriner, Development of an automated column solid-phase
extraction clean-up of QuEChERS extracts, using a zirconia-based sorbent, for
pesticide residue analyses by LC-MS/MS, J. Agric. Food Chem. 63 (21) (2015)
5107–5119, doi:10.1021/jf505539e.
[18] E. Ninga, Y. Sapozhnikova, S.J. Lehotay, A.R. Lightfield, S.H. Monteiro,
High-throughput mega-method for the analysis of pesticides, veterinary
drugs, and environmental contaminants by ultra-high-performance liquid
chromatography–tandem mass spectrometry and robotic mini-solid-phase extraction clean-up + low-pressure gas chroma, J. Agric. Food Chem. 69 (4)
(2021) 1169–1174, doi:10.1021/acs.jafc.0c00995.
[19] R. Pandey, L. Caflisch, A. Lodi, A.J. Brenner, S. Tiziani, Metabolomic signature of
brain cancer, Mol. Carcinog. 56 (11) (2017) 2355–2371, doi:10.1002/mc.22694.
[20] L. Ramos, Basics and advances in sampling and sample preparation, Chem.
Anal. Food: Techn. Appl. (2012) 3–24, doi:10.1016/B978- 0- 12- 384862- 8.
0 0 0 01-7.
[21] Saxholt, E., Fagt, S., Matthiessen, J., & Christensen, T. (2010). Den lille
Levnedsmiddeltabel, 36–43.
[22] L. Sørensen, M.S. Silva, A.M. Booth, S. Meier, Optimization and comparison of
miniaturized extraction techniques for PAHs from crude oil exposed Atlantic
cod and haddock eggs, Anal. Bioanal. Chem. 408 (4) (2016) 1023–1032, doi:10.
10 07/s0 0216- 015- 9225- x.
[23] M.A. Tayeb, B.S. Ismail, K. Jansar, Comparison of four different solid phase extraction cartridges for sample clean-up in the analysis of glufosinate ammonium from aqueous samples, Int. J. ChemTech Res. 7 (2015) 2612–2619.
[24] S. Zhang, Q. Yang, X. Yang, W. Wang, Z. Li, L. Zhang, C. Wang, Z. Wang, A zeolitic imidazolate framework based nanoporous carbon as a novel fiber coating
for solid-phase microextraction of pyrethroid pesticides, Talanta 166 (January)
(2017) 46–53, doi:10.1016/j.talanta.2017.01.042.
[1] Alnedhary, A.A., Al-hammadi, M.M., & Abdualqawi, A. (2020). Optimization and
efficiency comparison of dispersive and cartridge solid phase extraction cleanup techniques in the analysis of pesticide residues in some vegetables using
gas chromatography-mass spectrom, 5 (1), 40–54.
[2] M. Anastassiades, S.J. Lehotay, D. Stajnbaher, F.J. Schenck, Fast and easy multiresidue method employing acetonitrile extraction/partitioning and “dispersive solid-phase extraction” for the determination of pesticide residues in produce, J. AOAC Int. 86 (2) (2003) 412–431.
[3] AOAC. (2007). AOAC Official Method, 01 Pesticide residues in foods by acetonitrile extraction and partitioning with magnesium sulfate [ Applicable for the
following pesticides in grapes, lettuces, and oranges : atrazine, azoxystrobin,
bifenthrin, carbaryl, AOAC Int. (2007) 1–9.
[4] E. Boes, R.T. Rosmalina, Y.S. Ridwan, W.C. Nugraha, R. Yusiasih, Development
of validated method using QuEChERS technique for organochlorine pesticide
residues in vegetable, Procedia Chem. 16 (2015) 229–236, doi:10.1016/j.proche.
2015.12.052.
[5] G. Crnogorac, S. Schmauder, W. Schwack, Trace analysis of dithiocarbamate
fungicide residues on fruits and vegetables by hydrophilic interaction liquid
chromatography/tandem mass spectrometry, Rapid Commun. Mass Spectrometry : RCM, 22 (2008) 2539–2546, doi:10.1002/rcm.3646.
[6] EN15662, Foods of plant origin- Determination of pesticide residues using
GC–MS and /or LC-MS/MS following acetonitrile extraction / partitioning and
clean-up by dispersive SPE-QuEChERS-methodBritish Standard (Vol. 24), 2008,
doi:10.1038/s41598- 017- 05299- 9.
[7] Commission Implementing Regulation (EU) 2021/601 of 13 April 2021 concerning a coordinated multiannual control programme of the Union for 2022, 2023
and 2024 to ensure compliance with maximum residue levels of pesticides and
to assess the consumer exposure to pesticide residues in and on food of plant
and animal origin.
[8] EURL Pesticides Database available on: />pesticides/max_residue_levels_en
[9] European Commission DG-SANTE. (2019). Analytical quality control and method validation procedures for pesticide residues analysis in food and feed. Main changes introduced in Document Nº
SANTE/12682/2019 with respect to the previous version (Document Nº
SANTE/11813/2017).
/>pesticides_mrl_guidelines_wrkdoc_2019-12682.pdf
[10] J.L. Fernández Moreno, A. Garrido Frenich, P. Plaza Bolos, J.L Martínez Vidal, Multiresidue method for the analysis of more than 140 pesticide residues
in fruits and vegetables by gas chromatography coupled to triple quadrupole
mass spectrometry, J. Mass Spectrometry : JMS 43 (9) (2008) 1235–1254,
doi:10.10 02/jms.140 0.
[11] A. Goon, R. Shinde, B. Ghosh, K. Banerjee, Application of automated mini–solidphase extraction clean-up for the analysis of pesticides in complex spice matrixes by GC-MS/MS, J. AOAC Int. 103 (1) (2020) 40–45, doi:10.5740/jaoacint.
19-0202.
11