Ultrahigh-performance supercritical fluid chromatography – mass spectrometry for the qualitative analysis of metabolites covering a large polarity range
Bạn đang xem bản rút gọn của tài liệu. Xem và tải ngay bản đầy đủ của tài liệu tại đây (924.11 KB, 12 trang )
Journal of Chromatography A 1665 (2022) 462832
Contents lists available at ScienceDirect
Journal of Chromatography A
journal homepage: www.elsevier.com/locate/chroma
Ultrahigh-performance supercritical fluid chromatography – mass
spectrometry for the qualitative analysis of metabolites covering a
large polarity range
Michela Antonelli, Michal Holcˇ apek, Denise Wolrab∗
Department of Analytical Chemistry, Faculty of Chemical Technology, University of Pardubice, Studentská 573, Pardubice 53210, Czech Republic
a r t i c l e
i n f o
Article history:
Received 9 December 2021
Revised 13 January 2022
Accepted 13 January 2022
Available online 15 January 2022
Keywords:
Supercritical fluid chromatography
Metabolites
Amino acids
Human plasma
Mass spectrometry
a b s t r a c t
The applicability of ultrahigh-performance supercritical fluid chromatography coupled with mass spectrometry (UHPSFC/MS) for the qualitative analysis of metabolites with a wide polarity range (log P:
−3.89–18.95) was evaluated using a representative set of 78 standards belonging to nucleosides, biogenic
amines, carbohydrates, amino acids, and lipids. The effects of the gradient shape and the percentage of
water (1, 2, and 5%) were investigated on the Viridis BEH column. The screening of eight stationary phases
was performed for columns with different interaction sites, such as hydrogen bonding, hydrophobic, π π , or anionic exchange type interactions. The highest number of compounds (67) of the set studied was
detected on the Torus Diol column, which provided a resolution parameter of 39. The DEA column had
the second best performance with 58 detected standards and the resolution parameter of 54. The overall performance of other parameters, such as selectivity, peak height, peak area, retention time stability,
asymmetry factor, and mass accuracy, led to the selection of the Diol column for the final method. The
comparison of additives showed that ammonium acetate gave a superior sensitivity over ammonium formate. Moreover, the influence of the ion source on the ionization efficiency was studied by employing
atmospheric pressure chemical ionization (APCI) and electrospray ionization (ESI). The results proved the
complementarity of both ionization techniques, but also the superior ionization capacity of the ESI source
in the negative ion mode, for which 53% of the analytes were detected compared to only 7% for the APCI
source. Finally, optimized analytical conditions were applied to the analysis of a pooled human plasma
sample. 44 compounds from the preselected set were detected in human plasma using ESI-UHPSFC/MS
in MSE mode considering both ionization modes.
© 2022 The Authors. Published by Elsevier B.V.
This is an open access article under the CC BY-NC-ND license
( />
1. Introduction
Metabolomics can be described as the comprehensive study of
small molecules, called metabolites, in the organism and the association of those with pathophysiological states [1,2]. Metabolomic
analysis requires the use of highly powerful analytical techniques,
such as mass spectrometry (MS) hyphenated to chromatographic
separation techniques, such as liquid chromatography (LC) or
gas chromatography, as a means to simultaneously analyze complex mixtures of metabolites [3]. The most widespread separation modes used for metabolomics are reversed-phase ultrahighperformance liquid chromatography (RP-UHPLC) and hydrophilic
interaction liquid chromatography (HILIC-UHPLC) coupled to high-
∗
Corresponding author.
E-mail address: (D. Wolrab).
resolution (HR) MS instruments, such as quadrupole-time-offlight (QTOF) or Orbitrap [4]. The comprehensive analysis of the
metabolome is challenging due to the high chemical and structural
diversity of metabolites. In RP-UHPLC, intermolecular hydrophobic
interactions between analytes, stationary phase, and mobile phase
allow analysis of a large part of the metabolome of complex biological samples such as urine, plasma, and tissue extracts [5–
7]. However, polar and/or ionic species are poorly retained in RPUHPLC [8]. The retention mechanism in the HILIC mode is based on
the interaction of polar analytes with the polar stationary phase,
which allows the separation of the analytes. Therefore, HILIC provides complementary chromatographic separation compared to RPUHPLC/MS [9,10]. Nonpolar compounds may elute in or close to
the void volume in HILIC mode. A comprehensive technique that
allows the separation of polar and non-polar metabolites, such as
lipids, amino acids, and nucleosides, is desired.
/>0021-9673/© 2022 The Authors. Published by Elsevier B.V. This is an open access article under the CC BY-NC-ND license ( />
M. Antonelli, M. Holcˇ apek and D. Wolrab
Journal of Chromatography A 1665 (2022) 462832
Recently, UHPSFC gained attention, because the new generation
instruments allow stable and reproducible results as well as routine hyphenation to mass spectrometry [11,12]. Mainly, the backpressure regulator, injector, and column technology were improved
for the new generation instruments, leading to better acceptance
of UHPSFC/MS for a broad application range. Generally, the use of
supercritical fluid chromatography (SFC) was first described more
than 50 years ago [13], but its application for lipidomic [14,15] and
metabolomic analysis [12,16,17] represents a rather recent trend.
UHPSFC may represent a potential alternative to RP- and HILICUHPLC for the comprehensive analysis of the metabolome by reducing the costs and analysis time. Nowadays, UHPSFC mainly
uses supercritical CO2 mixed with organic modifiers as the mobile
phase. The addition of organic solvents, typically 2–40%, broadens
the range of analytes that can be separated with UHPSFC. Polar
solvents, such as methanol, ethanol, or acetonitrile, are the most
commonly used and facilitate the elution of polar compounds. The
addition of small percentages of water, salts, bases, and/or acid additives to the modifier can further improve the peak shape and the
elution of polar and ionic compounds [18–20]. The low viscosity
and high diffusion of the mobile phase in UHPSFC allow the use
of high flow rates without losing separation efficiency and therefore allow high-throughput analyzes [21,22]. Furthermore, almost
all stationary phases used for UHPLC can also be used for UHPSFC including modern stationary phases packed with sub-3 μm
core shell and fully porous particles [23–26]. Recently, dedicated
UHPSFC stationary phases were also introduced to the market,
such as the Torus column series from Waters. These stationary
phases are based on silica modified with different selectors, such
as propanediol, 1-aminoanthracene, diethylamine, 2-picolylamine,
or ethylene-bridged silica, which are potentially suitable for the
separation of medium to polar metabolites [18,21,27]. It should be
mentioned that the analysis of very polar compounds still remains
challenging for UHPSFC/MS employing common chromatographic
conditions. The increase in the percentage of modifier in CO2 up
to 100% during the gradient increases the elution strength for polar compounds and extends the polarity range of analytes suitable for the separation with UHPSFC/MS instruments. These special modes using increased modifier and CO2 as the mobile phase
are called unified chromatography or enhanced fluid chromatography [20,28]. However, such mobile phase conditions and the use of
sub-2 μm particle columns can lead to exceeding system pressure
forcing adjustment of parameters, such as backpressure, temperature, or flow rate. Consequently, the analyzes may be performed by
increasing the organic solvent in the mobile phase gradient and, at
the same time, decreasing the flow rates. Following this approach
in metabolomics and using a polar stationary phase, the elution
ranges from nonpolar to polar compounds [12].
In recent years, more UHPSFC/MS applications have been investigated, accompanied by unconventional and innovative developments regarding the applied conditions and instrumental settings.
Analysis of natural products, biological samples [29–32], pharmaceuticals, nutrients, and environmental samples are examples for
the application areas of UHPSFC [33]. However, only a few studies investigated metabolomics by UHPSFC/MS. The potential of UHPSFC/MS for the analysis of polar urinary metabolites was investigated by Sen et al., who evaluated 12 different columns, 3 column
temperatures, and 9 different additives in methanol, for the separation of 60 polar metabolites (log P −7 to 2) [18]. Desfontaine
et al. described the application of UHPSFC coupled to a triplequadrupole MS for the analysis of nucleosides, small bases, lipids,
small organic acids, and sulfated metabolites [12]. The analytical
method was optimized by investigating several parameters such as
the kinetic performance, the percentage of cosolvent, the type of
stationary phase, and the composition of the mobile phase. Additionally, the mixture of 57 compounds was also analyzed by
unified chromatography coupled with MS. Losacco et al. analyzed
49 metabolites in plasma and urine using UHPSFC/QTOF-MS with
the evaluation of the impact of the biological matrix. Most of selected compounds were not affected by matrix interference (63%),
whereby 16% of compounds showed a matrix effect in urine and
plasma samples [16]. The UHPSFC/MS analysis of free amino acids
was investigated by Raimbault et al. [20]. The separation of 18 native proteinogenic amino acids was achieved by applying unified
chromatographic conditions, starting from 90% CO2 to 100% modifier.
The aim of this work was to evaluate the suitability of UHPSFC/MS for the analysis of 78 metabolites selected from the Human Metabolome Database (HMDB) database based on their relevance in cancer research. To achieve the elution of all analytes,
enhanced fluid chromatography was applied because the analyte
set covers a wide polarity range (log P: −3.89 – 18.95). The influence of the percentage of water in the modifier, the gradient
shape, and the type of stationary phase for the separation of the
analyte set was evaluated using UHPSFC/QTOF-MS. The ionization
efficiency of the selected metabolites employing electrospray ionization (ESI) and atmospheric pressure chemical ionization (APCI)
was compared. The MSE mode was applied for the analysis of the
standard metabolite mixture and plasma samples.
2. Materials and methods
2.1. Chemicals
Methanol (CH3 OH), acetonitrile (ACN), 2-isopropanol, hexane
(all LC/MS gradient grade), water (H2 O; LC/MS Ultra, UHPLC/MS
grade), and chloroform (LC grade, stabilized with 0.5–1% ethanol)
were purchased from Honeywell (Charlotte, North Caroline, US).
Ammonium acetate, ammonium formate (LC/MS, gradient grade),
and formic acid (98–100%, Suprapur) were purchased from SigmaAldrich or Merck (St. Louis, MO, U.S.A), respectively. Carbon dioxide
(CO2 ) 4.5 grade (99.995%) was obtained from Messer Group GmbH
(Bad Soden, Germany).
2.2. Standards
The standards were purchased from Sigma-Aldrich (see
Table 1). Standard stock solutions were prepared by dissolving each
compound in the appropriate solvent or solvent mixture (Table S1)
to obtain the final concentration of 10 mg mL−1 . Afterwards, nine
standard mixtures were prepared according to the analyte category
and diluted in MeOH, that is, mixtures of nucleosides (N°1; 100 ng
μL−1 ), biogenic amines (N°2; 20–100 ng μL−1 ), sugars together
with other organic compounds (N°3; 100–10 ng μL−1 ), amino acids
(N°4–8; 2–100 ng μL−1 ) and lipids (N°9; 10 ng μL−1 ). Analytes in
each mixture are reported in Table S1. Standard concentrations in
the final mixture were established by investigating the efficiency
and sensitivity of ionization using direct infusion MS for 10 ng
μL−1 and 100 ng μL−1 as well as two different sample solvent solutions, MeOH and MeOH/ACN (50:50, v/v). The optimized source
parameters, standard concentration, and sample solvent were used
for further experiments. These standard mixtures (100 μL of each)
and guanine (10 μL) were mixed, and the final standard solution
was diluted with acetonitrile to obtain a final solvent composition
of CH3 OH/ACN (50:50, v/v) for UHPSFC/MS analyzes (Table S1).
2.3. Stationary phases
The final standard solution was analyzed using eight different columns, reported in Table 2. The stationary phases differ in
their column chemistry, providing different interaction sites and
2
M. Antonelli, M. Holcˇ apek and D. Wolrab
Journal of Chromatography A 1665 (2022) 462832
Table 1
List of standard compounds.
Compounds
Molecular formula
Exact Mass
Log10 P
Nucleosides
Adenosine
2-Deoxyadenosine
Adenine
Uridine
C10 H13 N5 O4
C10 H13 N5 O3
C5 H5 N5
267.0967
251.1018
135.0545
−1.05
−0.55
0
C9 H12 N2 O6
C10 H13 N5 O5
C5 H5 N5 O
C10 H12 N4 O6
244.0695
283.0917
151.0494
284.0757
−2.28
−2.76
−1.27
−1.26
C4 H12 N2
C7 H19 N3
C10 H26 N4
C9 H13 NO3
C8 H11 NO3
C8 H11 NO2
C10 H12 N2 O
C5 H9 N3
C10 H12 N2
C12 H14 N2 O2
C13 H16 N2 O2
C8 H11 NO2
88.1000
145.1579
202.2157
183.0895
169.0739
153.079
176.095
111.0796
160.1000
218.1055
232.1212
153.079
−0.99
−1.26
−0.5
−1.37
−0.24
0.58
0.51
−1.09
0.9
0.44
0.71
−0.9
C3 H7 NO2
C4 H9 NO3
C6 H13 NO2
C6 H13 NO3
C6 H13 NO4
C6 H14 N4 O2
C5 H9 NO4
C5 H10 N2 O3
C6 H9 N3 O2
C5 H11 NO2 S
C5 H12 N2 O2
C9 H11 NO2
C3 H7 NO3
C7 H15 NO3
C5 H11 NO2
C9 H11 NO3
C11 H12 N2 O2
C12 H14 N2 O2
C11 H12 N2 O3
C5 H9 NO2
C4 H8 N2 O3
C6 H14 N2 O2
C2 H7 NO3 S
C4 H7 NO4
C9 H17 NO4
C15 H29 NO4
C17 H33 NO4
C19 H37 NO4
C21 H41 NO4
89.0477
119.0582
131.0946
131.0946
131.0946
174.1117
147.0531
146.0691
155.0695
149.051
132.0899
165.0788
105.0426
161.1052
117.079
181.0739
204.0899
218.1055
220.0848
115.0633
132.0535
146.1055
125.0147
133.0375
203.1157
287.2096
315.2409
343.2722
371.3035
−2.85
−1.43
−1.62
0.43
−1.70
−3.5
−1.39
−2.05
−1.67
−0.56
−1.57
−1.49
−1.75
−2.9
−0.01
−2.15
−1.07
0.84
−0.07
−0.4
−2.33
−1.15
−1.72
−3.89
−0.66
1.68
2.46
3.24
4.02
C23 H45 NO4
399.3348
4.8
C6 H12 O6
C5 H10 O5
C6 H12 O6
180.0634
150.0528
180.0634
−3.24
−2.71
−3.22
C8 H10 N4 O2
C19 H19 N7 O6
C9 H9 NO
C8 H7 NO
C10 H12 N2 O3
194.0804
441.1397
147.0684
133.0528
208.0448
−0.8
−0.04
1.45
1.19
−0.82
C44 H84 NO8 P
C26 H52 NO7 P
C41 H78 NO8 P
C23 H48 NO7 P
C40 H76 NO10 P
C24 H46 NO9 P
C42 H79 O10 P
C24 H47 O9 P
C39 H73 O8 P
785.5934
521.3481
743.5465
479.3012
761.5207
523.291
774.5411
510.2958
700.5043
13.15
6.56
13.2
6.62
12.1
6.07
12.89
3.97
12.82
Guanosine
Guanine
Xanthosine
Biogenic amines
Putrescine
Spermidine
Spermine
Adrenaline
Noradrenaline
Dopamine
Serotonin
Histamine
Tryptamine
N-acetyl-5-hydroxytryptamine
Melatonin
Octopamine hydrochloride
Amino acids
L-Alanine
L-Threonine
L-Leucine
L-Norleucine
L-Isoleucine
L-Arginine
Glutamic acid
L-Glutamine
L-Histidine monohydrochloride
L-Methionine
Ornithine
Phenylalanine
Serine
L-Carnitine
Valine
L-Tyrosine
L-Tryptophan
1-Methyl-l-Tryptophan
5-Hydroxy-l-Tryptophan
L-Proline
D,L-Asparagine
L-Lysine
Taurine
Aspartic acid
Acetyl-l-carnitine hydrochloride
D,L-Octanoylcarnitine chloride
D,L-Decanoylcarnitine chloride
D,L-Lauroylcarnitine chloride
D,L-Myristoylcarnitine chloride
D,L-Palmitoylcarnitine chloride
Sugars
D-Glucose
D-Xylose
Myo-inositol
Other organic compounds
Caffeine
Folic acid
5-Methoxyindole
5-Hydroxyindole
D,L-Kynurenine
Polar lipids
PC (18:1/18:1)
LPC (18:1/0:0)
PE (18:1/18:1)
LPE (18:1/0:0)
PS (16:0/18:1)
LPS (18:1/0:0)
PG (18:1/18:1)
LPG (18:1/0:0)
PA (18:1/18:1)
(continued on next page)
3
M. Antonelli, M. Holcˇ apek and D. Wolrab
Journal of Chromatography A 1665 (2022) 462832
Table 1 (continued)
Compounds
Molecular formula
Exact Mass
Log10 P
LPA (18:1/0:0)
GalCer (d18:1/12:0)
LacCer (d18:1/16:0)
Cer (d18:1/18:1)
Mono-Sulfo-GalCer(d18:1/24:1)
SM (d18:1/18:1)
SPH d18:1 (sphingosine)
SPH d18:0 (sphinganine)
Nonpolar lipids
MG (0:0/18:1/0:0)
DG (18:1/0:0/18:1)
Prostaglandin E2
TG (18:1/18:1/18:1)
C21 H41 O7 P
C36 H69 NO8
C46 H87 NO13
C36 H69 NO3
C48 H91 NO11 S
C41 H81 N2 O6 P
C18 H37 NO2
C18 H39 NO2
436.259
643.5023
861.6177
563.5277
889.6313
728.5832
299.2824
301.2981
4.69
8.4
5.81
10.98
13.94
11.76
4.78
5.01
C21 H40 O4
C39 H72 O5
C20 H32 O5
C57 H104 O6
356.2927
620.538
352.225
884.7833
5.78
12.37
3.82
18.95
Table 2
Columns screened in this study.
Column name
ACQUITY
ACQUITY
ACQUITY
ACQUITY
ACQUITY
ACQUITY
ACQUITY
ACQUITY
Support
2
UPC
UPC2
UPC2
UPC2
UPC2
UPC2
UPC2
UPLC
BEH
Torus Diol
Torus 2-PIC
Torus 1AA
Torus DEA
HSS C18 SB
Trefoil CEL1
HSS T3
Fully
Fully
Fully
Fully
Fully
Fully
_
_
porous
porous
porous
porous
porous
porous
hybrid
hybrid
hybrid
hybrid
hybrid
silica
silica
silica
silica
silica
silica
Bonded ligand
Dimensions (mm)
_
Propanediol
2-Picolyl-amine
1-Amino-anthracene
Diethylamine
Octadecyl, nonendcapped
Modified polysaccharide
Octadecyl, endcapped
100
100
100
100
100
100
150
100
×
×
×
×
×
×
×
×
3.0
3.0
3.0
3.0
3.0
3.0
3.0
2.1
Particle size (μm)
1.7
1.7
1.7
1.7
1.7
1.8
2.5
1.8
0.2 mL min−1 , 13 min – 0.2 mL min−1 , 14 min – 0.6 mL min−1 ,
15 min – 0.6 mL min−1 .
The following settings were used for QTOF measurements: HR
mode, a mass range of m/z 50–950, and the continuum mode with
a scan time of 0.1 s were applied. Leucine enkephalin was used as
the lock mass, in which the lock mass was acquired with a scan
time of 0.1 s in 10 s intervals, but no automatic lock mass correction was applied. ESI and APCI in positive and negative ion modes
were investigated. The following parameters were used for the ESI
mode: capillary voltage 2.50 kV, sampling cone 20 V, source offset
90 V, source temperature 150 °C, desolvation temperature 350 °C,
cone gas flow 50 L/h, desolvation gas flow 10 0 0 L/h and nebulizer
gas flow 3.5 bar. The following parameters were used for the APCI
mode: corona current 1.0 μA, sampling cone 10 V, cone gas flow
50 L/h, nebulizer gas flow 3.5 bar, source offset 50 V, source temperature 150 °C, probe temperature 600 °C and lock spray capillary voltage 3.0 kV. Column screening was performed in positive
and negative ion mode using ESI and full scan spectra acquisition.
Furthermore, the MSE mode was applied to detect the MS spectra
and the corresponding fragment spectra of each compound in one
run. The MSE method is characterized by two stages. In stage 1,
all ions are transmitted from the ion source through the collision
cell, wherein low collision energy is applied so that no fragmentation can be observed in the mass analyzer, and ions are recorded
as the precursor ions. In stage 2, all ions are transmitted from the
ion source through the collision cell, and a collision energy ramp
is applied to generate and record fragment ions in the mass analyzer. Hence, the software is able to generate two spectra at the
same time; the first one shows the precursor ions with no collision energy, and the second one generates fragment ions due to
the applied collision energy. The trap and transfer collision energy
of the low energy function was kept off and the ramp trap collision energy of the high energy function was set from 5 to 30 V. –
The obtained fragments were compared with online databases, i.e.,
HMDB and MzCloud for further confirmation.
therefore may show different selectivities. The Viridis BEH column (100 × 3.0 mm I.D, 1.7 μm) was selected for the preliminary
study. In addition, the Torus columns, namely, Diol, 2-PIC, 1-AA,
and DEA (100 × 3.0 mm I.D, 1.7 μm), were evaluated. The diol and
BEH columns represent the most polar stationary phases among
the selected ones, characterized by propandiol - bonded silica
support and free silanols, respectively. Furthermore, two columns
packed with modified C18 silica were included for column screening, namely, HSS C18 SB column (100 × 3.0 mm, 1.8 μm) and HSS
T3 (100 × 2.1 I.D; 1.8 μm). Additionally, the chiral stationary phase
Trefoil CEL 1 (150 × 3.0 mm I.D; 2.5 μm) was tested. All columns
were purchased from Waters (Milford, MA, USA).
2.4. UHPSFC/MS/MS instrumentation
UHPSFC/MS/MS analysis was performed on the Acquity UPC2
(Waters, Milford, MA, USA) hyphenated with the Synapt G2-Si
(Waters) QTOF mass spectrometer. The UHPSFC instrument was
coupled to the MS using the commercial interface kit (Waters).
Gradient mode was used for screening the stationary phase selected for the separation of the metabolite mixture. Supercritical
carbon dioxide (scCO2 ) was used as the mobile phase A, and MeOH
with 30 mmol L−1 ammonium acetate and 1, 2, or 5% of H2 O or
MeOH with 30 mM ammonium formate and 2% of H2 O was investigated as mobile phase B (modifier). The gradient started with 5%
of B, was increased to 70% B in 8.5 min, then to 100% B in 10.5 min,
kept constant for 2.5 min, and finally returned to the initial condition within 1 min and re-equilibrated for 1 min, with a total
run time of 15 min. Furthermore, a flow gradient was employed to
avoid instrument overpressure at 100% of the modifier; the starting
flow was set to 2.0 mL min−1 , decreased to 0.8 mL min−1 within
14 min, and back to the initial flow in 1 min. The ABPR was set
at 1800 psi and the column temperature at 60 °C. The injection
volume was 1 μL, and the injection needle was washed after each
injection with hexane/2-isopropanol/H2 O (2:2:1, v/v/v). MeOH with
0.1% of formic acid and 5% of H2 O was used as a make-up solvent to improve the ionization. Furthermore, a flow gradient for
the make-up solvent was used: 0 min – 0.6 mL min−1 , 8.5 min –
4
M. Antonelli, M. Holcˇ apek and D. Wolrab
Journal of Chromatography A 1665 (2022) 462832
2.5. Biological sample preparation
Human plasma collected from different healthy volunteers was
pooled, worked up, and analyzed with UHPSFC/MS under optimized conditions. All subjects signed an informed consent. An
additional step, namely, limited digestion with proteinase K was
added. Before protein precipitation, 2 μL of Proteinase K and 2 μL
of 250 mM CaCl2 were added to 100 μL of plasma sample to obtain a final concentration of 5 mM and sonicated for 15 min at
40 °C. For protein precipitation, 1 mL of CH3 OH/EtOH (1:1, v/v) was
added to the pooled plasma sample sonicated for 15 min at room
temperature (25 °C) and stored for 1 h at −20 °C. The sample was
centrifuged for 15 min at 10,0 0 0 rpm, the supernatant was transferred to a glass vial and evaporated under nitrogen. The residue
was dissolved with 35 μL of ACN/CH3 OH/H2 O (4:4:2, v/v/v) + 0.1%
formic acid and diluted 1:10 with the same solvent mixture. 1 μL
was injected for the subsequent UHPSFC/MS analysis.
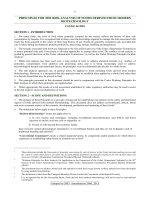
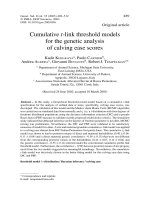
Fig. 1. Relation of partition coefficients (log10 P) and molecular weights for the investigated analytes and the number of metabolites categorized by compound class:
nucleosides (red), biogenic amine (yellow), amino acids (green), sugars (orange),
others (dark green), polar lipids (light blue), and nonpolar lipids (blue).
2.6. Data processing
lar weights from 89 to 900 Da and log10P values from −3.89
to 18.95 (Fig. 1). The substantial variety in the structural composition and chemical characteristics of selected compounds, i.e.,
polar amino acids to hydrophobic lipids such as triacylglycerols,
leads to highly diverse retention time behavior and different ionization efficiencies, altering sensitivity. The list includes metabolites involved in various biological pathways, e.g., metabolites derived from the tryptophan pathway. Tryptophan is an essential
amino acid, a building block for protein biosynthesis and functions
as a precursor for the conversion to several other metabolites included in our list, i.e., 5-hydroxytryptophan, tryptamine, serotonin,
melatonin, N-acetyl-5-hydroxytryptamine, l-kynurenine, l-alanine,
and glutamic acid. Furthermore, clinical studies have shown that
tryptophan metabolism promotes tumor progression through multiple mechanisms [35], and its metabolic derivative l-kynurenine
is involved in Alzheimer’s disease and the early stages of Huntington’s disease. The catecholamines dopamine, adrenaline, and
noradrenaline are derived from the tyrosine pathway [36] with
an implication in the treatment of dopamine-responsive dystonia
and Parkinson’s disease. In general, biogenic amines and amino
acids were chosen for their importance in several types of cancer, namely, ovarian, breast, pancreatic, colon, and oral cancers, and
neurodegenerative diseases. Similarly, sugars were included in this
optimization due to their large consumption by tumor cells [37].
Other two important biological classes of compounds are nucleosides and lipids, for which evident changes have been observed
in cancer patients [38,39]. The involvement of lipids in different
types of tumors such as pancreatic, gastric, liver, lung, colorectal,
and thyroid cancer was shown [40]. A schematic overview of the
biosynthesis reactions is presented in the supplementary information (Figs. S1 and S2), clearly illustrating how the various analytes
are interrelated. In total 64 from the 78 analytes shown, the missing 14 analytes mainly include metabolites, which are uptaken by
dietary means such as essential amino acids (6), caffeine and folic
acid, and consequently no biosynthesis can be shown. The remaining analytes were included in the analyte set for mechanistic questions, i.e., isomers. The importance and connection of amino acids
for the biosynthesis of biogenic amines, glucose as well as lipids
can be seen. Further, it is commonly assumed that the dysregulation or absence of some metabolites may harm the well-being.
To facilitate the elution of non-polar, polar, and ionic metabolites, the addition of methanol, including additives, to scCO2 was
necessary. A small amount of water was added to the mobile phase
to improve the peak shape and solvation of polar analytes. As a
consequence of the limited maximum upper pressure of the UHPSFC system, it was not possible to maintain high flow rates and
reach 100% of the modifier for the elution of polar compounds
Data were acquired with the MassLynx software (Waters). The
Waters Compression Tool was used for noise reduction, which also
minimized the raw data file size facilitating data handling. The
Accurate Mass Measure tool in MassLynx was used to apply lock
mass correction for better mass accuracy and for the conversion of
data from continuum to centroid mode, which further reduced the
file size. Finally, TargetLynx was used to extract retention times,
peak areas, peak height, peak widths (Pk width), and asymmetry
factors by providing exact masses and expected retention times
of all compounds. The resulting tables were exported as .csv files
and further processed with Microsoft Excel, i.e., to calculate the
number of identified standards and the relative standard deviation
(RSD%) of the retention time, peak area and peak height. MarkerLynx was used to generate feature lists of m/z with the corresponding retention time, which allowed the calculation of the mass accuracy. The complete summary tables from MarkerLynx were exported as .csv files and manually checked for experimental m/z of
each standard or target analyte.
Furthermore, MZmine 2.53 software [34] software was used to
assess the influence of the data processing procedure. The following settings were applied: the targeted peak detection module was used to search the list of compounds with a precursor
mass tolerance of 0.002 m/z or 5 ppm and a retention time tolerance of 0.1 min. Peak integration was checked and manually corrected when needed. Retention times, peak areas, peak heights,
peak widths (FWHM), asymmetry factors, and experimental m/z
were exported as .csv files and further processed with Microsoft
Excel. For the chromatographic evaluation, the resolution and selectivity (α ) were calculated. The results of two different software
solutions were compared (Tables 3 and S11).
MSDIAL ver. 4.70, was used for metabolite identification in
real human plasma using the databases MSMS-Public-pos-VS15 for
positive and MSMS-Public-Neg-VS15 for negative ion mode. The
databases are composed of metabolites in plasma, which were detected by the MSDIAL community, whereby 13,303 entries are included for positive ion mode and 12,879 entries for negative ion
mode.
3. Results and discussion
3.1. Selection of standard compounds
The selected analytes (Tables 1 and S1) were selected from the
Human Metabolome Database based on their biological relevance
with a special focus on the metabolites involved in cancer progression [12,16]. The final metabolite mixture varied in molecu5
M. Antonelli, M. Holcˇ apek and D. Wolrab
Journal of Chromatography A 1665 (2022) 462832
Table 3
Summary tables of mass accuracy, selectivity, resolution, and the repeatability of the retention time, signal area, and signal height calculated by the average
RSD% for ammonium acetate and ammonium formate in positive and negative ionization mode using TargetLynx and MZmine as data processing software.
TargetLynx
Ammonium acetate
positive
Ammonium Formate
negative
positive
negative
Mass Accuracy (ppm)
Selectivity
Resolution
Repeatability (RSD%)
Retention time
Signal Area
Signal Height
MZmine
Mass Accuracy (ppm)
Selectivity
Resolution
Repeatability (RSD%)
Retention time
Signal Area
Signal Height
2.94
2.36
39
2.81
1.3
36
1.64
6.57
40
1.64
1.32
39
0.2
8.95
9.26
0.15
7.84
8.33
0.52
7.17
7.45
0.1
9.28
10.09
2.78
2.35
35
1.98
1.28
29
2.32
7.28
36
2.1
1.06
20
0.31
14.56
10.06
0.13
10.29
7.57
0.61
11.6
9.29
0.14
12.31
10.57
at the same time. Therefore, a decreasing flow rate gradient was
applied simultaneously with the organic modifier gradient, allowing us to reach 100% of the modifier. This approach, called unified
chromatography, was introduced by Chester [28]. The adjustment
of the eluent strength of the modifier up to 100% enabled to widen
the polarity range of the analyte set suitable for UHPSFC/MS measurements.
starting from 5% modifier to 75% in 10 min, and gradient B starting from 5% modifier to 70% modifier in 8.5 min. Analytes eluted
faster and showed better peak shapes with gradient B (Fig. S3B)
compared to gradient A (Fig. S3A). Consequently, gradient B was
further used for column screening.
3.2. Screening of water percentage and gradient evaluation with BEH
column
The choice of stationary phase chemistry, column dimensions,
and mobile phase composition is crucial for successful separation. Subsequently, various stationary phases were evaluated for
the separation performance of the standard metabolite mixture,
such as Diol, 2-PIC, 1-AA, DEA, BEH, CEL 1, HSS C18 SB and HSS
T3 (Table 2). All columns are classified as UHPSFC columns (except
HSS T3), are produced by the same manufacturer (Waters, Torus,
and Viridis columns) and most had the same sub-2 μm particle dimensions as well as column length and diameter, for better comparability (100 × 3.0 mm I.D, 1.7 μm, fully porous hybrid silica)
[18,21,31].
The eight stationary phases screened were dedicated UHPSFC
columns from the same manufacturer with sub-2 μm particles. The
majority of the stationary phases are composed of the same backbone (bridged ethylene hybrid particles) ensuring that the nonselective interactions are comparable and the different selectors
bonded on the silica support cause differences in the chromatographic performance. The different selectors bonded to the silica
support allow different selectivities for the separation of the studied metabolites as a result of the different interaction capabilities
of the analyte and the stationary phase. The simplest stationary
phase regarding the selector structure is the BEH column with free
silanols on the surface, allowing H-bonding and hydrophilic interactions. For the Diol column, propandiol is linked to the modified
silica support. Consequently, the hydroxyl groups allow H-bonding
and hydrophilic interactions, but the hydrocarbon chains provide
hydrophobic interactions as well. The silica particles of Torus 2-PIC,
Torus 1-AA, and Torus DEA are modified with 2-picolyl-amine, 1amino-anthracene, and diethylamine, respectively. These structures
allow multiple interactions of the selector with the analyte, such as
steric interactions, hydrogen bonding, Van der Waals interactions,
dipole-dipole interactions, anionic exchange type, or π -π interactions. The columns HSS C18 SB (100 × 3 mm I.D; 1.8 μm) and HSS
T3 (100 × 2.1 mm I.D; 1.8 μm) columns are packed with silica particles modified with octadecyl bonded ligands on the surface, enabling hydrophobic interactions. The columns differ in their residual activity of the silanol group, as HSS C18 T3 is end-capped compared to HSS C18 SB. The free residual silanol groups additionally
3.3. Column screening and performance evaluation
The chromatographic performance of the Viridis BEH column
was evaluated for three different percentages (1%, 2% and 5%) of
water in the methanolic modifier, while the concentration of ammonium acetate was kept constant at 30 mmol L−1 . The addition of
2–7% of water to the modifier [12,16,20,31] to facilitate the elution
of polar compounds and to improve peak shape, probably caused
by the improved solubility, is commonly reported in the recent literature. Six consecutive injections of the standard mixture were
performed in positive and negative ion modes to test the influence
of 1, 2, and 5% H2 O in the modifier on the chromatographic performance. Retention times of 78 selected metabolites are reported in
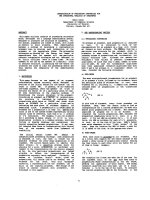
Table S2. Fig. 2 shows the overlay of chromatograms obtained for
three different amounts of water in the modifier for various compounds. Generally, the retention time increased with increasing
amount of water in the modifier. For some analytes (Fig. 2A,C), the
peak shape worsened, and peak tailing occurred using 5% of water in the modifier. Furthermore, a gradual increase in the system
pressure was observed using 5% of water in the modifier, which
regularly caused overpressure of the instrument. The experiment
was repeated after several weeks to ensure that this observation
was not an artefact. The same trend of the gradual increase of the
system pressure was observed, which could be caused by solubility
issues of the additive in the mobile phase leading to precipitation
and column blockage. A good compromise was obtained with 2%
or 1% of water in the modifier; all compounds were eluted without any impairment of the Gaussian peak shape (Fig. 2). However,
nonpolar triacylglycerols and diacylglycerols were eluted close to
the void volume with 1% of water in the modifier. Consequently, 2%
of water in the modifier was assessed as the most suitable amount
of water in the modifier to achieve the best balance in terms of
retention time and peak shape.
The next step of the study was to improve the gradient shape
to obtain a good separation of the entire standard mixture as well
as good peak shapes. Two gradients were evaluated, gradient A
(used for the evaluation of the percentage of water in the modifier)
6
M. Antonelli, M. Holcˇ apek and D. Wolrab
Journal of Chromatography A 1665 (2022) 462832
Fig. 2. Effect of water percentage (1% - green, 2% - red, and 5% - blue) in the mobile phase on the retention behavior of selected metabolites: A) l-tryptophan, B) N-acetyl5-OH-tryptamine (I°) and serotonin (II°), C) d-glucose (I°) and myo-inositol (II°), and D) LPC (18:1) (I°) and PC (36:2) (II°). Analytical conditions: BEH (100 × 3.0 mm, 1.7 μm)
column; 60 °C; 1800 psi (ABPR); mobile phase: CH3 OH + 30 mmol L−1 ammonium acetate, and 1%, 2%, and 5%; composition of the make-up solvent: CH3 OH + 0.1% formic
acid and 5% of H2 O.
allow hydrophilic interactions in the case of the HSS C18 SB, which
may be advantageous for the analysis of polar compounds. Trefoil
CEL1 (150 × 3.0 mm I.D; 2.5 μm) is a stationary phase based on
polysaccharides, in which the silica gel is modified with cellulose
tris-(3,5-dimethylphenylcarbamate), allowing multiple interactions
such as steric interactions, hydrogen bonding, π -π interactions.
Different chromatographic parameters were evaluated to determine the best column for the separation of the analyte mixture, such as the number of compounds not detected and the
peak asymmetry factor (As ), which is calculated as the ratio of
the peak width in the back half and the peak width in the front
half at 10% of the peak height. For better comparability, the same
gradient was applied for the separation of 78 metabolites for all
stationary phases investigated (Fig. S3B). The retention times of
each standard for each tested column are reported in Table S2.
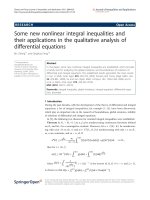
Fig. 3A shows the chromatograms of guanine and guanosine depending on the employed stationary phase. The highest number
of compounds detected, depending on the stationary phase, was
as follows: Diol > BEH > 2-PIC > HSS C18 SB > DEA > Cel
1 > 1-AA > HSS T3 (Fig. 3B). This indicates that with increasing hydrophobicity and bulkiness of the stationary phase selector, less analytes are detected. However, some hydrophobic interactions favor separation and detection in comparison to only hydrophilic interactions, as reflected for the Diol and BEH columns.
Each compound was injected separately as well as in a mixture for
each column. Therefore, the compounds not detected in the analyte mixture are below the detection sensitivity because they were
identified when injected separately, some at higher concentrations.
This proves that the analytes are eluted for each column, but because of the broad peak shape and high asymmetry, they were below the detection sensitivity, not allowing their identification. The
most difficult compounds to identify for most of the columns were
metabolites with primary amines in the structure. The primary
amines may undergo ionic interactions with the free silanols of
the stationary phase. As ionic interactions are generally slow, broad
peak shapes can be observed, which may lead to sensitivity issues.
The enhancement of the cation concentration in the mobile phase
could lead to an improvement of the peak shape and sensitivity
since cations function as displacers. On the other hand, increased
base concentrations in the mobile phase may lead to ion suppression. The detection sensitivity was diminished especially for the
metabolites PS, LPS, PG, LPG, PA and LPA, putrescine, spermine,
spermidine, and dopamine, and 5-methoxyindole, 5-hydroxyindole,
D,L-dylurenine, and folic acid.
The performance of the column was generally considered acceptable when the As value was in the range of 0.9–1.5. Therefore,
for each column, the percentage of compounds not detected, the
analytes with As below 0.9 and with As greater than 1.5 were calculated (Fig. S4). The highest percentage of symmetrical peaks was
observed for BEH > DEA > Diol > Cel 1 > 1-AA > 2-PIC > HSS
C18 > HSS T3 in positive ion mode and BEH > DEA > 2-PIC > HSS
T3 > Cel 1 > Diol > 1-AA > HSS C18 in negative ion mode
(Table S3). Furthermore, the asymmetry values of each detected
compound and their total average for the eight screened columns
are reported in Table S3. Broad chromatographic peaks and tailing were found for the lipid classes PS, LPS, PG, LPG, PA, and LPA,
as also known from the literature. For biogenic amines, namely
spermine, spermidine, and putrescine, a broad and distorted peak
shape was observed. The results suggest that the Diol column represents a good compromise between the number of detected peaks
and the asymmetry values compared to the other seven columns.
The performance of the method was further investigated
by determining the mass accuracy, selectivity, resolution, peak
area, peak height, retention time stability, and number of total
compounds detected in both polarity modes (Tables S4–S9). Ltryptophan was selected as the reference compound for the calculation of resolution and selectivity, as one of the last eluting analytes. The average time of the first peak in the run from three
consecutive blanks (solution of CH3 OH/CHCl3 , 1:1 v/v) was considered as the void time needed to calculate the capacity factors
(Table S5). The median of selectivity and the average of all determined resolution values for each column were investigated. They
were determined from the average values of six consecutive injections of the standard mixture for each column by applying the
optimized conditions. The median and the average of the overall mass accuracy, selectivity, and resolution are reported in Ta7
M. Antonelli, M. Holcˇ apek and D. Wolrab
Journal of Chromatography A 1665 (2022) 462832
Fig. 3. (A) Selected chromatograms for guanine (I°) and guanosine (II°) on the various stationary phases (red: 1-AA, green: BEH, light blue: Diol, violet: 2-PIC, dark blue:
DEA). (B) Bar chart for the number of detected compounds (blue) and non-detected compounds (red) for individual screened columns. (C) Median of the selectivity values
and (D) Average of the resolution values for all metabolites on the various stationary phases. Analytical conditions: mobile phase: CH3 OH + 30 mmol L−1 ammonium acetate
and 2% of water; mobile phase of the make-up pump: CH3 OH + 0.1% formic acid and 5% of H2 O; 60 °C, 1800 psi (ABPR), ESI (+) and ESI (−).
The highest average retention time was observed for BEH > HSS
C18 > Diol > 1-AA > DEA > 2-PIC > Cel 1 > HSS T3 in positive ion mode and BEH > DEA > Diol > 1-AA > 2-PIC > HSS
C18 > Cel 1 > HSS T3 in negative ion mode. The relative standard
deviation of the retention times of the analyte for 6 consecutive
injections of the metabolite mixture on each stationary phase was
investigated, describing the reproducibility of the retention time.
The highest stability of retention time was observed for Diol > Cel
1 > DEA > 1-AA > 2-PIC > BEH > HSS C18 > HSS T3 in positive
ion mode and DEA > Diol > 1-AA > 2-PIC > BEH > Cel 1 > HSS
C18 > HSS T3 in negative ion mode.
The Diol column did not provide the best results for each evaluated parameter, but the comparison of the chromatographic parameters mentioned for each compound and stationary phase, including the total number of detected peaks in positive and negative ion modes, reveals that the overall best performance was
achieved with the Diol column, as also previously reported for urinary metabolites [18]. 67 of the 78 structural and chemical highly
diverse compounds in the mixture were detected on the Diol column. In order to investigate the reason for detected and nondetected compounds depending on the analyte structure, the analyte set was classified according to their functional groups (Table S14). However, no general trend depending on the presence
of functional groups was observed. The Diol column was used for
further evaluation within this study. The putative explanation for
which Diol worked well for the separation of most of the analytes
is the possible polar and hydrophobic interactions of the stationary phase with the polar and hydrophobic parts of the analytes.
Further, the small selector structure of the Diol column may favor
the accessibility of the analytes to interact with the selector of the
stationary phase, in contrast to the bigger selectors tested, which
may be leading to steric hindrance.
The reliable separation of isomeric and/or isobaric metabolites
in complex biological samples is important in metabolomics studies. Examples of isomeric metabolites included in our selected
standard mixture are leucine, isoleucine, and norleucine, some sug-
bles S4–S6, as well as the average and RSD% of the peak area,
peak height, and retention time in Tables S7–S9. The median obtained for all analytes was used to compare the overall selectivity
of the stationary phases, since the overall average may be influenced by analytes eluted close to the void volume. The highest
median selectivity was observed for DEA > Cel 1 > 2-PIC = 1AA > BEH > HSS T3 > Diol > HSS C18 in positive ion (Fig. 3C)
mode and BEH > 1-AA > 2-PIC = HSS T3 = HSS C18 > Cel
1 > Diol > DEA in negative ion mode (Table S5). It should be mentioned that much fewer compounds were detected and differences
in the median selectivity are negligible in the negative ion mode
compared to the positive ion mode (Tables S2 and S5). The highest average resolution was observed for DEA > Diol > BEH > 2PIC > 1-AA > Cel 1 > HSS C18 > HSS T3 in positive (Fig. 3D) and
DEA > Diol > BEH > 2-PIC > 1-AA > HSS C18 > Cel 1 > HSS
T3 in negative ion mode (Table S6). A small shift in mass precision was observed, which corresponds to the retention time of
the analyte (Table S4). The ionization efficiency depends on the
gradient shape of the chromatographic run and, consequently, on
the retention times of the analytes. Furthermore, the type of interactions of the analytes with the stationary phase influences the
peak shape, because ionic interactions are slow and may lead to
broader peaks in comparison to faster interactions such as interactions based on partition or solubility. The peak area, peak height,
and average retention time together with the retention time stability were investigated. The highest average peak area was observed for HSS T3 > HSS C18 > Diol > BEH > Cel 1 > 1-AA > 2PIC > DEA in positive ion mode and HSS T3 > HSS C18 > Cel
1 > > BEH > 2-PIC > Diol > 1-AA > DEA in negative ion mode
(Table S7). The highest average peak height was observed for HSS
T3 > HSS C18 > 2-PIC > Diol > 1-AA > BEH > Cel 1 > DEA in
positive ion mode and Diol > DEA > 2-PIC > BEH > 1-AA > Cel
1 > HSS C18 > HSS T3 in negative ion mode (Table S8). The average retention times on the different stationary phases show the
distribution of analytes within the chromatographic run and the
extent and type of interactions of the analyte with the selector.
8
M. Antonelli, M. Holcˇ apek and D. Wolrab
Journal of Chromatography A 1665 (2022) 462832
ars such as d-glucose and myo-inositol, dopamine and octopamine,
as well as N-acetyl-serotonin and 1-methyl-tryptophan. Examples
of isobaric metabolites investigated are asparagine and ornithine,
aspartic acid and 5–hydroxy-indole, glutamine, and lysine, as well
as glutamic acid and 5–methoxy-indole. Only the BEH and the
Diol column yielded a partial separation of leucine and isoleucine
with respect to norleucine, while their coelution with all other
columns was detected. Dopamine and octopamine are also important examples of isomers. The first was below its detection
sensitivity, which did not allow detection in most cases; on the
other hand, octopamine was easily detected. However, each standard was injected individually, allowing good separation between
these two compounds. In fact, octopamine was eluted on each column between 5 and 7 min, while dopamine was eluted between
8 and 9 min on various stationary phases. Finally, the isomers
d-glucose and myo-inositol, as well as N-acetyl-serotonin and 1methyl-tryptophan, were always separated independently of the
stationary phase. All detected isobaric metabolite pairs were as
well separated on all stationary phases investigated. These results
have shown that the optimized method provides good separation
of not only very diverse metabolites but also some of their isomers
and isobars.
18 of the 78 compounds investigated in our study were also
included in the analyte set investigated by Losacco et al. of 49
compounds [16] and Desfontaine et al. of 57 compounds [12], such
as some amino acids, biogenic amines, nucleosides and lipids. For
comparison reasons, special focus was placed on the evaluation
of the separation performance of those compounds. A good peak
shape and peak asymmetry have been reached applying the Diol
column, i.e., for adenosine, leucine, and sphingomyelin (1.61, 1.45,
and 1.31, respectively; Table S3). Additionally, the% RSD of retention time stability was determined for each column (Table S9). The
overall stability of the retention time was 0.31% RSD for the Diol
column and 0.06, 0.41 and 0.07% for adenosine, leucine and sphingomyelin, respectively. In conclusion, the reported method yielded
comparable results for the Diol column in comparison to the data
shown by Losacco et al. using the Poroshell HILIC column [16]. It is
important to emphasize, that the column screening was performed
for UHPSFC/MS dedicated sub 2-μm columns from the same manufacturer and the larger set of analytes in terms of polarity and
mass range in the present work. The metabolites investigated are
mainly interrelated (Figs. S1 and S2), besides chosen analytes included to study mechanistic aspects. This enabled a complete and
exhaustive analysis of chromatographic and mass spectrometric parameters.
Fig. 4. Base peak intensity chromatograms of the standard set of metabolites obtained under optimized conditions (black) and reconstructed ion current chromatograms for selected compounds: caffeine (red), MG (0:0/18:1/0:0) (blue), Cer
(d36:2) (olive), sphinganine (d18:0) (orange), melatonin (wine), adenine (magenta),
adenosine (violet), N-acetyl-5-OH-tryptamine (royal), LPC (18:1/0:0) (cyan), palmitoylcarnitine (dark yellow), acetylcarnitine (dark cyan), taurine (pink), l-tyrosine
(light magenta), l-tryptophan (dark gray), 5-OH-l-tryptophan (light orange), and larginine (light blue). Analytical conditions: Diol (100 × 3.0 mm; 1.7 μm); mobile
phase: CH3 OH + 30 mmol L−1 ammonium acetate and 2% of water; composition of
the make-up solvent: CH3 OH + 0.1% formic acid and 5% of H2 O; 60 °C, 1800 psi
(ABPR), ESI (+).
mass accuracy, selectivity, resolution and RSD of the peak area,
peak height, and retention time. Furthermore, detailed values for
each compound, depending on the additive applied on the Diol
column, are reported in Tables S3–S10 for ammonium acetate and
Tables S10–S11 for ammonium formate. The average mass accuracy, selectivity, and resolution was slightly higher for ammonium
formate than ammonium acetate (Table 3). No general trend was
observed for the signal and retention time stability depending on
the additive. However, ammonium acetate was selected as the additive of choice in the mobile phase for the investigated analyte
set because of the slightly higher number of detected compounds
and the higher signal response. Data processing was performed
independently with TargetLynx, which was used by default, and
MZmine, to assess whether the data processing software has an
impact on the results (Table S11). The same chromatographic and
method parameters were investigated with MZmine as with TargetLynx, and compared to each other. Data were comparable but
not the same, which shows that the data processing software employed may have an impact on the results.
Finally, the Diol column (100 × 3 mm I.D; 1.7 μm), the modifier
of MeOH with 30 mmol L−1 ammonium acetate and 2% of water,
the make-up solvent of MeOH with 0.1% formic acid and 5% of water (see Fig. 4) were evaluated as the best choice for the separation
of the investigated analyte set.
3.4. Evaluation of ammonium acetate versus ammonium formate as
an additive in the modifier
The influence of the type of additive in the mobile phase
on retention time, peak area, peak height, mass accuracy, selectivity, resolution, and peak asymmetry for the standard mixture
was investigated using the Diol column. Six consecutive injections were performed using 30 mmol L−1 of ammonium acetate in
CH3 OH/H2 O (98:2, v/v) or 30 mmol L−1 of ammonium formate in
CH3 OH/H2 O (98:2, v/v) as a modifier. The peak areas and heights
of each detected compound were normalized to the average intensity of the lock mass to diminish the influence of the drift of
the instrumental response over time (Table S10). The processed
data of the normalized area and normalized height were compared
using bar graphs for the positive (Figs. S5 and S6) and negative
(Figs. S7 and S8) ionization mode. Signal responses for all compounds were higher for ammonium acetate compared to ammonium formate (Table S10). As a result, a higher number of compounds were detected with ammonium acetate (67) than with ammonium formate (65). Table 3 shows a summary of the average
3.5. Comparison of ESI and APCI ionization techniques
The ionization efficiency may change depending on the chemical properties and chemical structure of the analyzed compounds
and the applied ion source. ESI is the most widely used ion source.
Sensitivity strongly depends on the flow rates employed, since ESI
represents a concentration-dependent ionization technique. APCI is
a mass flow dependent ionization process more suitable for higher
flow rates. UHPSFC/MS methods generally use flow rates higher
than those of UHPLC/MS methods; therefore, the evaluation of the
ion source on the ionization efficiency of target compounds may
be of interest. However, the majority of UHPSFC/MS methods use
9
M. Antonelli, M. Holcˇ apek and D. Wolrab
Journal of Chromatography A 1665 (2022) 462832
a splitter, which reduces the flow into the mass spectrometer favoring ESI. A systematic investigation was conducted to evaluate
the influence of the ionization source on the number and type of
detected analytes. The standard mixture was analyzed by ESI and
APCI in both polarity modes. The optimized chromatographic conditions and optimized ion source parameters were applied. The results showed that ESI in general led to a higher ionization efficiency compared to APCI (Figs. S9–S12). However, for some analytes, the peak area and peak height (normalized to the sum area
and sum height considering the total compounds in the positive
and negative ionization mode for the ESI and APCI sources) were
higher for the APCI source than for the ESI source, showing that
ESI and APCI can be complementary (Table S12). The sensitivity
was higher for several amino acids, such as l-tyrosine, ornithine,
phenylalanine, taurine, as well as l-tryptophan, l-arginine, and
l-lysine and two nucleosides (adenine and guanine) using APCI,
and dopamine was only detected using the APCI source. On the
other hand, the areas and heights of the l-carnitine derivatives,
LPC (18:0), and melatonin were enhanced with ESI. l-carnitine and
acetyl-l-carnitine were only detected using ESI. To illustrate the
comparison of the normalized area and height for some identified
standards in positive ion mode for both ion sources, bar graphs are
shown in Figs. S9–S12. The corresponding values of the normalized
peak areas, heights, and retention times of each standard for both
ion sources are reported in Table S12. The total number of detected
compounds was 67 and 48 for ESI and APCI, respectively, showing
the wider application range of ESI for the investigated analyte set
[32]. In the negative ionization mode, most analytes were not detected using APCI (Figs. S11 and S12). Furthermore, in the negative
ionization mode, the signal response was significantly lower than
in the positive ionization mode, regardless of the ion source type.
ESI provided the overall best ionization efficiency for the analyte
set in both ion modes.
3.6. Application to human plasma
Optimized chromatographic and MS conditions were applied
for the analysis of pooled human plasma samples to evaluate the
applicability of the method to real samples. The protocol used
for sample preparation was based on the application of an additional step prior to protein precipitation based on the addition
of proteinase K. This procedure allowed the release of associated
metabolites through relaxation of the tertiary structure of native
proteins and consequently a higher possibility of their identification [41]. In addition, plasma samples obtained by the following
protein precipitation were injected and analyzed in MSE mode.
MSE mode allows the untargeted scanning of the MS and MS/MS
levels by applying low and high collision energy within one run.
This increases the identification confidence of metabolites, as the
characteristic fragments of metabolites provide additional information. First, the standard mixture was analyzed to obtain clean fragment ion spectra as reference without interferences caused by the
complex matrix of a real human plasma sample using ESI and APCI.
No differences in fragmentation behavior were observed between
ESI and APCI (Table S13). The diluted human plasma sample (1:10)
was analyzed using ESI and APCI. Fig. 5A shows the TIC of human
plasma obtained with ESI and APCI. It can be seen that the sensitivity is higher for ESI than APCI, also for real human plasma samples. The extracted ion chromatograms (XIC) of selected metabolites detected in human plasma are presented in Fig. 5B using ESI.
The targeted data analysis revealed that 44 and 5 compounds included in the analyte set were also detected in the diluted plasma
sample using ESI and APCI, respectively, in positive and negative
ion mode (Table S15). The reduction of the sample complexity by
optimizing the sample preparation protocol, i.e., using solid phase
extraction, may help increasing the sensitivity to detect the whole
analyte set in human plasma. The untargeted MSE approach allowed the use of metabolomics databases to link m/z features to
Fig. 5. (A) Impact of the type of ion source on sensitivity. Base peak intensity chromatogram of human plasma using red) ESI and blue) APCI. (B) Selected extracted ion
chromatograms of human plasma using ESI (green: ornithine, blue: glucose, red: serotonine, black: adenosine) Pie charts of the untargeted m/z feature analysis in human
plasma for (C) positive and (D) negative ion mode using MS DIAL. 5823 m/z features were detected in positive and 2769 m/z features in negative ion mode. The m/z features
were categorized according to the compound class: red) analyte set of the study, green) nucleoside and derivatives, orange) amino acids and derivatives, violet) polyphenols,
light blue) lipids and dark blue) other metabolites. Analytical conditions: Diol (100 × 3.0 mm; 1.7 μm); mobile phase: CH3 OH + 30 mmol L−1 ammonium acetate and 2% of
water; composition of the make-up solvent: CH3 OH + 0.1% formic acid and 5% of H2 O; 60 °C, 1800 psi (ABPR), ESI (+).
10
M. Antonelli, M. Holcˇ apek and D. Wolrab
Journal of Chromatography A 1665 (2022) 462832
metabolites for identification. MSDIAL was used for the identification of metabolites considering also the MS2 level. The optimized
method allowed the detection of 5823 and 2789 features in human plasma in positive and negative ion mode, respectively, using
ESI (Fig. 5C,D). The detected features were classified according to
the compound class, such as amino acids and derivatives, nucleosides and derivatives, polyphenols, lipids, other metabolites, and
compounds included in the analyte set. The 27 and 22 compounds
also included in the analyte set for optimization detected with MSDIAL in positive and negative ion mode, were also identified with
TargetLynx when targeted data processing was applied. Generally, a
few more compounds belonging to the analyte set were identified
with TargetLynx (38 and 23 compounds in positive and negative
ion mode) than MSDIAL, due to the optimized filtering and threshold settings applied for MSDIAL. This, together with the comparison of the MS2 spectra and the retention times of all compounds
present in the standard mixture to the real sample, allowed a certain quality control, may minimizing the risk of overreporting of
identified compounds by MSDIAL.
Acknowledgment
This work was supported by the junior grant project 20-23290Y
funded by the Czech Science Foundation. M.A. acknowledges the
support of the project “International mobility of employees of the
University of Pardubice II” CZ.02.2.69/0.0/0.0/18_053/0016969.
Supplementary materials
Supplementary material associated with this article can be
found, in the online version, at doi:10.1016/j.ejps.2020.105216.
References
[1] C. Gieger, L. Geistlinger, E. Altmaier, M.H. De Angelis, F. Kronenberg,
T. Meitinger, H.W. Mewes, H.E. Wichmann, K.M. Weinberger, J. Adamski, T. Illig,
K. Suhre, Genetics meets metabolomics: a genome-wide association study of
metabolite profiles in human serum, PLoS Genet. 4 (2008), doi:10.1371/journal.
pgen.10 0 0282.
[2] Y. Chen, J. Xu, R. Zhang, Z. Abliz, Methods used to increase the comprehensive
coverage of urinary and plasma metabolomes by MS, Bioanalysis 8 (2016) 981–
997, doi:10.4155/bio-2015-0010.
[3] U. Roessner, J. Bowne, What is metabolomics all about? BioTechniques 46
(2009) 363–365, doi:10.2144/000113133.
[4] I. Kohler, M. Giera, Recent advances in liquid-phase separations for clinical
metabolomics, J. Sep. Sci. 40 (2017) 93–108, doi:10.10 02/jssc.20160 0981.
[5] M. Zhou, L. Song, S. Ye, W. Zeng, H. Hännien, W. Yu, J. Suo, Y. Hu, J. Wu, New
sights into lipid metabolism regulation by low temperature in harvested Torreya grandis nuts, J. Sci. Food Agric. 99 (2019) 4226–4234, doi:10.1002/jsfa.
9653.
[6] W.B. Dunn, D. Broadhurst, P. Begley, E. Zelena, S. Francis-Mcintyre, N. Anderson, M. Brown, J.D. Knowles, A. Halsall, J.N. Haselden, A.W. Nicholls, I.D. Wilson, D.B. Kell, R. Goodacre, Procedures for large-scale metabolic profiling of
serum and plasma using gas chromatography and liquid chromatography coupled to mass spectrometry, Nat. Protoc. 6 (2011) 1060–1083, doi:10.1038/nprot.
2011.335.
[7] E. Zelena, W.B. Dunn, D. Broadhurst, S. Francis-McIntyre, K.M. Carroll, P. Begley,
S. O’Hagan, J.D. Knowles, A. Halsall, I.D. Wilson, D.B. Kell, Development of a
robust and repeatable UPLC - MS method for the long-term metabolomic study
of human serum, Anal. Chem. 81 (2009) 1357–1364, doi:10.1021/ac8019366.
[8] H.G. Gika, G.A. Theodoridis, R.S. Plumb, I.D. Wilson, Current practice of liquid chromatography-mass spectrometry in metabolomics and metabonomics,
J. Pharm. Biomed. Anal. 87 (2014) 12–25, doi:10.1016/j.jpba.2013.06.032.
[9] M.R. Gama, R.G. da Costa Silva, C.H. Collins, C.B.G. Bottoli, Hydrophilic interaction chromatography, TrAC Trends Anal. Chem. (2012) 48–60, doi:10.1016/j.
trac.2012.03.009.
[10] B. Buszewski, S. Noga, Hydrophilic interaction liquid chromatography (HILIC)a powerful separation technique, Anal. Bioanal. Chem. 402 (2012) 231–247,
doi:10.10 07/s0 0216- 011- 5308- 5.
[11] C.F. Poole, Stationary phases for packed-column supercritical fluid chromatography, J. Chromatogr. A 1250 (2012) 157–171, doi:10.1016/j.chroma.2011.12.040.
[12] V. Desfontaine, G.L. Losacco, Y. Gagnebin, J. Pezzatti, W.P. Farrell, V. GonzálezRuiz, S. Rudaz, J.L. Veuthey, D. Guillarme, Applicability of supercritical fluid
chromatography – mass spectrometry to metabolomics. I – optimization
of separation conditions for the simultaneous analysis of hydrophilic and
lipophilic substances, J. Chromatogr. A 1562 (2018) 96–107, doi:10.1016/j.
chroma.2018.05.055.
[13] D.A. Klesper, Corwin E, Turner A.H, High pressure gas chromatography
above critical temperature, J. Org. Chem. 27 (1962) 700–706, doi:10.1021/
jo01049a069.
[14] L. Laboureur, M. Ollero, D. Touboul, Lipidomics by supercritical fluid
chromatography, Int. J. Mol. Sci. 16 (2015) 13868–13884, doi:10.3390/
ijms160613868.
[15] T. Bamba, J.W. Lee, A. Matsubara, E. Fukusaki, Metabolic profiling of lipids by
supercritical fluid chromatography/mass spectrometry, J. Chromatogr. A 1250
(2012) 212–219, doi:10.1016/j.chroma.2012.05.068.
[16] G.L. Losacco, O. Ismail, J. Pezzatti, V. González-Ruiz, J. Boccard, S. Rudaz,
J.L. Veuthey, D. Guillarme, Applicability of supercritical fluid chromatography–
mass spectrometry to metabolomics. II–assessment of a comprehensive library
of metabolites and evaluation of biological matrices, J. Chromatogr. A 1620
(2020) 461021, doi:10.1016/j.chroma.2020.461021.
[17] V. Shulaev, G. Isaac, Supercritical fluid chromatography coupled to mass
spectrometry – a metabolomics perspective, J. Chromatogr. B Anal. Technol.
Biomed. Life Sci. 1092 (2018) 499–505, doi:10.1016/j.jchromb.2018.06.021.
[18] A. Sen, C. Knappy, M.R. Lewis, R.S. Plumb, I.D. Wilson, J.K. Nicholson,
N.W. Smith, Analysis of polar urinary metabolites for metabolic phenotyping using supercritical fluid chromatography and mass spectrometry, J. Chromatogr. A 1449 (2016) 141–155, doi:10.1016/j.chroma.2016.04.040.
[19] W. Zou, J.G. Dorsey, T.L. Chester, Modifier effects on column efficiency in
packed-column supercritical fluid chromatography, Anal. Chem. 72 (20 0 0)
3620–3626, doi:10.1021/ac991417u.
4. Conclusion
The goal of this work was the development of a UHPSFC/MS
method for the qualitative analysis of a wide range of metabolites
in terms of polarity and its application to human plasma samples. Particular attention was paid to the choice of the optimal
chromatographic column and the mobile phase composition. The
set of 78 standards was chosen for the evaluation of chromatographic parameters, allowing the standard mixture to represent
plasma metabolites that are interrelated and of clinical relevance.
Preliminary tests were performed on the Viridis BEH column and
subsequently optimized conditions were applied for the screening
of eight dedicated UHPSFC/MS columns from the same manufucturer ensuring comparable non-selective interactions from the particle backbone. The best column for the separation of the standard
mixture was the Torus Diol column with 67 out of 78 detected
compounds with selectivity and resolution values of 1.28 and 39,
respectively. Furthermore, the optimized method allowed the separation of important metabolite isomers, such as myo-inositol and
d-glucose, as well as amino acids l-leucine, l-isoleucine, and lnorleucine. The sensitivity was higher for ammonium acetate compared to ammonium formate used as an additive in the modifier.
Data processing was performed with two different software packages, TargetLynx and MZmine. The results were comparable but not
the same, highlighting the importance of experimental details in
untargeted metabolomics. Finally, the influence of ESI and APCI ion
sources on the ionization efficiency was evaluated for the standard
mixture and human plasma samples using MSE mode. Generally,
ESI provides higher sensitivity in comparison to APCI. The applicability of UHPSFC/MS for the qualitative metabolomic analysis has
been confirmed, but there is still a need for further improvements,
such as the optimization of the sample preparation protocol, to obtain a sensitive, quantitative method using UHPSFC/MS.
Declaration of Competing Interest
The authors declare that they have no conflict of interest.
CRediT authorship contribution statement
Michela Antonelli: Investigation, Formal analysis, Writing –
original draft, Visualization. Michal Holcˇ apek: Resources, Writing
– review & editing. Denise Wolrab: Conceptualization, Funding acquisition, Supervision, Project administration, Writing – review &
editing.
11
M. Antonelli, M. Holcˇ apek and D. Wolrab
Journal of Chromatography A 1665 (2022) 462832
[20] A. Raimbault, M. Dorebska, C. West, A chiral unified chromatography–mass
spectrometry method to analyze free amino acids, Anal. Bioanal. Chem. 411
(2019) 4909–4917, doi:10.10 07/s0 0216- 019- 01783- 5.
[21] E. Lemasson, S. Bertin, P. Hennig, H. Boiteux, E.L. Westa, C. West, Development of an achiral supercritical fluid chromatography method with ultraviolet
absorbance and mass spectrometric detection for impurity profiling of drug
candidates. Part I: optimization of mobile phase composition, J. Chromatogr. A
1408 (2015) 217–226, doi:10.1016/j.chroma.2015.07.037.
[22] K. Taguchi, E. Fukusaki, T. Bamba, Supercritical fluid chromatography/mass
spectrometry in metabolite analysis, Bioanalysis 6 (2014) 1679–1689, doi:10.
4155/bio.14.120.
[23] T.A. Berger, Demonstration of high speeds with low pressure drops using
1.8 μm particles in SFC, Chromatographia 72 (2010) 597–602, doi:10.1365/
s10337-010-1699-2.
[24] C. Sarazin, D. Thiébaut, P. Sassiat, J. Vial, Feasibility of ultra high performance
supercritical neat carbon dioxide chromatography at conventional pressures, J.
Sep. Sci. 34 (2011) 2773–2778, doi:10.1002/jssc.201100332.
[25] A. Grand-Guillaume Perrenoud, J.L. Veuthey, D. Guillarme, The use of columns
packed with sub-2 μm particles in supercritical fluid chromatography, TrAC
Trends Anal. Chem. 63 (2014) 44–54, doi:10.1016/j.trac.2014.06.023.
[26] C. West, E. Lemasson, S. Bertin, P. Hennig, E. Lesellier, An improved classification of stationary phases for ultra-high performance supercritical fluid chromatography, J. Chromatogr. A 1440 (2016) 212–228, doi:10.1016/j.chroma.2016.
02.052.
[27] J. Prothmann, M. Sun, P. Spégel, M. Sandahl, C. Turner, Ultra-high-performance
supercritical fluid chromatography with quadrupole-time-of-flight mass spectrometry (UHPSFC/QTOF-MS) for analysis of lignin-derived monomeric compounds in processed lignin samples, Anal. Bioanal. Chem. 409 (2017) 7049–
7061, doi:10.10 07/s0 0216- 017- 0663- 5.
[28] T.L. Chester, Chromatography from the mobile-phase perspective, Anal. Chem.
69 (1997) 165A–169A, doi:10.1021/ac971559t.
[29] D. Wolrab, M. Chocholoušková, R. Jirásko, O. Peterka, M. Holcˇ apek, Validation of lipidomic analysis of human plasma and serum by supercritical
fluid chromatography–mass spectrometry and hydrophilic interaction liquid
chromatography–mass spectrometry, Anal. Bioanal. Chem. 412 (2020) 2375–
2388, doi:10.10 07/s0 0216- 020- 02473- 3.
[30] D. Wolrab, M. Chocholoušková, R. Jirásko, O. Peterka, V. Mužáková, H. Študentová, B. Melichar, M. Holcˇ apek, Determination of one year stability of lipid
plasma profile and comparison of blood collection tubes using UHPSFC/MS and
HILIC-UHPLC/MS, Anal. Chim. Acta 1137 (2020) 74–84, doi:10.1016/j.aca.2020.
08.061.
[31] G.L. Losacco, E. Marconetto, R. Nicoli, T. Kuuranne, J. Boccard, S. Rudaz,
J.L. Veuthey, D. Guillarme, Supercritical fluid chromatography–mass spectrometry in routine anti-doping analyzes: estimation of retention time variability
under reproducible conditions, J. Chromatogr. A 460780 (2020) 1616, doi:10.
1016/j.chroma.2019.460780.
[32] D. Wolrab, P. Frühauf, C. Gerner, Direct coupling of supercritical fluid chromatography with tandem mass spectrometry for the analysis of amino acids
and related compounds: comparing electrospray ionization and atmospheric
pressure chemical ionization, Anal. Chim. Acta 981 (2017) 106–115, doi:10.
1016/j.aca.2017.05.005.
[33] C. West, Current trends in supercritical fluid chromatography, Anal. Bioanal.
Chem. 410 (2018) 6441–6457, doi:10.10 07/s0 0216- 018- 1267- 4.
[34] T. Pluskal, S. Castillo, A. Villar-Briones, M. Orešicˇ , M. Zmine, 2: modular framework for processing, visualizing, and analyzing mass spectrometrybased molecular profile data, BMC Bioinform. 11 (2010), doi:10.1186/
1471-2105-11-395.
[35] X. han Liu, X. yue Zhai, Role of tryptophan metabolism in cancers and therapeutic implications, Biochimie 182 (2021) 131–139, doi:10.1016/j.biochi.2021.
01.005.
[36] Z. Galla, C. Rajda, G. Rácz, N. Grecsó, Á. Baráth, L. Vécsei, C. Bereczki, P. Monostori, Simultaneous determination of 30 neurologically and metabolically important molecules: a sensitive and selective way to measure tyrosine and
tryptophan pathway metabolites and other biomarkers in human serum and
cerebrospinal fluid, J. Chromatogr. A 1635 (2021) 461775, doi:10.1016/j.chroma.
2020.461775.
[37] P.B. Ancey, C. Contat, E. Meylan, Glucose transporters in cancer – from tumor
cells to the tumor microenvironment, FEBS J. 285 (2018) 2926–2943, doi:10.
1111/febs.14577.
[38] W.Y. Hsu, W.T.L. Chen, W. De Lin, F.J. Tsai, Y. Tsai, C.T. Lin, W.Y. Lo, L. Bin Jeng,
C.C. Lai, Analysis of urinary nucleosides as potential tumor markers in human
colorectal cancer by high performance liquid chromatography/electrospray ionization tandem mass spectrometry, Clin. Chim. Acta 402 (2009) 31–37, doi:10.
1016/j.cca.20 08.12.0 09.
[39] D. Wolrab, R. Jirásko, E. Cífková, M. Hưring, D. Mei, M. Chocholoušková,
O. Peterka, J. Idkowiak, T. Hrncˇ iarová, L. Kucharˇ, R. Ahrends, R. Brumarová,
D. Friedecký, G. Vivo-Truyols, P. Škrha, J. Škrha, R. Kucˇ era, B. Melichar,
G. Liebisch, R. Burkhardt, M.R. Wenk, A. Cazenave-Gassiot, P. Karásek,
I. Novotný, K. Greplová, R. Hrstka, M. Holcˇ apek, Lipidomic profiling of human serum enables detection of pancreatic cancer, Nat. Com. 13 (2021) 124,
doi:10.1038/s41467- 021- 27765- 9.
[40] G. Bin Lee, J.C. Lee, M.H. Moon, Plasma lipid profile comparison of five different cancers by nanoflow ultrahigh performance liquid chromatography-tandem
mass spectrometry, Anal. Chim. Acta 1063 (2019) 117–126, doi:10.1016/j.aca.
2019.02.021.
[41] R.
Wawrzyniak,
A.
Kosnowska,
S.
Macioszek,
R.
Bartoszewski,
M.J. Markuszewski, New plasma preparation approach to enrich metabolome
coverage in untargeted metabolomics: plasma protein bound hydrophobic metabolite release with proteinase K, Sci. Rep. 8 (2018) 1–10,
doi:10.1038/s41598- 018- 27983- 0.
12