Noninvasive method for determination of immobilized protein A
Bạn đang xem bản rút gọn của tài liệu. Xem và tải ngay bản đầy đủ của tài liệu tại đây (1.13 MB, 7 trang )
Journal of Chromatography A 1671 (2022) 462976
Contents lists available at ScienceDirect
Journal of Chromatography A
journal homepage: www.elsevier.com/locate/chroma
Short communication
Noninvasive method for determination of immobilized protein A
Rok Mravljak a, Metka Stanticˇ a, Ožbej Bizjak a, Aleš Podgornik a,b,∗
a
Department of Chemical Engineering and Technical Safety, Faculty of Chemistry and Chemical Technology, University of Ljubljana, Ljubljana SI-1000,
Slovenia
b
COBIK, Mirce 21, 5270 Ajdovšˇcina, Slovenia
a r t i c l e
i n f o
Article history:
Received 8 December 2021
Revised 12 March 2022
Accepted 14 March 2022
Available online 15 March 2022
Keywords:
Direct noninvasive immobilized protein
quantification
Protein A
pH transition method
polyHIPE
CNBr-Sepharose
a b s t r a c t
The pH transition method, developed for the determination of the ion-exchange group density on chromatographic stationary phase, was used for the quantification of immobilized protein A. Monolithic epoxy
polyHIPE and particulate CNBr-Sepharose supports were used for immobilization. A lactate buffer was selected, having a buffer capacity peak approximately 0.5 pH units below the maximum buffer capacity of
protein A. The pH transition measurements were performed at pH 4.3, where protein A exhibits maximum buffer capacity, with a lactate buffer concentration of 1 mM for protein A immobilized on polyHIPE
monoliths and of 5 mM for protein A immobilized on CNBr-Sepharose. The pH transition height and full
width at half maximum for the particulate support and the height for the polyHIPE matrix, showed a linear correlation with the amount of immobilized protein A determined from the absorbance difference before and after immobilization for both supports. The developed method allows a simple, non-invasive online determination of immobilized protein A using biological buffers, even for chromatographic columns
with an amount of immobilized protein A as low as 0.25 mg. In addition, its sensitivity and duration can
be easily adjusted by varying the buffer concentration and pH.
© 2022 The Authors. Published by Elsevier B.V.
This is an open access article under the CC BY-NC-ND license
( />
1. Introduction
Protein immobilization is important in many different fields
where specific detection of different molecules or their conversion
is required [1]. Therefore, they are used either as enzyme bioreactors for conversion of substrates or as ligands for target molecule
adsorption [2,3]. A plethora of different protein affinity ligands are
immobilized on small volume devices such as enzyme-linked immunosorbent assays (ELISA) [4], microfluidic devices [5], and sensors [6], while their high cost dictates that very few are implemented on large-scale processes, among which protein A significantly outperforms all others [7]. Various protein A molecules [8–
11] are routinely used for chromatographic purification of monoclonal antibodies on different types of chromatographic supports
[9,12–18], thus optimization of the immobilization procedure leading to a maximum ligand utilization is of utmost importance [19–
21]. In addition, non-invasive characterization of chromatographic
protein A affinity columns is preferred because they are frequently
used in a good manufacturing practice (GMP) environment [22].
∗
Corresponding author at: Faculty for Chemistry and Chemical Technology, University of Ljubljana, Vecˇ na pot 113, 10 0 0 Ljubljana, Slovenia.
E-mail address: (A. Podgornik).
The methods used for quantification of immobilized proteins
are destructive or non-destructive and measure the immobilized
protein directly or indirectly. Elemental analysis [5], protein hydrolysis in acid at elevated temperature [23], and time-of-flight
secondary ion mass spectrometry [24] are examples of direct destructive methods and are therefore limited to a particulate type
of stationary phase. On the other hand, direct non-destructive
methods such as dye binding [25], inhibitor radiolabeling [26],
and concentration determination using a bio-assisted potentiometric multisensory system [27] are difficult to implement on largescale or may contaminate the matrix [28]. To avoid these limitations, indirect methods are often used to determine the remaining non-immobilized protein, such as the Biuret [29], Lowry
[30,31], Bradford (CBB) [32], and Smith (BCA) [33] methods or UVVis absorbance at 280 nm. However, these methods might in some
cases provide too high estimated value of immobilized protein,
when part of immobilizing protein is non-specifically adsorbed
and might elute with change of mobile phase. Furthermore, they
might also be biased by agglomeration of immobilizing protein.
The amount of immobilized protein can be directly assessed by
determining its biological activity, which, however, is not necessarily directly proportional to the quantity of immobilized protein
because it exhibits a non-linear dependence at high ligand den-
/>0021-9673/© 2022 The Authors. Published by Elsevier B.V. This is an open access article under the CC BY-NC-ND license ( />
R. Mravljak, M. Stanticˇ , O. Bizjak et al.
Journal of Chromatography A 1671 (2022) 462976
sity [34] and also depends on the immobilization procedure, which
affects ligand utilization [35]. For this reason, direct, noninvasive
methods to determine the amount of immobilized protein A would
be beneficial.
Recently, a pH-based method originally developed for the quantification of ion-exchange groups on a matrix has been extended
to other groups with ionizable moieties [36]. The method is based
on the pH transition formed due to the buffering capacity of the
ionizable functionalities present on the matrix when the mobile
phases with the same pH but different ion concentrations are exchanged stepwise [36–40]. In this work, we investigated whether
this method can be used for the quantification of immobilized protein A by exploiting its ionizable character. Using lactate buffer at
pH 4.3, it was possible to determine the amount of immobilized
protein A, even on small volume columns comprised of a particulate or monolithic matrix.
2.3. Protein A immobilization on CNBr-Sepharose particles
Protein A was immobilized on CNBr–activated SepharoseTM 4
Fast Flow particles according to the manufacturer’s instructions
[43]. Initially, 250 mg of particles were weighed into each of three
15 ml centrifugation tubes. All buffers and solutions were filtered
and conditioned to 4°C before use. The particles were washed
three times with 5 ml of cold 1 mM HCl and centrifugation at 1500
G for 3 min (Tehtnica Centric 350, Železniki, Slovenia) was used to
settle the particles in between washes. Subsequently, the particles
were washed with the immobilization buffer (0.1 M Na2 CO3 /HCl,
0.5 M NaCl, pH 7.4) using the same procedure. After buffer removal, 0, 1, and 5 ml of protein A solution with a concentration
of 5 mg/ml were added to the centrifugation tubes, followed by 5,
4, and 0 ml of the immobilization buffer, respectively, and mixed
carefully with a pipette. Initial absorbance was measured at 280
nm, as a higher concentration of protein A was used compared
to polyHIPE immobilization. Immobilization was continued until a
constant absorbance at 280 nm was reached. The difference was
used to calculate the amount of immobilized protein A, again considering the initial dilution due to the buffer present in the particle
pores. The particles were then washed again three times with the
immobilization buffer, centrifuged each time in-between. To block
the remaining CNBr groups, 5 ml of 0.1 M Tris/HCl at pH 8 was
added under gentle mixing and allowed to stand at room temperature for 2 hours. The particles were then washed alternately three
times with an acidic (0.1 M acetate/HCl, 0.5 M NaCl at pH 4) and
a basic (0.1 M Tris/HCl, 0.5 M NaCl at pH 8) buffer and stored at
4°C in storage buffer (20 mM phosphate/HCl, pH 7.4) before use.
For the pH transition experiments, the particles were packed into
glass columns using a storage buffer. Packing uniformity was verified with a pulse response experiment using 0.5 vol.% acetone as
a tracer and a 30 μl loop using HPLC system (ÄKTAExplorer, GE
Healthcare, Uppsala, Sweden) at a flow rate of 3 ml/min.
2. Materials and methods
2.1. Chemicals
Acetic acid, lactic acid, tris(hydroxymethyl)aminomethane (Tris)
were purchased from Sigma-Aldrich (St. Louis, USA). Sodium hydrogen phosphate (Na2 HPO4 ), sodium carbonate (Na2 CO3 ), CNBrSepharoseTM 4 Fast Flow (GE17-0981-01), glass columns TricornTM
5/100 (GE28-4064-10) and IgG from bovine serum were purchased from Merck KGaA (Darmstadt, Germany). Hydrochloric acid
(HCl) and sodium chloride (NaCl) were purchased from Honeywell Fluka (Seelze, Germany). Lyophilized recombinant protein A
(10600-P07E) was purchased from Sino Biological Inc. (Eschborn,
Germany). Deionized (Mili-Q quality) water was used for all experiments.
2.2. Protein A immobilization on polyHIPE
2.4. The pH transition measurements
PolyHIPE monoliths with a matrix volume of approximately
0.5 ml were prepared and tested as previously described [41,42].
Protein A was dissolved in the immobilization buffer (0.1 M
Na2 CO3 /HCl, 0.5 M NaCl, pH 7.4, filtered, 4°C) to a final concentration of 3.46 mg/ml. Each polyHIPE sample was placed in the
housing [42] and washed with 10 ml of deionized H2 O and 10 ml
of immobilization buffer. The sample was then removed from the
housing, which was washed and dried to remove residual buffer
from the surface, leaving only buffer defined with the pore volume in the sample. By mixing 86, 132, 234, and 439 μl of protein A solution with the immobilization buffer to a final volume
of 1 ml, four different concentrations were prepared. Absorbance
at 230 nm (Tecan infinite M200pro, Switzerland) was measured
to achieve high sensitivity. Each protein A solution was pumped
through a single polyHIPE sample for 3 hours, to obtain four
samples with different amounts of immobilized protein A. Again,
absorbance was measured at 230 nm. After immobilization was
completed, the polyHIPE samples were washed extensively with a
buffer to remove unbound protein A from pores and then with 5
ml of deionized water to desorb any non-covalently bound protein A. No change in absorbance was observed for the deionized
water used for washing, indicating that no protein was desorbed
from the matrix after immobilization. Therefore, the difference in
absorbance before and after immobilization is representative to
calculate the amount of immobilized protein A, considering initial dilution caused by the buffer present in the matrix pores. Finally, samples were washed with 20 mM phosphate/HCl, pH 7.4,
deionized water to remove residual non-immobilized protein A and
stored in the same phosphate buffer at 4°C.
Since the maximum buffer capacity determined from the calculated titration curve of protein A corresponds to pH 4.3, this
pH was chosen as the initial buffer pH because the highest sensitivity of the pH transition is expected. Both acetate and lactate
buffer having pKa values of 4.75 and 3.86 [44] have very similar buffer capacity at pH 4.3, therefore it was investigated which
buffer provides more pronounced pH transition. For this purpose,
the polyHIPE sample was measured with buffer A, being either 1
mM acetate buffer, pH 4.3 or 1 mM lactate buffer, pH 4.3, and corresponding buffer B containing in addition 1M NaCl. Two CNBrSepharose samples were measured with 1 and 5 mM lactate buffer,
pH 4.3 and the corresponding buffer B containing additionally 1M
NaCl. PolyHIPE samples containing different amounts of immobilized protein A were assayed with 1 mM lactate buffer, while 5
mM lactate buffer and corresponding buffer B containing in addition 1M NaCl, both pH 4.3, were used for the CNBr-Sepharose with
different amount of immobilized protein A. Buffers were filtered
through a 0.22 μm membrane filter and degassed before use. All
pH transition experiments were performed on an HPLC ÄKTA system at a flow rate of 3 ml/min as described elsewhere [36]. After
each stepwise change of two buffers, pH equilibrium was reached.
2.5. Static binding capacity (SBC) for protein A-Sepharose
Protein A-Sepharose samples were first washed three times
with the binding buffer (20 mM Tris/HCl at pH 7.4) and always
centrifuged in-between. 10 ml of a 2 mg/ml IgG solution was
added to 0.67 ml of the particles and absorbance at 280 nm was
periodically measured. The experiment was allowed to proceed for
2
R. Mravljak, M. Stanticˇ , O. Bizjak et al.
Journal of Chromatography A 1671 (2022) 462976
1 day at 4°C under gentle mixing. The amount of adsorbed IgG
was calculated from the difference between the initial and final absorbance, taking into consideration the initial dilution by the buffer
present in the particle pores.
2.6. Elemental analysis
Elemental analysis was performed using a CHNS analyzer (2400
CHNS/O Series II, Perkin Elmer, USA) to determine the nitrogen
content in the polyHIPE samples.
3. Results and discussion
It has already been shown that the pH transition method can
accurately measure the amount of ionizable groups on particulate
or monolithic supports [36–40]. The method is based on the pH
change when the matrix of interest undergoes a stepwise change
in the buffer composition from high to low ionic strength and vice
versa. The pH transition represents an intermediate state resulting
from the difference in the velocity of retained and non-retained
ions as a consequence of the established ion exchange equilibria
between ions in solution and on the matrix surface, depending
on the dissociation equilibria of the ionizable groups [39,45]. The
magnitude of the pH change is influenced by the composition and
pH of the mobile phase and by the type and amount of ionizable
groups on the polymer surface. Therefore, the duration and shape
of the pH transition can be correlated with the quantity of ionizable groups on the matrix. Since the method uses biocompatible buffers, it is less invasive compared to a conventional titration,
where strong acids and bases are commonly implemented.
To investigate whether immobilized protein A can be detected
by the pH transition method, monolithic porous polyHIPE polymers with epoxy groups were used [41], so that no further matrix preactivation was required [46]. Immobilization of protein A
was performed as described in the Materials and methods section,
by measuring the absorbance of protein A solution before and after immobilization. In addition to the polyHIPE samples containing
protein A, a reference polyHIPE sample was also prepared, using
the same immobilization protocol but without protein A in the immobilization buffer. From the difference in absorbance, it was estimated that 0.25, 0.42, 0.72, and 0.98 mg of protein A was immobilized on the polyHIPE matrix, resulting in immobilized protein
A concentrations of 0.48, 0.8, 1.35, and 1.98 mg/ml, respectively.
No change in absorbance was observed for the polyHIPE reference
sample. Low concentrations of immobilized protein A were determined, which can be attributed to the low specific surface area
of polyHIPEs [42] which limiting the maximum quantity of immobilized protein. As samples are therefore were perfectly suited to
study the sensitivity of the pH transition method.
Since the amount of immobilized protein A was determined indirectly by absorbance measurements, we investigated whether direct elemental analysis could be used as well. Because the method
is destructive, the nitrogen content of all polyHIPE samples was
measured only after all other experiments, including pH transition
measurements, were completed. Unfortunately, no significant difference was found between the samples (including the reference
sample). This result indicates that the amount of immobilized protein A was too low to be accurately determined. In fact, even for
the highest protein A concentration of 1.98 mg/ml, assuming its
chemical composition of C1222 H1920 N356 O417 S2 [47], nitrogen accounts for less than 0.17% of the sample mass, which is below the
limit of quantification of the instrument [48].
Obviously, to estimate such low amounts of immobilized protein A, a very high sensitivity of the pH transition method is required. The sensitivity of the method depends on the type of buffer
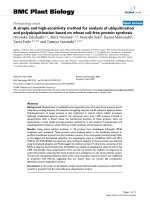
Fig. 1. Calculated protein A charge from the amino acid sequence using ProtParam
software (Expasy) and the buffer capacity.
used, its concentration and pH. It can be expected that the maximum effect of the immobilized ionizable groups on the pH transition is at the pH at which they exhibit the maximum buffering capacity, namely at their pKa. The buffer capacity of Protein A shown
in Fig. 1 was estimated from the theoretical titration curve generated using ProtParam software (Expasy) based on the amino acid
sequence of protein A. The buffer capacity of protein A was calculated as the negative difference in the protein charge divided by
the change in pH (d[z]/dpH) [49].
Three pKa values can be seen from Fig. 1 at pH 4.3, 9.8, and
12.4, where the charge of protein A is +11.9, -27.9, and -44.7, respectively. To maintain the biological stability of protein A, only the
lowest pKa value at pH 4.3 is suitable and was therefore chosen
for the pH transition buffers. Two biologically compatible buffers,
namely acetate (pKa 4.76) and lactate buffer (pKa 3.86) [44], seem
to be suitable since they have pKa values close to pH 4.3. As both
are formed from monovalent acids, their buffering capacity at pH
4.3 is already much lower than at their maximum, possibly allowing the detection of the pH transition caused by the immobilized
protein A. On the other hand, even at rather low buffer concentration, the buffer capacity is still sufficient to provide robustness to
the measurements.
Both buffers were tested varying their concentration. Despite
possible shift in maximum buffer capacity of protein A due to immobilization [50], pH of both buffers was adjusted to 4.3 to investigate if sensitivity of pH transition method is sufficient to detect
presence of immobilized protein A. Indeed, both buffers showed
differences in the pH transition profiles between polyHIPE sample with immobilized protein A and the reference polyHIPE, which
were however more pronounced for the lactate buffer (Fig. S1). A
1 mM lactate buffer, pH 4.3 was therefore used for further experiments. Stepwise change using this buffer was performed on all
prepared polyHIPE samples to obtain the pH transition responses
shown in Fig. 2.
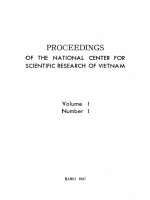
Figs. 2a and 2b show the pH transition for the stepwise buffer
change. All pH profiles exhibited a chromatographic peak shape,
with its maximum correlating with the amount of immobilized
protein A. Peaks were analyzed as described in literature [36] by
measuring the full width at half maximum (FWHM) and the height
of the peaks ( pH). Due to a chromatographic peak shape, better linear correlation [36] was obtained between the pH transition
peak height ( pH) and the amount of immobilized protein A plotted in Fig. 2c and 2d.
Since promising results were obtained with polyHIPE samples,
the general applicability of the pH transition method for protein
A was further studied on particulate CNBr-Sepharose. In addition
of the higher expected amount of immobilized protein A, due to
3
R. Mravljak, M. Stanticˇ , O. Bizjak et al.
Journal of Chromatography A 1671 (2022) 462976
Fig. 2. pH transition profiles for polyHIPE samples containing 0 (ref), 0.25, 0.42, 0.72, and 0.98 mg immobilized protein A. Buffer A: 1 mM lactate buffer, pH 4.3; buffer B:
1 mM lactate buffer containing 1 M NaCl, pH 4.3; flow rate 3 ml/min. The pH response for the stepwise change from buffer B to buffer A (a) and buffer A to buffer B (b).
Correlation between the pH transition peak height ( pH) and the amount of immobilized protein A for both stepwise changes: buffer B to buffer A (c) and buffer A to buffer
B (d).
Fig. 3. The pH transition response for two columns filled with a particulate Sepharose matrix containing 3.5 and 4.4 mg of protein A, respectively. Matrix volume: 0.67 ml;
protein A concentration: 5.3 and 6.6 mg/ml. pH transition profiles were measured at flow rate of 3 ml/min with lactate buffer, pH 4.3, during a stepwise change: from buffer
containing 1 M NaCl to buffer without NaCl (a) and opposite (b). Lactate buffer concentration is shown in graph.
a higher specific surface area [43], the particulate matrix also allows for higher flexibility in column preparation obtained by mixing particles with different protein A content and varying the matrix volume.
Initially CNBr-Sepharose was divided into three parts, two of
which were immersed in buffer solutions with different protein A
concentrations, while one part was immersed in the same buffer
solution but without protein A to be used as a reference. Again,
the absorbance of the solution was measured before and after immobilization and the difference was used to calculate the amount
of immobilized protein A (Fig. S2), which was estimated to be 5.3
and 6.6 mg/ml, respectively. All three matrices were packed into
the column (0.67 ml) and the pH transitions were measured during
the stepwise change using the same buffer as for polyHIPE samples
(Fig. 3).
Compared to the polyHIPE samples, much longer pH transitions
were observed, exceeding 40 ml. A longer pH transition was ex-
pected due to the higher amount of protein A, but a high pH transition volume is rather impractical to perform routine measurements. Since the duration of the pH transition can be tailored by a
buffer concentration [36–40], the lactate buffer concentration was
increased to 5 mM. With this buffer, all pH transitions were completed within 10 ml and although the magnitude of pH excursions
decreased, it was still sufficient to accurately detect differences in
the amount of immobilized protein A (Fig. 3).
After the pH transition measurements were completed, matrix
containing 5.3 and 6.6 mg/ml of protein A was removed from the
columns and mixed to obtain approximately 1.3 ml of matrix containing an average of 5.95 mg/ml of protein A. The column was
packed with 1.2 ml of this matrix (6.9 mg of protein A), the pH
transition was measured, after that the matrix volume was decreased to 0.97 ml (5.7 mg of protein A) and the pH transition was
measured again. The matrix was removed from the column and
mixed with a reference matrix in volume ratios of 0.22/0.77 and
4
R. Mravljak, M. Stanticˇ , O. Bizjak et al.
Journal of Chromatography A 1671 (2022) 462976
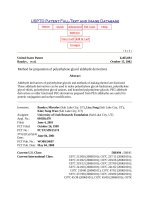
Fig. 4. pH transition profiles for a particulate Sepharose matrix bearing 0 (ref), 1.25, 2.5, 3.5, 4.4, 5.7 and 6.9 mg immobilized protein A. Buffer A: 5 mM lactate buffer, pH
4.3; buffer B: 5 mM lactate buffer containing 1 M NaCl, pH 4.3; flow rate: 3 ml/min; pH transition peak height ( pH) for the stepwise buffer change from buffer B to buffer
A (c) and FWHM for the stepwise buffer change from buffer A to buffer B (d), both correlated to the amount of immobilized protein A.
0.38/0.62. One column was filled with 0.92 ml of the first mixture,
containing 1.25 mg of protein A, while the other column was filled
with 1.1 ml of the second mixture, containing 2.5 mg of protein
A. pH transitions of both columns were measured. This approach
allowed us to study pH profiles of different amounts of protein A
with a very low protein A matrix volume and to precisely determine the amount of immobilized protein A in each column with
respect to the concentration of the original protein A matrix. All
pH transition profiles are shown in Fig. 4 (4a and 4b).
When the values obtained from the pH transition profiles were
plotted against the amount of immobilized protein A, a good linear
correlation was obtained (Fig. 4c, d) as previously shown also for
polyHIPE samples. The only difference was that due to a higher
amount of immobilized protein A, resulting in the flat-top pH
transition peaks during stepwise change from low to high ionic
strength buffer (Fig. 4b), FWHM provided better correlation, as discussed elsewhere [36]. Because of higher density of immobilized
protein A, we were also interested to investigate if the amount of
immobilized protein A could also be linearly correlated with the
static binding capacity (SBC) towards IgG in this range, since a
non-linear trend has been found at high ligand density [34]. SBC
measurements of matrix bearing 5.3 and 6.6 mg/ml protein A resulted in IgG SBC of 21.8 and 25.0 mg/ml, respectively. The amount
of adsorbed IgG enabled calculation of ligand utilization, which
was 1.22 and 1.09, respectively. It can be seen that a ligand utilization above 1 was achieved in both cases, which is in agreement
with recent studies [17,18]. More importantly, ligand utilization decreased for higher ligand density, a trend previously reported for
the dynamic binding capacity of protein A immobilized on monoliths [34]. This confirms that SBC cannot be used directly to determine the amount of immobilized protein A when the matrix surface is nearly saturated. The reason for lower ligand utilization at
higher ligand density are probably steric hindrances [34] due to
the large size of IgG compared to a protein A molecule. On the
other hand, the pH transition method is based on the exchange of
ions between the immobilized ligand and the mobile phase, which
are very small compared to the size of the protein A ligand. Therefore, no hindrances are expected, leading to a linear trend between
the pH transition measurements and the amount of immobilized
protein A, even at the highest protein A ligand density (Fig. 4c, d).
As mentioned earlier, changing the buffer concentration affects
the sensitivity of the method (Fig. 3). Therefore, it can be easily applied to small as well as large chromatographic protein A columns
by adjusting the buffer concentration accordingly. While the duration of the pH transition is linearly correlated with the reciprocal
buffer concentration [38], even larger differences in sensitivity can
be obtained by changing the pH value [38], since the buffer capacity is highly non-linearly dependent on pH. This allows the extension of this method to chromatographic columns of preparative
scale. For this reason, the proposed method can be used to evaluate the immobilization process of protein A, but it can also serve as
an in-line method for non-invasive monitoring of changes in protein A column performance on analytical or industrial scale. On the
other hand, it can also be implemented to evaluate immobilization
efficiency on microfluidic devices, as it has an even higher sensitivity than potentiometric measurement [27], allowing determination
of ligand densities even below 0.5 mg/ml. Although the proposed
method was tested only on a protein A ligand, due to its flexibility,
it can be extended to other immobilized molecules like different
proteins, but also to DNA or even nanoparticles bearing ionizable
moieties, simply by proper selection of buffer type, concentration
and pH value.
4. Conclusion
A pH transition method based on lactate buffer was developed
and implemented to determine the amount of immobilized protein A directly and noninvasively. The method is based on a biocompatible buffer typically used in chromatography, therefore its
implementation is straightforward and does not require additional
equipment. Due to its simplicity, it could represent a novel tool for
direct, non-invasive determination of the amount of immobilized
protein A at laboratory and industrial scale, allowing optimization
of ligand utilization during immobilization, but also serving for inprocess monitoring of the protein A stationary phase, even in GMP
environment.
5
R. Mravljak, M. Stanticˇ , O. Bizjak et al.
Journal of Chromatography A 1671 (2022) 462976
Author Contributions
[16] T.M. Pabst, J. Thai, A.K. Hunter, Evaluation of recent Protein A stationary phase
innovations for capture of biotherapeutics, J. Chromatogr. A. 1554 (2018) 45–
60, doi:10.1016/j.chroma.2018.03.060.
[17] J. Plewka, G.L. Silva, R. Tscheließnig, H. Rennhofer, C. Dias-Cabral, A. Jungbauer,
H.C. Lichtenegger, Antibody adsorption in protein-A affinity chromatography in situ measurement of nanoscale structure by small-angle X-ray scattering, J.
Sep. Sci. 41 (2018) 4122–4132, doi:10.10 02/jssc.20180 0776.
[18] G.L. Silva, J. Plewka, H. Lichtenegger, A.C. Dias-Cabral, A. Jungbauer, R. Tscheließnig, The pearl necklace model in protein A chromatography: Molecular mechanisms at the resin interface, Biotechnol. Bioeng. 116 (2019) 76–86,
doi:10.1002/bit.26843.
[19] A.A. Shukla, B. Hubbard, T. Tressel, S. Guhan, D. Low, Downstream processing
of monoclonal antibodies—application of platform approaches, J. Chromatogr.
B. 848 (2007) 28–39, doi:10.1016/j.jchromb.2006.09.026.
[20] E. Müller, J. Vajda, Routes to improve binding capacities of affinity resins
demonstrated for Protein A chromatography, J. Chromatogr. B. 1021 (2016)
159–168, doi:10.1016/j.jchromb.2016.01.036.
[21] X.-H. Yang, L.-M. Huan, X.-S. Chu, Y. Sun, Q.-H. Shi, A comparative investigation
of random and oriented immobilization of protein A ligands on the binding of
immunoglobulin G, Biochem. Eng. J. 139 (2018) 15–24, doi:10.1016/j.bej.2018.
08.002.
[22] J.W. Beattie, R.C. Rowland-Jones, M. Farys, R. Tran, S.G. Kazarian, B. Byrne, Insight into purification of monoclonal antibodies in industrial columns via studies of Protein A binding capacity by in situ ATR-FTIR spectroscopy, Analyst 146
(2021) 5177–5185, doi:10.1039/D1AN00985K.
[23] B.J. Smith, Chemical Cleavage of Proteins, in: New Protein Tech, Humana Press,
New Jersey, 1989, pp. 71–88, doi:10.1385/0- 89603- 126- 8:71.
[24] Y.-P. Kim, M.-Y. Hong, J. Kim, E. Oh, H.K. Shon, D.W. Moon, H.-S. Kim, T.G. Lee,
Quantitative analysis of surface-immobilized protein by TOF-SIMS: Effects of
protein orientation and trehalose additive, Anal. Chem. 79 (2007) 1377–1385,
doi:10.1021/ac0616005.
[25] M. Bonde, H. Pontoppidan, D.S. Pepper, Direct dye binding—A quantitative assay for solid-phase immobilized protein, Anal. Biochem. 200 (1992) 195–198,
doi:10.1016/0 0 03- 2697(92)90298- L.
[26] P. Singh, H. Morris, A.V Tivanski, A. Kohen, Determination of concentration and
activity of immobilized enzymes, Anal. Biochem. 484 (2015) 169–172, doi:10.
1016/j.ab.2015.02.014.
[27] E. Voitechovicˇ , A. Korepanov, D. Kirsanov, A. Legin, Quantification of immobilized protein in pharmaceutical production by bio-assisted potentiometric
multisensor system, J. Pharm. Biomed. Anal. 150 (2018) 67–71, doi:10.1016/j.
jpba.2017.11.076.
[28] D. Wu, R.R. Walters, Effects of stationary phase ligand density on highperformance ion-exchange chromatography of proteins, J. Chromatogr. A. 598
(1992) 7–13, doi:10.1016/0021-9673(92)85108-6.
[29] H.W. Robinson, C.G. Hogden, The biuret reaction in the determination of
serum proteins, J. Biol. Chem. 135 (1940) 707–725, doi:10.1016/S0021-9258(18)
73134-7.
[30] O. Lowry, N. Rosebrough, A.L. Farr, R. Randall, Protein measurement with
the Folin phenol reagent, J. Biol. Chem. 193 (1951) 265–275, doi:10.1016/
S0021- 9258(19)52451- 6.
[31] T. Basinska, S. Slomkowski, The direct determination of protein concentration
for proteins immobilized on polystyrene microspheres, J. Biomater. Sci. Polym.
Ed. 3 (1992) 115–125, doi:10.1163/156856291×00223.
[32] M.M. Bradford, A rapid and sensitive method for the quantitation of microgram quantities of protein utilizing the principle of protein-dye binding, Anal.
Biochem. 72 (1976) 248–254, doi:10.1016/0 0 03- 2697(76)90527- 3.
[33] P.K. Smith, R.I. Krohn, G.T. Hermanson, A.K. Mallia, F.H. Gartner, M.D. Provenzano, E.K. Fujimoto, N.M. Goeke, B.J. Olson, D.C. Klenk, Measurement of protein using bicinchoninic acid, Anal. Biochem. 150 (1985) 76–85, doi:10.1016/
0 0 03- 2697(85)90442- 7.
ˇ
[34] U. Cernigoj,
U. Vidic, B. Nemec, J. Gašperšicˇ , J. Vidicˇ , N. Lendero Krajnc,
A. Štrancar, A. Podgornik, Characterization of methacrylate chromatographic
monoliths bearing affinity ligands, J. Chromatogr. A. 1464 (2016) 72–78, doi:10.
1016/j.chroma.2016.08.014.
[35] A. Podgornik, T.B. Tennikova, Chromatographic Reactors Based on Biological Activity, Adv. Biochem. Eng. Biotechnol. (2002) 165–210, doi:10.1007/
3- 540- 45345- 8_5.
[36] R. Mravljak, O. Bizjak, P. Krajnc, M. Paljevac, A. Podgornik, Non-invasive determination of ionizable ligand group density on high internal phase emulsion
derived polymer, J. Chromatogr. A. 1652 (2021) 462077, doi:10.1016/j.chroma.
2021.462077.
[37] N. Lendero, J. Vidicˇ , P. Brne, A. Podgornik, A. Štrancar, Simple method for determining the amount of ion-exchange groups on chromatographic supports, J.
Chromatogr. A. 1065 (2005) 29–38, doi:10.1016/j.chroma.2004.10.072.
[38] N. Lendero, J. Vidicˇ , P. Brne, V. Frankovicˇ , A. Štrancar, A. Podgornik, Characterization of ion exchange stationary phases via pH transition profiles, J. Chromatogr. A. 1185 (2008) 59–70, doi:10.1016/j.chroma.2008.01.023.
[39] T.M. Pabst, G. Carta, pH transitions in cation exchange chromatographic
columns containing weak acid groups, J. Chromatogr. A. 1142 (2007) 19–31,
doi:10.1016/j.chroma.2006.08.066.
[40] T.E. Bankston, L. Dattolo, G. Carta, pH Transients in hydroxyapatite chromatography columns-Experimental evidence and phenomenological modeling,
J. Chromatogr. A. 1217 (2010) 2123–2131, doi:10.1016/j.chroma.2010.02.004.
[41] R. Mravljak, O. Bizjak, B. Božicˇ , M. Podlogar, A. Podgornik, Flow-through PolyHIPE silver-based catalytic reactor, Polymers (Basel) 13 (2021) 880, doi:10.
3390/polym13060880.
Rok Mravljak performed immobilization and static binding capacity measurements, partially pH transition experiments and analyzed data, contributed to the manuscript, Metka Stanticˇ also
performed immobilization experiments, Ožbej Bizjak performed
pH transition experiments, Aleš Podgornik defined the goal of
the work, contributing to experimental design, prepared the
manuscript draft and finalized the manuscript.
Declaration of competing interest
The authors declare that they have no known competing financial interests or personal relationships that could have appeared to
influence the work reported in this paper.
Acknowledgment
The financial support is gratefully acknowledged from the
Slovenian Research Agency (ARRS) through project J2-9440 and
program P1-0153. We want to thank Rok Ambrožicˇ for valuable
discussions.
Supplementary materials
Supplementary material associated with this article can be
found, in the online version, at doi:10.1016/j.chroma.2022.462976.
References
[1] J.C.S. dos Santos, O. Barbosa, C. Ortiz, A. Berenguer-Murcia, R.C. Rodrigues,
R. Fernandez-Lafuente, Importance of the Support Properties for Immobilization or Purification of Enzymes, ChemCatChem 7 (2015) 2413–2432, doi:10.
1002/cctc.201500310.
´ A. Podgornik, Appli[2] M. Stanticˇ , G. Guncˇ ar, D. Kuzman, R. Mravljak, T. Cvijic,
cation of lectin immobilized on polyHIPE monoliths for bioprocess monitoring
of glycosylated proteins, J. Chromatogr. B. 1174 (2021) 122731, doi:10.1016/j.
jchromb.2021.122731.
[3] G. Tripodo, G. Marrubini, M. Corti, G. Brusotti, C. Milanese, M. Sorrenti,
L. Catenacci, G. Massolini, E. Calleri, Acrylate-based poly-high internal phase
emulsions for effective enzyme immobilization and activity retention: from
computationally-assisted synthesis to pharmaceutical applications, Polym.
Chem. 9 (2018) 87–97, doi:10.1039/C7PY01626C.
[4] S.K. Vashist, E.Marion Schneider, E. Lam, S. Hrapovic, J.H.T. Luong, One-step antibody immobilization-based rapid and highly-sensitive sandwich ELISA procedure for potential in vitro diagnostics, Sci. Rep. 4 (2015) 4407, doi:10.1038/
srep04407.
[5] D. Kim, A.E. Herr, Protein immobilization techniques for microfluidic assays,
Biomicrofluidics 7 (2013) 041501, doi:10.1063/1.4816934.
[6] A. Ananth, M. Genua, N. Aissaoui, L. Díaz, N.B. Eisele, S. Frey, C. Dekker,
R.P. Richter, D. Görlich, Reversible immobilization of proteins in sensors and
solid-state nanopores, Small 14 (2018) 1703357, doi:10.1002/smll.201703357.
[7] K.M. Łacki,
˛
F.J. Riske, Affinity Chromatography: An Enabling Technology for
Large-Scale Bioprocessing, Biotechnol. J. 15 (2020) 1800397, doi:10.1002/biot.
201800397.
[8] J. Scheffel, S. Kanje, J. Borin, S. Hober, Optimization of a calcium-dependent
Protein A-derived domain for mild antibody purification, MAbs 11 (2019)
1492–1501, doi:10.1080/19420862.2019.1662690.
[9] V. Amritkar, S. Adat, V. Tejwani, A. Rathore, R. Bhambure, Engineering Staphylococcal Protein A for high-throughput affinity purification of monoclonal
antibodies, Biotechnol. Adv. 44 (2020) 107632, doi:10.1016/j.biotechadv.2020.
107632.
[10] Q. Shi, Y. Sun, Protein A-based ligands for affinity chromatography of antibodies, Chinese J. Chem. Eng. 30 (2021) 194–203, doi:10.1016/j.cjche.2020.12.001.
[11] J. Scheffel, S. Hober, Highly selective Protein A resin allows for mild sodium
chloride-mediated elution of antibodies, J. Chromatogr. A. 1637 (2021) 461843,
doi:10.1016/j.chroma.2020.461843.
[12] R. Hahn, Comparison of protein A affinity sorbents, J. Chromatogr. B. 790
(2003) 35–51, doi:10.1016/S0021- 9673(02)02003- 4.
[13] R. Hahn, P. Bauerhansl, K. Shimahara, C. Wizniewski, A. Tscheliessnig, A. Jungbauer, Comparison of protein A affinity sorbents, J. Chromatogr. A. 1093 (2005)
98–110, doi:10.1016/j.chroma.2005.07.050.
[14] R. Hahn, K. Shimahara, F. Steindl, A. Jungbauer, Comparison of protein A
affinity sorbents III. Life time study, J. Chromatogr. A. 1102 (2006) 224–231,
doi:10.1016/j.chroma.2005.10.083.
[15] S. Ghose, B. Hubbard, S.M. Cramer, Binding capacity differences for antibodies and Fc-fusion proteins on protein A chromatographic materials, Biotechnol.
Bioeng. 96 (2007) 768–779, doi:10.1002/bit.21044.
6
R. Mravljak, M. Stanticˇ , O. Bizjak et al.
Journal of Chromatography A 1671 (2022) 462976
[42] R. Mravljak, O. Bizjak, M. Podlogar, A. Podgornik, Effect of polyHIPE porosity
on its hydrodynamic properties, Polym. Test. 93 (2021) 106590, doi:10.1016/j.
polymertesting.2020.106590.
[43] Cytiva, CNBr-activated Sepharose 4B affinity media instructions for use table of
contents, (2020). />aspx?mediaformatid=10061&destinationid=10016&assetid=12981.
[44] R.J. Prankerd, Critical compilation of pKa values for pharmaceutical substances,
in: H.G. Brittain (Ed.), Profiles Drug Subst. Excip. Relat. Methodol., volume 33,
Academic Press, 2007: p. 726.
[45] F.G. Helfferich, B.J. Bennett, Weak electrolytes, polybasic acids, and buffers in
anion exchange columns I. Sodium acetate and sodium carbonate systems,
React. Polym. Ion Exch. Sorbents. 3 (1984) 51–66, doi:10.1016/0167-6989(84)
90122-3.
[46] P. Krajnc, N. Leber, D. Štefanec, S. Kontrec, A. Podgornik, Preparation and characterisation of poly(high internal phase emulsion) methacrylate monoliths and
their application as separation media, J. Chromatogr. A. 1065 (2005) 69–73,
doi:10.1016/j.chroma.2004.10.051.
[47] C. Lendel, J. Dogan, T. Härd, Structural Basis for Molecular Recognition in an
Affibody:Affibody Complex, J. Mol. Biol. 359 (2006) 1293–1304, doi:10.1016/j.
jmb.2006.04.043.
[48] PerkinElmer, 2400 Series II CHNS/O elemental analysis, perkin elmer.
(2011). />SeriesII_CHNSO_Elemental_Analysis.pdf.
[49] H. Yamano, K. Miyagawa, Buffer capacity curves of green tea extracts using a
personal computer with numerically treated online software, Food Sci. Technol.
Int. Tokyo. 3 (1997) 69–73, doi:10.3136/fsti9596t9798.3.69.
[50] F. Secundo, Conformational changes of enzymes upon immobilisation, Chem.
Soc. Rev. 42 (2013) 6250, doi:10.1039/c3cs35495d.
7