Sweeping-micellar electrokinetic chromatography with tandem mass spectrometry as an alternative methodology to determine neonicotinoid and boscalid residues in pollen and honeybee
Bạn đang xem bản rút gọn của tài liệu. Xem và tải ngay bản đầy đủ của tài liệu tại đây (1.01 MB, 10 trang )
Journal of Chromatography A 1672 (2022) 463023
Contents lists available at ScienceDirect
Journal of Chromatography A
journal homepage: www.elsevier.com/locate/chroma
Sweeping-micellar electrokinetic chromatography with tandem mass
spectrometry as an alternative methodology to determine
neonicotinoid and boscalid residues in pollen and honeybee samples
Laura Carbonell-Rozas a, Burkhard Horstkotte b, Ana M. García-Campa a,
Francisco J. Lara a,∗
a
b
Department of Analytical Chemistry, Faculty of Sciences, University of Granada, Avda. Fuente Nueva s/n, 18071, Granada, Spain
Department of Analytical Chemistry, Faculty of Pharmacy, Charles University, Akademika Heyrovského 1203, CZ-50005 Hradec Králové, Czech Republic
a r t i c l e
i n f o
Article history:
Received 4 February 2022
Revised 31 March 2022
Accepted 3 April 2022
Available online 6 April 2022
Keywords:
Micellar electrokinetic chromatography
Mass spectrometry
Sweeping
Neonicotinoids
Pollen
Honeybees
a b s t r a c t
In this work, it is proposed for the first time an electrophoretic approach based on micellar electrokinetic
chromatography coupled with tandem mass spectrometry (MEKC-MS/MS) for the simultaneous determination of nine neonicotinoids (NNIs) together with the fungicide boscalid in pollen and honeybee samples. The separation was performed using ammonium perfluorooctanoate (50 mM, pH 9) as both volatile
surfactant and electrophoretic buffer compatible with MS detection. A stacking strategy for accomplishing the on-line pre-concentration of the target compounds, known as sweeping, was carried out in order
to improve separation efficiency and sensitivity. Furthermore, a scaled-down QuEChERS was developed
as sample treatment, involving a lower organic solvent consumption and using Z-Sep+ as dispersive sorbent in the clean-up step. Regarding the detection mode, a triple quadrupole mass spectrometer was
operating in positive ion electrospray mode (ESI+ ) under multiple reaction monitoring (MRM). The main
parameters affecting MS/MS detection as well as the composition of the sheath-liquid (ethanol/ultrapure
water/formic acid, 50:49.5:0.5 v/v/v) and other electrospray variables were optimized in order to achieve
satisfactory sensitivity and repeatability. Procedural calibration curves were established in pollen and
honeybee samples with LOQs below 11.6 μg kg−1 and 12.5 μg kg−1 , respectively. Precision, expressed
as RSD, lower than 15.2% and recoveries higher than 70% were obtained in both samples. Two positive
samples of pollen were found, containing imidacloprid and thiamethoxam. Imidacloprid was also found
in a sample of honeybees. The obtained results highlight the applicability of the proposed method, being
an environmentally friendly, efficient, sensitive and useful alternative for the determination of NNIs and
boscalid in pollen and honeybee samples.
© 2022 The Author(s). Published by Elsevier B.V.
This is an open access article under the CC BY license ( />
1. Introduction
In the last years, several studies have demonstrated the potential toxic effects of pesticides, especially of systemic insecticides such as neonicotinoids (NNIs), on pollinators and their close
relation with the colony collapse disorder (CCD) in honeybees
[1–4]. CCD is a phenomenon characterized by the abrupt loss and
death of adult worker bees due to, among other factors, their
contamination with insecticides. NNIs are broad-spectrum insecticides that act as antagonists of the nicotinic acetylcholine recep-
∗
Corresponding author at: Dr. Francisco J. Lara, University of Granada, Department of Analytical Chemistry, Faculty of Sciences, Avda. Fuente Nueva s/n, 18071
Granada, Spain.
E-mail address: (F.J. Lara).
tors mainly present in insects, provoking the paralysis and subsequent death of the organism [5,6]. Currently, NNIs are the most
widely used family of insecticides worldwide for plant protection
replacing traditional insecticides and representing the 27% of the
global insecticide market [6]. The most predominant NNIs, which
can be seen in Fig. S1, are imidacloprid, thiacloprid, clothianidin,
thiamethoxam, acetamiprid, nitenpyram, dinotefuran, and flonicamid, while others, such as imidaclothiz, are relatively new [7].
Due to their high solubility in water, systemic nature and persistence, neonicotinoid residues can remain in plant pollen and nectar for a long time, being easily available for pollinators. Moreover,
as a result of their long-lasting persistence and the variability in
their application modes in agriculture, it is common to find them
in all environmental compartments (i.e., air, soil, surface water),
entailing a risk for beneficial insects and even other non-target
/>0021-9673/© 2022 The Author(s). Published by Elsevier B.V. This is an open access article under the CC BY license ( />
L. Carbonell-Rozas, B. Horstkotte, A.M. García-Campa et al.
Journal of Chromatography A 1672 (2022) 463023
organisms [8–10]. In 2013, the European Commission restricted
the use of plant protection products and treated seeds containing clothianidin, imidacloprid, and thiamethoxam to protect honeybees [11] based on a risk assessment of the European Food Safety
Authority (EFSA). These NNIs were banned in bee-attractive crops
(including maize, oilseed rape and sunflower) except for uses in
greenhouses, the treatment of some crops after flowering and winter cereals. However, considering the worrying exposure of pollinators to NNIs and its consequences, in May 2018 the European
Commission restricted the application of imidacloprid, clothianidin,
and thiamethoxam to greenhouse uses only [12]. Also, on February
2020, the approval of thiacloprid was not renewed following the
scientific advice of EFSA that the substance presents health and
environmental concerns [13]. However, some EU countries have repeatedly granted emergency authorizations for their use in different crops, such as sugar beets. In this sense, maximum residues
levels (MRLs) for different commodities or lower limit of analytical
determination (in such matrixes for which their use is forbidden,
including apiculture products) have been established [14]. In addition, due to their toxicity, the Worldwide Integrated Assessment
(WIA) has recently reported alternatives to systemic insecticides
such as NNIs in pest control [15].
On the other hand, recent works have demonstrated that certain fungicides, such as boscalid (Fig. S1), in the presence of NNIs,
are able to reduce the lethal time and median lethal dose (LD50 )
for honeybees, increasing the harmful effects of NNIs in agricultural areas [16,17]. Boscalid belongs to the carboxamide family and
acts via decreasing the ATP concentration, pollen consumption, and
protein digestion in bees, so it has also been related to the CCD
[18]. For that reason, it is of great interest to consider this fungicide together with NNIs for their monitoring. However, these compounds have been rarely determined simultaneously so far [19].
Usually, liquid chromatographic (LC) methods have been mostly
used for the determination of NNIs as it has been compiled in
some reviews concerning the analysis of these compounds [20,21].
LC coupled to tandem mass spectrometry (LC-MS/MS) is the technique of choice for most recent applications [22–25]. On the contrary, the use of capillary electrophoresis (CE) has been scarcely
investigated despite of presenting numerous advantages. These include low solvent consumption, low sample volume, high separation efficiency, and short separation time, being also in compliance with green analytical chemistry [26]. Considering that most
of NNIs are neutral in a wide range of pH, the determination of
NNIs by capillary zone electrophoresis (CZE) leads to poor separations [27]. Instead, micellar electrokinetic chromatography (MEKC)
is more suitable to determine these compounds. Some CE-based
methods have been developed for the determination of NNIs in
vegetables [28,29], soil and environmental waters [30,31] mainly
using MEKC coupled to UV detection, however, CE has been rarely
applied to honeybee products [27]. In some cases, sweeping-MEKCUV using sodium dodecyl sulfate (SDS) as micellar medium has
been reported to provide an on-line pre-concentration of the analytes [28,30]. Nevertheless, the coupling with tandem mass spectrometry (MS/MS) is the most suitable technique to improve selectivity and sensitivity, allowing the unequivocal identification of
target compounds at trace levels; a key point in food safety. However, commonly used surfactants such as SDS are non-volatile and
can contaminate the ion-source of the mass spectrometer, leading
to an analyte signal suppression and a marked decrease of sensitivity. To overcome this shortcoming, several studies have recently
revealed the potential of using a volatile surfactant such as ammonium perfluorooctanoate (APFO), which can also act as background
electrolyte. This is a robust alternative to common surfactants and
allows the direct coupling of MEKC to MS without negatively affecting both, the electrophoretic separation nor the MS detection
[32–35].
Regarding sample treatments to determine NNIs by LC, the
QuEChERS (quick, easy, cheap, effective, rugged, and safe) procedure and solid-phase extraction (SPE) appear as the most-often
used techniques. They have been applied to numerous environmental and food samples, including honeybee products such as
beeswax, pollen, honey, and royal jelly [36]. However, QuEChERS is
not usually applied in CE methods as it involves a sample dilution,
which can compromise sensitivity.
In light of the environmental problem associated to the abovementioned pesticides and the lack of studies reported using CE-MS
for their determination, the main aim of this work is to demonstrate the potential of MEKC-MS/MS for the simultaneous determination of NNIs and boscalid in complex samples. In addition, we
have modified a traditional QuEChERS procedure to avoid sample
dilution and decrease of sensitivity, being compatible with the CE
method for the analysis of pollen and honeybee samples.
2. Materials and methods
2.1. Materials and reagents
Unless otherwise specified, analytical grade reagents and HPLC
grade solvents were used in this work. Acetonitrile (MeCN), formic
acid (FA), propan-2-ol and methanol (MeOH) were supplied by
VWR International (West Chester, PA, USA), while ethanol (EtOH)
and ammonia solution, (NH3 (aq), 30% (m/m)) were obtained
from Merk (Darmstadt, Germany). Sodium hydroxide (NaOH) as
well as salts such as magnesium sulfate anhydrous (MgSO4 ),
sodium sulfate (Na2 SO4 ), and sodium chloride (NaCl) were obtained from PanReac-Química (Madrid, Spain) while ammonium
sulfate ((NH4 )2 SO4 ) was obtained from VWR Chemicals (Barcelona,
Spain). Dispersive sorbents such as Primary Secondary Amine (PSA)
and C18 end-capped sorbent were supplied by Agilent Technologies (Waldbronn, Germany) while activated carbon and Z-Sep+
were obtained from Sigma-Aldrich (St. Louis, MO, USA) as well as
the perfluorooctanoic acid (PFOA) (96% m/m).
Analytical standards of dinotefuran (DNT), thiamethoxam
(TMT), clothianidin (CLT), nitenpyram (NTP), imidacloprid (IMD),
thiacloprid (TCP), acetamiprid (ACT), imidaclothiz (IMZ), flonicamid
(FNC), and boscalid (BCL) were supplied by Sigma Aldrich.
Individual standard solutions were obtained by dissolving the
appropriate amount of each compound in MeOH, reaching a final concentration of 500 μg mL−1 , which were kept in dark at 20 °C. Intermediate stock standard solution containing 50 μg mL−1
of each compound were obtained by mixing individual stock standard solutions, followed by a solvent evaporation step under a current of N2 , and subsequent dilution with ultrapure water. Working standard solutions were freshly prepared by dilution of the intermediate stock standard solutions with ultrapure water at the
required concentration. Both, intermediate and working solutions
were stored at 4 °C avoiding exposure to direct light.
Solutions of 50 mM APFO at pH 9 used as background electrolyte (BGE) were prepared weekly dissolving the necessary
amount of PFOA in ultrapure water and adjusting the pH with 5
M NH3 (aq).
Polytetrafluoroethylene (PTFE) syringe filters (0.22 μm x 13
mm) such as CLARIFY-PTFE (hydrophilic) obtained from Phenomenex (California, USA) were used for sample filtration, and
PTFE from VWR international (West Chester, PA, USA) were employed for filtration of NaOH and BGE.
2.2. Instrumentation
MEKC experiments were performed with an Agilent 7100 CE
system coupled to a triple quadrupole 6495C mass spectrometer (Agilent Technologies, Waldbronn, Germany) equipped with
2
L. Carbonell-Rozas, B. Horstkotte, A.M. García-Campa et al.
Journal of Chromatography A 1672 (2022) 463023
an electrospray ionization source operating in positive ionization
mode (ESI+ ). Sheath liquid was supplied with a 1260 Infinity II Iso
Pump. MS data were collected and processed by MassHunter software (version 10.0).
Separations were carried out in bare fused-silica capillaries (70
cm of total length, 50 μm I.D., 375 O.D.) from Polymicro Technologies (Phoenix, AZ, USA).
A pH meter (Crison model pH 20 0 0, Barcelona, Spain), a vortex2 Genie (Scientific Industries, Bohemia, NY, USA), a multi-tube vortexer BenchMixer XL (Sigma-Aldrich, St. Louis, MO, USA), and a
nitrogen dryer EVA-EC System (VLM GmbH, Bielefeld, Germany)
were also employed.
this procedure was repeated but using 0.1 M NaOH. In order to obtain an adequate repeatability between runs, capillary was rinsed
with the BGE for 3 min at 1 bar and 25°C at the beginning of each
run. At the end of the working day, capillary was cleaned with ultrapure water for 5 min, followed by MeOH for 2 min, and finally
dried with air for 1 min at 1 bar and 25°C.
MEKC separation was performed using a BGE consisted of an
aqueous solution of 50 mM PFOA at pH 9, which gave a stable electric current of 25 μA. The temperature of the capillary was kept at
25°C and a constant separation voltage of 25 kV (normal polarity)
was applied. Samples were hydrodynamically injected for 50 s at
50 mbar using ultrapure water as injection solvent in order to induce sweeping.
2.3. Sample treatment
2.5. MS/MS conditions
2.3.1. Sample collection and preparation
Commercially available pollen from a local market (Granada,
Spain) was used for method optimization. The pollen was kept in
its original packaging at room temperature until further handling.
Natural pollen samples used to monitor the presence of the target
compounds were gathered from almond blossoms at three different farmlands located in Fuente Vera (Granada, Spain), and immediately stored at -20 °C until their use. Flowers were defrosted and
dried at 30 °C for 24 hours to extract the pollen from the anthers.
Afterwards, flowers were carefully sieved through a 0.2 mm mesh
to separate pollen from them. Lab tweezers were also needed to
release the pollen in some cases. The obtained natural pollen samples from each farmland were kept in a dry place until their analysis.
In order to characterize the method in blank honeybee samples, approximately 500 specimens were carefully collected from
an organic farmland in which the use of beehives is common. In
addition, about 200 honeybees were collected in an area located
close to the almond fields above mentioned. This sampling point
was selected because hundreds of dead adult worker bees were
found there, so the analysis of these samples was particularly interesting in order to prove the usefulness of this method. All samples were rapidly stored at -20 °C until their use. Then, honeybees
were lyophilized at -109 °C in order to guarantee the proper crushing and homogenization of the sample.
Sheath-liquid
consisting
of
a
mixture
50:50
(v/v)
EtOH/ultrapure water containing 0.05% (v/v) formic acid was
provided at a flow rate of 5 μL min−1 (0.5 mL min−1 with a
1:100 splitter). The mass spectrometer was operated in positive
ionization mode (ESI+ ) under multiple reaction monitoring (MRM)
conditions. 20 0 0 V were applied in both capillary and nozzle.
Other electrospray parameters at optimum conditions were: nebulizer pressure, 69 kPa, dry gas flow rate, 11 L min−1 ; and dry
gas temperature, 200 °C. MS/MS experiments were performed by
fragmentation of the molecular ions [M+H]+ , which were selected
as the precursor ions in all cases. Collision energies (V) were set
between 9 and 25, depending on the analyte, and product ions
were analyzed in the range of 114-307 m/z. Optimized MS/MS
parameters are summarized in Table 1.
3. Results and discussion
3.1. Optimization of electrophoretic conditions
CE separations were performed using MEKC mode, in which
neutral analytes can be separated due to their different interaction with the micelles. Optimization of the main variables affecting
the separation of the target compounds by MEKC were carried out
considering different response variables such as S/N ratio, migration time and peak resolution. In addition, the generated current
was kept lower than 30 μA to minimize the Joule effect.
As stated before, surfactants such as the commonly used SDS
are not recommended when MS detection is used. Therefore, the
use of a volatile surfactant such as APFO was considered as both,
BGE and micellar medium. Firstly, basic pH conditions are needed
to dissolve PFOA in ultrapure water. In addition, target compounds
are neutral at basic conditions. Therefore, the effect of pH in the
separation was investigated between 8 and 10 using 75 mM PFOA.
There were no significant differences in this pH range, so a pH of
9 was selected.
Subsequently, taking into consideration that the critical micelle
concentration (CMC) of APFO is 25 mM, different concentrations
of APFO between 50 and 100 mM were investigated at pH 9. As
the concentration increases so does the resolution between peaks
as well as the migration time. However, the intensity of the signal
for most analytes was higher at concentrations lower than 50 mM,
and the migration time was significantly shorter (11 min). Thus, a
concentration of 50 mM APFO was selected as a compromise between migration time, signal intensity and resolution. In order to
reduce the total analysis time, capillary was shortened from 80 to
70 cm. Separation efficiency, particularly for ACT, was slightly better and the total analysis time was reduced in 2 min when this
capillary was used, so a length of 70 cm was selected as optimum
for further experiments.
2.3.2. Scaled-down QuEChERS procedure
The sample treatment for pollen and honeybee samples was
carried out as follows: a representative 200 mg portion of each
sample was placed into a 15 mL centrifuge tube and 1 mL of ultrapure water was added to hydrate the samples, which were subsequently vortexed for 1 min. Then, 2.5 mL of MeCN were added as
well as 200 mg of MgSO4 to favor salting-out effect. The tube was
mechanically shaken for 2 min and centrifuged for 5 min at 8487
g and 4°C. Then, the whole supernatant was transferred to another
15 mL centrifuge tube containing 30 mg of Z-Sep+ as dispersive
sorbent and 100 mg of MgSO4 . The tube was stirred in vortex for
2 min and centrifuged for 5 min at 90 0 0 rpm (8487 g) and 4°C.
Afterwards, an aliquot of 2 mL of supernatant was transferred to
a glass vial and dried under a gentle N2 stream at 35°C. Finally,
the dried residue was reconstituted with 200 μL of ultrapure water, shaken in an ultrasonic bath and filtered through a 0.22 μm
hydrophilic-PTFE filter before its injection into the CE-MS/MS system.
2.4. Micellar electrokinetic chromatography separation
New capillaries were conditioned with 1 M NaOH for 15 min,
followed by ultrapure water for 10 min and then, with the running
BGE for 15 min at 1 bar and 25°C. At the beginning of each day,
3
L. Carbonell-Rozas, B. Horstkotte, A.M. García-Campa et al.
Journal of Chromatography A 1672 (2022) 463023
Table 1
MS/MS parameters for target compounds.
Migration
time (min)
Precursor
ion (m/z)
Molecular
ion
Product
ionsa
CEb
Dwell time
(ms)
DNT
5.29
203.1
[M+H]+
TMT
5.25
292
[M+H]+
FCM
5.4
230.1
[M+H]+
CLT
5.42
250
[M+H]+
NTP
5.88
271.1
[M+H]+
IMZ
6
262
[M+H]+
IMD
6.47
256.1
[M+H]+
TCP
6.52
253
[M+H]+
ACT
6.77
223.1
[M+H]+
BCL
7.18
343
[M+H]+
129.2 (Q)
114.0 (I)
210.9 (Q)
131.7 (I)
202.8 (Q)
173.9 (I)
168.9 (Q)
132.0 (I)
189.0 (Q)
237.3 (I)
180.9 (Q)
131.7 (I)
209.1 (Q)
175.0 (I)
125.9 (Q)
90.0 (I)
126.0 (Q)
56.1 (I)
307.0 (Q)
140.0 (I)
9
9
10
10
15
15
10
10
15
15
15
15
15
15
25
25
15
15
20
20
50
50
50
50
40
40
80
80
50
50
50
50
50
50
50
50
80
80
60
60
a
Product ions: (Q) Transition used for quantification, (I) Transition employed to confirm
the identification.
b
Collision Energy (CE) expressed in volts (V).
Afterwards, the effect of the temperature on the MEKC separation was studied in the range of 20-35 °C. It was observed that the
total analysis time decreased when the temperature increased up
to 30 °C. Nevertheless, the electrophoretic current increased with
the temperature, so in order to avoid this, a temperature of 25 °C
was selected. Moreover, the separation voltage was also studied in
the range of 20-30 kV. The best results as a compromise between
the analysis time and the electrophoretic current were obtained
when 25 kV was used, so it was selected for further analysis.
In order to improve sensitivity, an on-line pre-concentration of
the analytes was performed using a solvent devoid of micelles
as injection solvent. This approach, known as “sweeping” is designed to focus the analytes into a narrow band within the capillary, thereby increasing the sample volume that can be injected
without any loss of separation efficiency. It is based on the interactions between an additive (i.e. a pseudostationary phase or micellar media) in the separation buffer and the sample in a matrix
that is free of the used additive. It involves the accumulation of
charged and neutral analytes by the pseudostationary phase that
penetrates the sample zone and “sweeps” the analytes, producing a
focusing effect. In this case, ultrapure water was used as injection
solvent, since it allowed the stacking of the analytes when they
were swept by the BGE containing APFO micelles [37,38]. The use
of an organic solvent as injection solvent was discarded since this
negatively affected the formation of micelles and had an adverse
impact on peak shapes as it was also previously reported [35]. Finally, the effect of the hydrodynamic injection time on peak height
was checked in the range from 20 to 60 s at 50 mbar. There was
an increase in the peak height up to 50 s without significantly affecting separation efficiency. In this regard, an injection time of 50
s was set. This injection time corresponds to a sample volume of
55 nL approximately (4% of the total capillary volume).
Sensitivity enhancement factors (SEFs) for NNIs and boscalid
were estimated comparing peak heights of standard solutions dissolved in water (sweeping) with standard solutions of the same
concentration dissolved in BGE (no sweeping):
SEFheight =
were checked for each analyte. Significantly better results were obtained when ultrapure water was employed as injection solvent
(Table S2). In view of these results, the use of sweeping as on-line
pre-concentration led to an improvement in sensitivity as well as
in separation efficiency for the studied compounds.
3.2. Optimization of MEKC-ESI-MS/MS conditions
The sheath-liquid must be carefully selected in order to have
a stable electrospray and good sensitivity. Thus, different parameters affecting the electrospray such as composition and flow of the
sheath-liquid, dry gas flow and temperature, and nebulizer pressure have been optimized considering the S/N ratio obtained as
response variable.
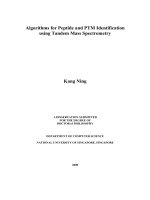
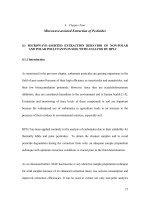
At the beginning, the composition of the sheath-liquid was
evaluated considering different organic solvents such as MeOH,
EtOH, propan-2-ol and MeCN. The sheath-liquid in all cases consisted of a 50:50 organic solvent/ultrapure water mixture containing 0.5% (v/v) of formic acid. For most compounds, similar S/N ratios were obtained when MeOH and EtOH were used, except in
the case of TCP and ACT that showed an increase in the S/N ratio
when EtOH was employed. With MeCN and propan-2-ol the S/N
was lower in all cases (Fig. 1). Considering also that EtOH is more
environmentally friendly, it was selected as the organic solvent for
the sheath-liquid. Subsequently, the percentage of EtOH was studied from 40 to 60%. An increase in the S/N ratio was achieved using 50%, so it was chosen as optimum. Formic acid was added to
ensure the adequate positive ionization of the analytes. The percentage added was checked from 0.1 to 1%. It was observed that
percentages higher than 0.5 did not improve the S/N ratio, therefore, this value was selected as optimum. Because of these results,
sheath-liquid composition was 50:49.5:0.5 (v/v/v), EtOH/ultrapure
water/formic acid.
Sheath-liquid flow rate plays an important role to ensure electrospray stability and therefore, it has an influence in the analysis
repeatability. Consequently, it was studied in the range 2.5-15 μL
min−1 (Fig. S2). A reduction of the S/N ratio was observed when
the flow rate increased, which may be explained because of the
dilution of the CE effluent. A flow rate below 5 μL min−1 led to an
unstable electrospray, so it was discarded. Ergo, 5 μL min−1 was
selected as optimum for further analysis.
Analyte peak height using sweeping
Analyte peak height without using sweeping
SEFs ranging from 1.6 to 5.6 were achieved for the studied analytes using sweeping as can be seen in Table S1. In addition, peak
efficiencies (theoretical plate number) with and without sweeping
4
L. Carbonell-Rozas, B. Horstkotte, A.M. García-Campa et al.
Journal of Chromatography A 1672 (2022) 463023
plied [39], probably due to a higher matrix effect (ME) in CE-MS. In
consequence, the main variables affecting the scaled-down QuEChERS were optimized to achieve the highest extraction recoveries.
To begin with, a representative pollen sample (200 mg) was
placed in a 15 mL centrifuge tube and spiked with the desired concentration of the target analytes. Then, the sample was hydrated
with 1 mL of ultrapure water and vortexed for proper homogenization. Subsequently, 2.5 mL of MeCN were added, which was
the minimum volume able to extract the studied compounds with
acceptable recoveries from this amount of sample.
The ionic strength was studied because the addition of salts to
the aqueous phase may have a salting-out effect decreasing the
analyte solubility in water and favoring their transference to the
organic phase. In this sense, several salts such as MgSO4 , Na2 SO4 ,
(NH4 )2 SO4 , and NaCl were evaluated. Thus, after adding the extraction solvent to the aqueous sample, 200 mg of each salt were also
added, and the tube was shaken for 2 min and centrifuged for 5
min at 8487 g and 4 °C. It must be mentioned that NaCl quite
often led to electrophoretic current disruptions, therefore, it was
discarded. The best results in terms of recoveries (above 75% in all
cases) were obtained when MgSO4 was employed, so it was selected as salting-out agent. Subsequently, the amount of this salt
was also tested from 100 to 400 mg. It was observed that 100 mg
was not enough to obtain a well-defined phase separation, leading
to poor recoveries. On the other hand, above 200 mg, recoveries
decreased in all cases. Therefore, 200 mg of MgSO4 was selected
as salting-out agent.
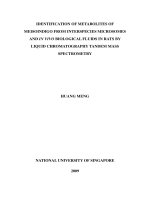
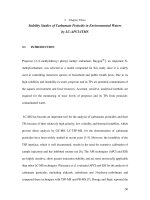
Afterwards, to improve the extraction efficiency and to reduce
the matrix effect, different dispersive sorbents were evaluated in
the d-SPE step such as Z-Sep+, EMR lipids, PSA, C18 and a mixture
of PSA/C18 (1:1) as it is shown in Fig. 2. In all cases an amount of
80 mg of sorbent was used together with 100 mg of MgSO4 anhydrous to remove possible traces of ultrapure water in the organic
extraction solvent. In general, recoveries were above 70% in most
cases except when the EMR lipids sorbent was used. In addition,
the recovery for NTP significantly decreased when Z-Sep+ was employed, being around 40% (Fig. 2A). On the other hand, this sorbent
provided the best results in terms of ME (Fig. 2B). The amount of
Z-Sep+ was reduced to improve NTP recovery. As can be seen in
Fig. S3, reducing the amount of this sorbent to 30 mg, recoveries
around 70% for NTP were achieved. Decreasing the amount of sorbent led to ME slightly higher for all analytes, but still better than
those obtained with the other sorbents. This sorbent, despite its
high potential to clean the complex extract, has not been explored
in d-SPE of honeybee products and NNIs determination where PSA
sorbent has been traditionally used [3,40].
Finally, different syringe filters were tested through the filtration of a standard solution with each one. Then, the results obtained were compared with a standard solution without filtering
at the same concentration. The best results, in terms of recoveries,
for most analytes were obtained with hydrophilic-PTFE filter. Unfortunately, even with this filter, around 50% of boscalid was lost
during filtration (Fig. S4).
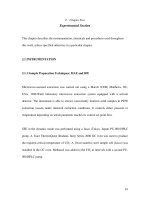
An electropherogram of a pollen sample spiked with the studied analytes submitted to the optimized sample treatment and
analyses by the proposed MEKC-MS/MS method is shown in Fig. 3.
Fig. 1. Effect of the sheath-liquid composition on the signal-to-noise (S/N) ratio.
Error bars represent standard error (n=4).
After optimizing the sheath-liquid, the nebulizer pressure was
evaluated between 6 and 12 psi. Above 10 psi, the spray stability decreased inducing poor repeatability in the migration. The
best compromise between repeatability and S/N ratio was obtained
when a nebulizer pressure of 10 psi was used. Regarding the dry
gas, temperature and flow were evaluated. Firstly, the dry gas temperature was tested from 20 0-30 0 °C taking into consideration that
APFO can be used as volatile surfactant at temperatures above 150
°C at which this surfactant decomposes. An increase in the temperature did not improve the S/N ratio, so 200 °C was selected. Then,
the dry gas flow rate was studied from 11 to 20 L min−1 , obtaining
the best S/N ratio when 11 L min−1 was employed.
Finally, the ESI voltage which affects the sensitivity of MS detection was also studied. The voltage was varied from 10 0 0 to 30 0 0
V keeping the nozzle at 20 0 0 V. With a voltage of 10 0 0 V a significant reduction of the S/N ratio was observed, however, for the
rest of the tested voltages no significant differences were noticed.
Thus, 20 0 0 V was chosen as ESI voltage.
In order to get optimum selectivity, the main MS/MS parameters were studied. First of all, using the SCAN mode, it was
observed that the protonated molecules [M+H]+ were the most
abundant for all analytes. Once the precursor ion was fixed for
each compound, the main fragments were investigated by collision
induced dissociations selecting the optimum collision energy to be
applied in order to obtain the highest signal in each case. Finally,
an MRM method was developed taking into consideration the data
mentioned before as well as the migration time of the target analytes. In this method, dwell time for each transition was also optimized varying from 40 to 80 ms depending on the analyte to guarantee a minimum data acquisition of 10 points per peak.
3.3. Optimization of the sample treatment
In this work, a scaled-down QuEChERS procedure has been developed for the extraction and clean-up of nine NNIs and boscalid
from pollen and honeybee samples. In a scaled-down QuEChERS,
the amount of sample is reduced as well as the volume of MeCN
required for the extraction of the analytes, reducing the organic
solvent consumption and avoiding the dilution of the analyte concentration.
No satisfactory recoveries were obtained when a previously
published protocol for determination of NNIs by LC-MS was ap-
3.4. Method characterization
The optimized scaled-down QuEChERS-MEKC-MS/MS method
was evaluated in terms of linearity, limits of detection (LODs), limits of quantification (LOQs), extraction recovery, matrix effect, and
precision (i.e., repeatability and intermediate precision) in pollen
and honeybee samples. Both samples were previously analyzed using the proposed method and neither analytes nor interferences
were found.
5
L. Carbonell-Rozas, B. Horstkotte, A.M. García-Campa et al.
Journal of Chromatography A 1672 (2022) 463023
Fig. 2. Optimization of dispersive sorbents in the d-SPE step of the sample treatment procedure for the extraction of the analytes from a spiked pollen sample. a) Effect on
the extraction recoveries; b) Effect on the matrix effect. Error bars represent standard error (n=4).
Table 2
Statistical and performance characteristics of the proposed method for the determination of NNIs and boscalid in commercial pollen samples
by MEKC-MS/MS.
Analyte
Linear regression equation
DNT
TMT
FCM
CLT
NTP
IMZ
IMD
TCP
ACT
BCL
y
y
y
y
y
y
y
y
y
y
=
=
=
=
=
=
=
=
=
=
16.902x + 75.7
22.533x – 39.225
13.244x – 25.013
13.38x + 8.885
2.458x + 7.149
35.417x – 23.187
10.372x – 8.522
25.305x – 45.832
19.975x + 32.224
5.303x – 28.086
Linear range (μg kg−1 )
Linearity (R2 )
LOD (μg kg−1 )
LOQ (μg kg−1 )
MRL (μg kg−1 )
9.7-200
6.5-200
3.8-200
9.7-200
9.0-200
8.0-200
6.1-200
5.7-200
6.0-200
11.6-200
0.9915
0.9904
0.9915
0.9902
0.9906
0.9900
0.9906
0.9911
0.9930
0.9923
2.9
1.9
1.1
2.9
2.7
2.4
1.8
1.8
1.8
3.5
9.7
6.5
3.8
9.7
9.0
8.0
6.1
5.7
6.0
11.6
♦
50∗
50∗
50∗
♦
♦
50∗
200
50∗
150
♦MRL non-established. Default value of 10 μg kg−1 .
∗
Indicates lower limit of analytical determination.
Table 3
Precision of the proposed method for the determination of NNIs and boscalid
in commercial pollen samples.
3.4.1. Calibration curves and analytical performance characteristics
Procedural calibration curves for pollen and honeybee samples
were performed at different concentration levels; 5, 10, 25, 50, 100,
and 200 μg kg−1 for pollen samples and 2, 5, 10, 25, 50, 100, and
200 μg kg−1 for honeybee samples. Procedural calibration involves
the analysis of samples fortified before the sample treatment. Two
samples were spiked at each concentration level, treated according to the scaled-down QuEChERS procedure, and analyzed in triplicate by the proposed MEKC-MS/MS method. Peak area was selected as analytical response and considered as a function of the
analyte concentration on the sample. LODs and LOQs were calculated as the minimum analyte concentrations yielding a S/N ratio
equal to three and ten times, respectively. As shown in Table 2,
a satisfactory linearity was confirmed at the concentration range
studied (R2 > 0.9900) with LODs and LOQs below 3.5 μg kg−1 and
11.6 μg kg−1 respectively, for pollen samples, and below 4.0 μg
kg−1 and 12.5 μg kg−1 , respectively, for honeybee samples (Table
S3). These results highlight that the proposed method allows the
determination of NNIs and boscalid in pollen samples at levels below their MRLs established in apiculture products by the European
Legislation [14].
Analyte
DNT
TMT
FCM
CLT
NTP
IMZ
IMD
TCP
ACT
BCL
Repeatability, %RSD (n=9)
Intermediate precision, %RSD (n=9)
10 μg kg−1
50 μg kg−1
10 μg kg−1
50 μg kg−1
8.3
10.0
9.4
10.3
10.1
8.3
10.6
10.8
9.0
11.3
5.7
10.4
8.2
8.5
9.0
8.9
8.3
9.6
7.5
9.3
12.9
14.4
13.6
13.9
14.8
14.2
13.6
13.7
12.0
15.5
9.6
13.8
8.7
9.8
12.7
9.2
8.6
12.2
11.4
13.5
under the same conditions (n=9). In the case of intermediate precision, it was evaluated with a similar procedure, but analyzing one
sample prepared each day during three different days (n=9). The
obtained results, expressed as RSD (%) of peak areas, for pollen
samples are summarized in Table 3 while the corresponding results for honeybee samples are in Table S4. Satisfactory RSD were
achieved for both samples, being lower than 10.6% and 15.2% for
repeatability and intermediate precision, fulfilling the EU recommendations concerning the performance of analytical methods for
the determination of contaminants, which set an upper limit for
RSD of 20% [41].
3.4.2. Precision
Precision of the proposed method was evaluated in terms of
repeatability (i.e., intra-day precision) and intermediate precision
(i.e., inter-day precision) by the application of the method to pollen
and honeybee samples spiked at two concentration levels in the
linear range (10 and 50 μg kg−1 ). For repeatability, three samples
were submitted to the sample procedure (experimental replicates)
and injected in triplicate (instrumental replicates) the same day
3.4.3. Recovery studies
In order to evaluate the efficiency of the proposed scaled-down
QuEChERS, recovery experiments were carried out. Three blank
6
L. Carbonell-Rozas, B. Horstkotte, A.M. García-Campa et al.
Journal of Chromatography A 1672 (2022) 463023
Fig. 3. Electrophoretic separation of a blank pollen sample spiked with the standard mixture solution of NNIs and boscalid at a concentration of 200 μg kg-1 .
samples of each matrix were fortified at two different concentration levels (10 and 50 μg kg−1 ), treated following the sample treatment procedure and analyzed in triplicate by MEKC-MS/MS. The
data, in terms of peak area, were compared with those obtained by
analyzing extracts of blank samples submitted to the sample treatment and fortified at the same concentration levels just before the
injection. Generally, recoveries over 80% were obtained except for
nitenpyram and boscalid in pollen samples, which showed recovery values above 70% (Table 4). The results for honeybee samples
are shown in Table S5. In any case, these results suggest that the
ME(% ) =
proposed sample treatment method could be satisfactorily applied
to determine NNIs and boscalid in these matrixes.
3.4.4. Evaluation of matrix effect
Matrix effect (ME) can be attributed to many factors, affecting
analyte ionization in MS and, therefore, resulting in ion suppression or signal enhancement. ME can be estimated by comparing
the analytical response provided by blank extracts spiked after the
sample treatment with the response that results from a standard
solution at the same concentration. The following equation is used
for this comparison:
signal of extract spiked after extraction − signal of standard solution
× 100
signal of standard solution
7
L. Carbonell-Rozas, B. Horstkotte, A.M. García-Campa et al.
Journal of Chromatography A 1672 (2022) 463023
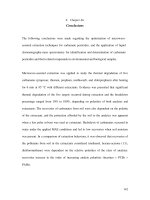
Fig. 4. Electropherograms of naturally contaminated samples of pollen: a) IMD (61.2 μg kg1 ); b) IMD (20.1 μg kg-1 ) and TMT (10.7 μg kg-1 ), and honeybees C) IMD (8.4 μg
kg-1 ).
Table 4
Matrix effect and recovery studies of the proposed method for the
determination of NNIs and boscalid in commercial pollen samples.
Matrix Effect (%)
Analyte
DNT
TMT
FCM
CLT
NTP
IMZ
IMD
TCP
ACT
BCL
10 μg kg
-15.4
-21.4
-22.0
-33.7
-17.9
-16.8
-41.9
-42.8
-37.6
-70.1
−1
50 μg kg
-11.3
-19.6
-18.7
-30.1
-16.7
-16.2
-38.4
-37.2
-34.7
-66.1
Hence, the results revealed that imidacloprid was found in two
of the three analyzed pollen samples, in concentrations of 61.2 μg
kg−1 (1.7% RSD, n=3) and 20.1 μg kg−1 (0.9% RSD, n=3), respectively. The first sample exceeded the “limit of analytical determination” established for this compound in honey and other apiculture
products (50 μg kg−1 ), considering that no MRL is established because of its prohibition. In addition, thiamethoxam was also found
in the second sample with a concentration of 10.7 μg kg−1 (1.1%
RSD, n=3) (Fig. 4).
The results also indicated that honeybees were contaminated
with 8.4 μg kg−1 of imidacloprid (0.7% RSD). These results suggest
that some NNIs could have been applied as a control insecticide in
near agricultural fields leading to the presence of residues in the
pollen of almond tree’s flowers. Additionally, the presence of imidacloprid in honeybee samples could suggest that honeybees could
have been in contact with this insecticide despite of being banned
for foliar uses. This fact suggests a possible causal link between
the presence of this insecticide and the death of the honeybees
analyzed in this study.
Recovery (%)
−1
10 μg kg−1
50 μg kg−1
80.1
87.3
86.1
80.8
70.6
85.4
91.5
80.5
92.6
75.2
85.5
90.1
88.2
83.9
74.2
86.4
94.2
85.9
95.2
79.4
The ME was evaluated in pollen and honeybee samples at two
concentration levels (10 and 50 μg kg−1 ). A ME of 0% indicates the
absence of the matrix effect, a ME below 0% involves signal suppression while a ME above 0% reveals signal enhancement from
interferences. As shown in Table S5, most of the analytes presented
a negligible ME (<│20%│) in honeybee samples. However, higher
signal suppression was observed for most analytes in pollen samples (Table 4). Nevertheless, procedural calibration curves were established for both matrices to compensate both, ME and losses due
to the sample treatment procedure.
4. Conclusions
To the best of our knowledge, this is the first time that MEKC
coupled to tandem MS detection has been applied for monitoring NNIs and boscalid. A volatile surfactant such as APFO, which
acts simultaneously as BGE and micellar medium compatible with
MS, has been employed. The proposed MEKC-MS/MS method offers shorter analysis time, higher resolution, and higher selectivity
and sensitivity than the only one previous method for the control
of NNIs in beeswax using CZE-MS [27]. Furthermore, MEKC enables
an on-line pre-concentration strategy such as sweeping that made
possible to achieve SEFs between 1.6 and 5.6 for the studied compounds. Regarding sample treatment, a scaled-down QuEChERS has
been optimized. Different dispersive sorbents were evaluated and
Z-Sep+, although less commonly employed than C18 and PSA, provided better results in terms of matrix effect. In addition, unlike
traditional QuEChERS methods, sample is not diluted, which improves method sensitivity. LOQs in the range of low μg kg−1 were
obtained for all target pesticides in pollen and honeybee samples
which demonstrated for the first time the potential of using MEKCMS/MS for their quantification. In addition, this method is in compliance with the principles of green analytical chemistry. It com-
3.5. Analysis of real samples
Three pollen samples collected from almond blossoms in three
different locations and one sample of honeybee bodies were analyzed in triplicate in order to demonstrate the applicability of the
validated method. The honeybees were found dead under suspicious circumstances since hundreds of these specimens died suddenly in the same area. Both sampling points (pollen and honeybees) were less than 100 m apart from each other.
The criteria set for the positive identification of NNIs in the
samples was that a peak should have a S/N ratio of at least 3
and the relative ion intensities for detection and quantification ions
must correspond to those of these ions in the solutions of standards. Thereby, samples which met these requirements and also
exceeded the corresponding LOQs, were considered as positives.
8
L. Carbonell-Rozas, B. Horstkotte, A.M. García-Campa et al.
Journal of Chromatography A 1672 (2022) 463023
bines the low solvent consumption during sample treatment with
the reduced volume of BGE used in CE and the lower waste production. Moreover, this method involves a low amount of sample
and lower cost than LC methods. The usefulness of the developed
method was proved by its application to natural pollen and honeybee samples suspected of being contaminated. Results suggest
that the use of these pesticides could be the reason of the sudden
death of hundreds of honeybees close to a field of almond trees.
To conclude, the proposed scaled-down QuEChERS-MEKC-MS/MS
method can be a real alternative to LC methods to monitor NNIs
and boscalid in pollen and honeybee samples.
[8] B. Buszewski, M. Bukowska, M. Ligor, I. Staneczko-Baranowska, A holistic
study of neonicotinoids neuroactive insecticides—properties, applications, occurrence, and analysis, Environ. Sci. Pollut. Res. 26 (2019) 34723–34740, doi:10.
1007/s11356- 019- 06114- w.
[9] J.M. Bonmatin, C. Giorio, V. Girolami, D. Goulson, D.P. Kreutzweiser, C. Krupke,
et al., Environmental fate and exposure; neonicotinoids and fipronil, Environ.
Sci. Pollut. Res. Int. 22 (2015) 35–67, doi:10.1007/s11356- 014- 3332- 7.
[10] A. Singla, H. Barmota, S. Kumar Sahoo, B. Kaur Kang, Influence of neonicotinoids on pollinators: A review, J. Apic. Res. 60 (2021) 19–32, doi:10.1080/
00218839.2020.1825044.
[11] Commission Implementing Regulation (EU) No 485/2013 of 24 May 2013
amending Implementing Regulation (EU) No 540/2011, as regards the conditions of approval of the active substances clothianidin, thiamethoxam and imidacloprid, and prohibiting the use and sale of seeds treated with plant protection products containing those active substances, Off. J. EU, L139, 12-26.
[12] Food Safety- European Commission (2019) />pesticides/approval_active_substances/approval_renewal/neonicotinoids_en.
(Accessed on 20 November 2021).
[13] Pesticides: Commision bans a neonicotinoid from EU market- European Commission. (Accessed on 31 October 2021).
[14] EU pesticides database-European Commission. />pesticides/eu-pesticides-database/mrls/ (Accessed on 25 October 2021).
[15] L. Furlan, A. Pozzebon, C. Duso, N. Simon-Delso, F. Sánchez-Bayo, P.A. Marchand, et al., An update of the Worldwide Integrated Assessment (WIA) on systemic insecticides. Part 3: alternatives to systemic insecticides, Environ. Sci.
Pollut. Res. 28 (2021) 11798–11820, doi:10.1007/s11356- 017- 1052- 5.
[16] N. Simon-Delso, G. San Martin, E. Bruneau, et al., Time-to-death approach to
reveal chronic and cumulative toxicity of a fungicide for honeybees not revealed with the standard ten-day test, Sci. Rep. 8 (2018) 7241, doi:10.1038/
s41598- 018- 24746- 9.
[17] N. Tsvetkov, O. Samson-Robert, K. Sood, H.S. Patel, et al., Chronic exposure to
neonicotinoids reduces honey bee health near corn crops, Science 356 (6345)
(2017) 1395–1397, doi:10.1126/science.aam7470.
[18] G. Degrandi-Hoffman, Y. Chen, E. Watkins Dejong, M.L. Chambers, G. Hidalgo,
Effects of oral exposure to fungicides on honey bee nutrition and virus levels, J.
Econ. Entomol. 108 (2015) 2518–2528 https://10.1093/jee/tov251, doi:10.1093/
jee/tov251.
[19] A. David, C. Botías, A. Abdul-Sada, et al., Sensitive determination of mixtures of
neonicotinoid and fungicide residues in pollen and single bumblebees using a
scaled down QuEChERS method for exposure assessment, Ana. Bioanal. Chem.
407 (2015) 8151–8162, doi:10.10 07/s0 0216- 015- 8986- 6.
[20] J. Jiménez-López, E.J. Llorent-Martínez, P. Ortega-Barrales, A. Ruiz-Medina,
Analysis of neonicotinoid pesticides in the agri-food sector: a critical assessment of the state of the art, Appl. Spectrosc. Rev. 55 (8) (2019) 613–646,
doi:10.1080/05704928.2019.1608111.
[21] E. Watabe, Review on current analytical methods with chromatographic and
nonchromatographic techniques for new generation insecticide neonicotinoids,
Insecticides - Advances in Integrated Pest Management (2012) 22, doi:10.5772/
28032.
[22] B. Giroud, S. Brucker, L. Straub, P Neumann, G.R. Williams, E. Vulliet, Tracelevel determination of two neonicotinoid insecticide residues in honey bee
royal jelly using ultra-sound assisted salting-out liquid liquid extraction followed by ultra-high-performance liquid chromatography-tandem mass spectrometry, Microchem. J. 151 (2019) 104249, doi:10.1016/j.microc.2019.104249.
[23] J. Hou, W. Xie, W.Zhang D.Hong, Y.Qian F.Li, et al., Simultaneous determination
of ten neonicotinoid insecticides and two metabolites in honey and Royal-jelly
by solid-phase extraction and liquid chromatography−tandem mass spectrometry, Food Chem. 270 (2019) 204–213, doi:10.1016/j.foodchem.2018.07.068.
[24] R. Tomšicˇ , D. Heath, E. Heath, J. Markelj, A. Kandolf Borovšak, H. Prosen, Determination of neonicotinoid pesticides in propolis with liquid chromatography coupled to tandem mass spectrometry, Molecules 25 (2020) 5870, doi:10.
3390/molecules25245870.
[25] Z. Wang, J. Chen, T. Zhan, X. He, B. Wang, Simultaneous determination of
eight neonicotinoid insecticides, fipronil and its three transformation products in sediments by continuous solvent extraction coupled with liquid
chromatography-tandem mass spectrometry, Ecotoxicol. Env. Saf. 189 (2019)
110 0 02, doi:10.1016/j.ecoenv.2019.110 0 02.
[26] P.L. Chang, M.M. Hsieh, T.C. Chiu, Recent Advances in the determination of pesticides in environmental samples by capillary electrophoresis, Int. J. Environ.
Res. Public Health 13 (2016) 409, doi:10.3390/ijerph13040409.
[27] L. Sánchez-Hernández, D. Hernández-Domínguez D, J. Bernal J, C. Neusüß,
M.T. Martín, J.L. Bernal, Capillary electrophoresis–mass spectrometry as a new
approach to analyze neonicotinoid insecticides, J Chromatogr A 1359 (2014)
317–324, doi:10.1016/j.chroma.2014.07.028.
[28] S. Zhang, X. Yang, X. Yin, C. Wang, Z. Wang, Dispersive liquid–liquid microextraction combined with sweeping micellar electrokinetic chromatography for
the determination of some neonicotinoid insecticides in cucumber samples,
Food Chem. 133 (2012) 544–545, doi:10.1016/j.foodchem.2012.01.028.
[29] G.H. Chen, J. Sun, Y.J. Dai, M. Dong, Determination of nicotinyl pesticide
residues in vegetables by micellar electrokinetic capillary chromatography
with quantum dot indirect laser-induced fluorescence, Electrophoresis 33
(2012) 2192–2196, doi:10.10 02/elps.20120 0 043.
[30] L. Carbonell-Rozas, F.J. Lara, M. del Olmo Iruela, A.M. García-Campa, Micellar electrokinetic chromatography as efficient alternative for the multiresidue
determination of seven neonicotinoids and 6-chloronicotinic acid in envi-
Declaration of Competing Interest
The authors declare that they have no known competing financial interests or personal relationships that could have appeared to
influence the work reported in this paper.
CRediT authorship contribution statement
Laura Carbonell-Rozas: Conceptualization, Investigation,
Methodology, Writing – review & editing. Burkhard Horstkotte:
Formal analysis, Methodology. Ana M. García-Campa: Supervision, Project administration. Francisco J. Lara: Conceptualization,
Supervision, Writing – review & editing.
Acknowledgments
Projects (EQC2018-004453-P and RTI2018-097043-B-I00) financed by MCIN/AEI /10.13039/50110 0 011033/ FEDER “Una manera de hacer Europa” and Junta de Andalucía-Programa Operativo FEDER (B-AGR-202-UGR20). Spanish Network of Excellence
in Sample preparation (RED2018-102522-T) financed by MCIN/AEI
/10.13039/50110 0 011033. B.H. is thankful for the support via
the project EFSA-CDN (No. CZ.02.1.01/0.0/0.0/16_019/0 0 0 0841) cofunded by ERDF and an Erasmus+ scholarship. LCR gratefully acknowledges Francisco Gerardo C.M and Pasión R.S for their technical support during sampling stage. Funding for open access charge:
Universidad de Granada/CBUA.
Supplementary materials
Supplementary material associated with this article can be
found, in the online version, at doi:10.1016/j.chroma.2022.463023.
References
[1] J.P. Van der Sluijs, N. Simon-Delso, D. Goulson, L. Maxim, J.M. Bonmatin,
L.P. Belzunces, Neonicotinoids, bee disorders and the sustainability of pollinator services, Curr. Opin. Environ. Sustain 5 (2013) 293–305, doi:10.1016/j.
cosust.2013.05.007.
[2] M. Ihara, M. Matsuda, Neonicotinoids: molecular mechanisms of action, insights into resistance and impact on pollinators, Curr. Opin. Insect Sci. 30
(2018) 86–92, doi:10.1016/j.cois.2018.09.009.
[3] K.M. Kasiotis, C. Anagnostopoulos, P. Anastasiadou, K. Machera, Pesticide
residues in honeybees, honey and bee pollen by LC–MS/MS screening: Reported death incidents in honeybees, Sci. Total Environ. 485–486 (2014) 633–
642, doi:10.1016/J.SCITOTENV.2014.03.042.
[4] A.A. Kundoo, S.A. Dar, M. Mushtaq, Z. Bashir, M.S. Dar, S. Gul, M.T. Ali,
S. Gulzar, Role of neonicotinoids in insect pest management: a review, J. Entomol. Zool. Stud. 6 (2018) 333–339.
[5] T. Blacquière, G. Smagghe, C.A.M. van Gestel, V. Mommaerts, Neonicotinoids in
bees: A review on concentrations, side-effects and risk assessment, Ecotoxicology 21 (2012) 973–992, doi:10.1007/s10646- 012- 0863- x.
[6] N. Simon-Delso, V. Amaral-Rogers, L.P. Belzunces, J.M. Bonmatin, M. Chagnon,
et al., Systemic insecticides (neonicotinoids and fipronil): trends, uses, mode of
action and metabolites, Environ. Sci. Pollut. Res. 22 (2015) 5–34, doi:10.1007/
s11356- 014- 3470- y.
[7] Y. Tao, C. Jia, J. Junjie, M. Zhao, P. Yu, M. He, L. Chen, E. Zhao, Uptake, translocation, and biotransformation of neonicotinoid imidaclothiz in hydroponic vegetables: Implications for potential intake risks, J.Agric.Food Chem. 69 (2021)
4064–4073, doi:10.1021/acs.jafc.0c07006.
9
L. Carbonell-Rozas, B. Horstkotte, A.M. García-Campa et al.
[31]
[32]
[33]
[34]
[35]
Journal of Chromatography A 1672 (2022) 463023
ronmental samples, Anal. Bional. Chem. 412 (2019) 6231–6240, doi:10.1007/
s00216- 019- 02233- y.
G. Ettiene, R. Bauza, A.M.Contento M.R.Plata, A. Ríos, Determination of neonicotinoid insecticides in environmental samples by micellar electrokinetic chromatography using solid-phase treatments, Electrophoresis 33 (2012) 2969–
2977, doi:10.10 02/elps.20120 0241.
D. Moreno-Gonzalez, J.S. Torano, L. Gámiz-Gracia, A.M. Garcia-Campaña, G.J. de
Jong, G.W. Somsen, Micellar electrokinetic chromatography-electrospray ionization mass spectrometry employing a volatile surfactant for the analysis of
amino acids in human urine, Electrophoresis 34 (2013) 2615–2622, doi:10.
10 02/elps.20130 0247.
D. Moreno-González, L. Gámiz-Gracia, J.M. Bosque-Sendra, A.M. GarcíaCampa, Dispersive liquid–liquid microextraction using a low density extraction solvent for the determination of 17 N-methylcarbamates by micellar electrokinetic chromatography–electrospray–mass spectrometry employing
a volatile surfactant, J Chromatogr A 1247 (2012) 26–34, doi:10.1016/j.chroma.
2012.05.048.
D. Moreno-González, J.F. Huertas-Pérez, A.M. García-Campa, L. Gámiz-Gracia,
Vortex-assisted surfactant-enhanced emulsification liquid–liquid microextraction for the determination of carbamates in juices by micellar electrokinetic chromatography tandem mass spectrometry, Talanta 139 (2015) 174–180,
doi:10.1016/j.talanta.2015.02.057.
C. Tejada-Casado, D. Moreno-González, M. del Olmo-Iruela, A.M. GarcíaCampa, F.J. Lara, Coupling sweeping-micellar electrokinetic chromatography
with tandem mass spectrometry for the therapeutic monitoring of benzimidazoles in animal urine by dilute and shoot, Talanta 175 (2017) 542–549,
doi:10.1016/j.talanta.2017.07.080.
[36] X. Tu, W. Chen, Overview of analytical methods for the determination of neonicotinoid pesticides in honeybee products and honeybee, Crit. Rev. Anal. Chem.
51 (2021) 329–338 doi:10.1080/10408347.2020.1728516.
[37] P. Kubalczyk, E. Bald, Methods of Analyte Concentration in a Capillary, in:
B. Buszewski, E. Dziubakiewicz, M. Szumski (Eds.), Electromigration Techniques. Springer Series in Chemical Physics, vol 105, Springer, Berlin, Heidelberg, 2013, doi:10.1007/978- 3- 642- 35043- 6_12.
[38] M.C. Breadmore, W. Grochocki, U. Kalsoom, M.N. Alves, S.C. Phung, M.T. Rokh,
et al., Recent advances in enhancing the sensitivity of electrophoresis and electrochromatography in capillaries and microchips (2016-2018), Electrophoresis
40 (2019) 17–39, doi:10.10 02/elps.20180 0384.
[39] D. Moreno-González, J. Alcántara-Durán, B. Gilbert-López, M. Beneito-Cambra,
V.M. Cutillas, et al., Sensitive detection of neonicotinoid insecticides and other
selected pesticides in pollen and nectar using nanoflow liquid chromatography
orbitrap tandem mass spectrometry, J. AOAC Int. 101 (2018) 367–373, doi:10.
5740/jaoacint.17-0412.
[40] C. Botías, A. David, J. Horwood, A. Abdul-Sada, E.Hill E.Nicholls, D. Goulson, Neonicotinoid residues in wildflowers, a potential route of chronic exposure for bees, Environ.Sci. Technol. 49 (2015) 12731–12740, doi:10.1021/acs.est.
5b03459.
[41] Commission Decision, (2021/808) of 22 March 2021 on the performance of
analytical methods for residues of pharmacologically active substances used
in food-producing animals and on the interpretation of results as well as on
the methods to be used for sampling and repealing Decisions 2002/657/EC
and 98/179/EC, Official Journal European Union 180 (2021) 84–109 http://data.
europa.eu/eli/reg_impl/2021/808/oj. accessed on 20 November.
10