Báo cáo khoa học: "Dependency-based Evaluation for Automatic Summaries" pot
Bạn đang xem bản rút gọn của tài liệu. Xem và tải ngay bản đầy đủ của tài liệu tại đây (136.48 KB, 9 trang )
Proceedings of the 47th Annual Meeting of the ACL and the 4th IJCNLP of the AFNLP, pages 190–198,
Suntec, Singapore, 2-7 August 2009.
c
2009 ACL and AFNLP
DEPEVAL(summ): Dependency-based Evaluation for Automatic
Summaries
Karolina Owczarzak
Information Access Division
National Institute of Standards and Technology
Gaithersburg, MD 20899
Abstract
This paper presents DEPEVAL(summ),
a dependency-based metric for automatic
evaluation of summaries. Using a rerank-
ing parser and a Lexical-Functional Gram-
mar (LFG) annotation, we produce a
set of dependency triples for each sum-
mary. The dependency set for each
candidate summary is then automatically
compared against dependencies generated
from model summaries. We examine a
number of variations of the method, in-
cluding the addition of WordNet, par-
tial matching, or removing relation la-
bels from the dependencies. In a test
on TAC 2008 and DUC 2007 data, DE-
PEVAL(summ) achieves comparable or
higher correlations with human judg-
ments than the popular evaluation metrics
ROUGE and Basic Elements (BE).
1 Introduction
Evaluation is a crucial component in the area of
automatic summarization; it is used both to rank
multiple participant systems in shared summariza-
tion tasks, such as the Summarization track at Text
Analysis Conference (TAC) 2008 and its Docu-
ment Understanding Conference (DUC) predeces-
sors, and to provide feedback to developers whose
goal is to improve their summarization systems.
However, manual evaluation of a large number
of documents necessary for a relatively unbiased
view is often unfeasible, especially in the contexts
where repeated evaluations are needed. Therefore,
there is a great need for reliable automatic metrics
that can perform evaluation in a fast and consistent
manner.
In this paper, we explore one such evaluation
metric, DEPEVAL(summ), based on the compar-
ison of Lexical-Functional Grammar (LFG) de-
pendencies between a candidate summary and
one or more model (reference) summaries. The
method is similar in nature to Basic Elements
(Hovy et al., 2005), in that it extends beyond
a simple string comparison of word sequences,
reaching instead to a deeper linguistic analysis
of the text. Both methods use hand-written ex-
traction rules to derive dependencies from con-
stituent parses produced by widely available Penn
II Treebank parsers. The difference between
DEPEVAL(summ) and BE is that in DEPE-
VAL(summ) the dependency extraction is accom-
plished through an LFG annotation of Cahill et
al. (2004) applied to the output of the reranking
parser of Charniak and Johnson (2005), whereas
in BE (in the version presented here) dependen-
cies are generated by the Minipar parser (Lin,
1995). Despite relying on a the same concept, our
approach outperforms BE in most comparisons,
and it often achieves higher correlations with hu-
man judgments than the string-matching metric
ROUGE (Lin, 2004).
A more detailed description of BE and ROUGE
is presented in Section 2, which also gives an ac-
count of manual evaluation methods employed at
TAC 2008. Section 3 gives a short introduction to
the LFG annotation. Section 4 describes in more
detail DEPEVAL(summ) and its variants. Sec-
tion 5 presents the experiment in which we com-
pared the perfomance of all three metrics on the
TAC 2008 data (consisting of 5,952 100-words
summaries) and on the DUC 2007 data (1,620
250-word summaries) and discusses the correla-
tions these metrics achieve. Finally, Section 6
presents conclusions and some directions for fu-
ture work.
2 Current practice in summary
evaluation
In the first Text Analysis Conference (TAC 2008),
as well as its predecessor, the Document Under-
standing Conference (DUC) series, the evaluation
190
of summarization tasks was conducted using both
manual and automatic methods. Since manual
evaluation is still the undisputed gold standard,
both at TAC and DUC there was much effort to
evaluate manually as much data as possible.
2.1 Manual evaluation
Manual assessment, performed by human judges,
usually centers around two main aspects of sum-
mary quality: content and form. Similarly to Ma-
chine Translation, where these two aspects are rep-
resented by the categories of Accuracy and Flu-
ency, in automatic summarization evaluation per-
formed at TAC and DUC they surface as (Content)
Responsiveness and Readability. In TAC 2008
(Dang and Owczarzak, 2008), however, Content
Responsiveness was replaced by Overall Respon-
siveness, conflating these two dimensions and re-
flecting the overall quality of the summary: the
degree to which a summary was responding to
the information need contained in the topic state-
ment, as well as its linguistic quality. A sepa-
rate Readability score was still provided, assess-
ing the fluency and structure independently of con-
tent, based on such aspects as grammaticality, non-
redundancy, referential clarity, focus, structure,
and coherence. Both Overall Responsiveness and
Readability were evaluated according to a five-
point scale, ranging from “Very Poor” to “Very
Good”.
Content was evaluated manually by NIST asses-
sors using the Pyramid framework (Passonneau et
al., 2005). In the Pyramid evaluation, assessors
first extract all possible “information nuggets”, or
Summary Content Units (SCUs) from the four
human-crafted model summaries on a given topic.
Each SCU is assigned a weight in proportion to the
number of model summaries in which it appears,
on the assumption that information which appears
in most or all human-produced model summaries
is more essential to the topic. Once all SCUs are
harvested from the model summaries, assessors
determine how many of these SCUs are present
in each of the automatic peer summaries. The
final score for an automatic summary is its total
SCU weight divided by the maximum SCU weight
available to a summary of average length (where
the average length is determined by the mean SCU
count of the model summaries for this topic).
All types of manual assessment are expensive
and time-consuming, which is why it can be rarely
provided for all submitted runs in shared tasks
such as the TAC Summarization track. It is also
not a viable tool for system developers who ide-
ally would like a fast, reliable, and above all au-
tomatic evaluation method that can be used to im-
prove their systems. The creation and testing of
automatic evaluation methods is, therefore, an im-
portant research venue, and the goal is to produce
automatic metrics that will correlate with manual
assessment as closely as possible.
2.2 Automatic evaluation
Automatic metrics, because of their relative speed,
can be applied more widely than manual evalua-
tion. In TAC 2008 Summarization track, all sub-
mitted runs were scored with the ROUGE (Lin,
2004) and Basic Elements (BE) metrics (Hovy et
al., 2005).
ROUGE is a collection of string-comparison
techniques, based on matching n-grams between
a candidate string and a reference string. The
string in question might be a single sentence (as
in the case of translation), or a set of sentences
(as in the case of summaries). The variations of
ROUGE range from matching unigrams (i.e. sin-
gle words) to matching four-grams, with or with-
out lemmatization and stopwords, with the options
of using different weights or skip-n-grams (i.e.
matching n-grams despite intervening words). The
two versions used in TAC 2008 evaluations were
ROUGE-2 and ROUGE-SU4, where ROUGE-2
calculates the proportion of matching bigrams be-
tween the candidate summary and the reference
summaries, and ROUGE-SU4 is a combination of
unigram match and skip-bigram match with skip
distance of 4 words.
BE, on the other hand, employs a certain de-
gree of linguistic analysis in the assessment pro-
cess, as it rests on comparing the “Basic Elements”
between the candidate and the reference. Basic El-
ements are syntactic in nature, and comprise the
heads of major syntactic constituents in the text
(noun, verb, adjective, etc.) and their modifiers
in a dependency relation, expressed as a triple
(head, modifier, relation type). First, the input text
is parsed with a syntactic parser, then Basic Ele-
ments are extracted from the resulting parse, and
the candidate BEs are matched against the refer-
ence BEs. In TAC 2008 and DUC 2008 evalua-
tions the BEs were extracted with Minipar (Lin,
1995). Since BE, contrary to ROUGE, does not
191
rely solely on the surface sequence of words to de-
termine similarity between summaries, but delves
into what could be called a shallow semantic struc-
ture, comprising thematic roles such as subject and
object, it is likely to notice identity of meaning
where such identity is obscured by variations in
word order. In fact, when it comes to evaluation
of automatic summaries, BE shows higher corre-
lations with human judgments than ROUGE, al-
though the difference is not large enough to be
statistically significant. In the TAC 2008 evalua-
tions, BE-HM (a version of BE where the words
are stemmed and the relation type is ignored) ob-
tained a correlation of 0.911 with human assess-
ment of overall responsiveness and 0.949 with the
Pyramid score, whereas ROUGE-2 showed corre-
lations of 0.894 and 0.946, respectively.
While using dependency information is an im-
portant step towards integrating linguistic knowl-
edge into the evaluation process, there are many
ways in which this could be approached. Since
this type of evaluation processes information in
stages (constituent parser, dependency extraction,
and the method of dependency matching between
a candidate and a reference), there is potential
for variance in performance among dependency-
based evaluation metrics that use different com-
ponents. Therefore, it is interesting to compare
our method, which relies on the Charniak-Johnson
parser and the LFG annotation, with BE, which
uses Minipar to parse the input and produce de-
pendencies.
3 Lexical-Functional Grammar and the
LFG parser
The method discussed in this paper rests on the
assumptions of Lexical-Functional Grammar (Ka-
plan and Bresnan, 1982; Bresnan, 2001) (LFG). In
LFG sentence structure is represented in terms of
c(onstituent)-structure and f(unctional)-structure.
C-structure represents the word order of the sur-
face string and the hierarchical organisation of
phrases in terms of trees. F-structures are re-
cursive feature structures, representing abstract
grammatical relations such as subject, object,
oblique, adjunct, etc., approximating to predicate-
argument structure or simple logical forms. C-
structure and f-structure are related by means of
functional annotations in c-structure trees, which
describe f-structures.
While c-structure is sensitive to surface rear-
rangement of constituents, f-structure abstracts
away from (some of) the particulars of surface re-
alization. The sentences John resigned yesterday
and Yesterday, John resigned will receive differ-
ent tree representations, but identical f-structures.
The f-structure can also be described in terms of a
flat set of triples, or dependencies. In triples for-
mat, the f-structure for these two sentences is rep-
resented in 1.
(1)
subject(resign,john)
person(john,3)
number(john,sg)
tense(resign,past)
adjunct(resign,yesterday)
person(yesterday,3)
number(yesterday,sg)
Cahill et al. (2004), in their presentation of
LFG parsing resources, distinguish 32 types of
dependencies, divided into two major groups: a
group of predicate-only dependencies and non-
predicate dependencies. Predicate-only dependen-
cies are those whose path ends in a predicate-
value pair, describing grammatical relations. For
instance, in the sentence John resigned yester-
day, predicate-only dependencies would include:
subject(resign, john) and adjunct(resign, yester-
day), while non-predicate dependencies are per-
son(john,3), number(john,sg), tense(resign,past),
person(yesterday,3), num(yesterday,sg). Other
predicate-only dependencies include: apposition,
complement, open complement, coordination, de-
terminer, object, second object, oblique, second
oblique, oblique agent, possessive, quantifier, rel-
ative clause, topic, and relative clause pronoun.
The remaining non-predicate dependencies are:
adjectival degree, coordination surface form, fo-
cus, complementizer forms: if, whether, and that,
modal, verbal particle, participle, passive, pro-
noun surface form, and infinitival clause.
These 32 dependencies, produced by LFG an-
notation, and the overlap between the set of de-
pendencies derived from the candidate summary
and the reference summaries, form the basis of our
evaluation method, which we present in Section 4.
First, a summary is parsed with the Charniak-
Johnson reranking parser (Charniak and Johnson,
2005) to obtain the phrase-structure tree. Then,
a sequence of scripts annotates the output, trans-
lating the relative phrase position into f-structural
dependencies. The treebank-based LFG annota-
tion used in this paper and developed by Cahill et
al. (2004) obtains high precision and recall rates.
As reported in Cahill et al. (2008), the version of
192
the LFG parser which applies the LFG annotation
algorithm to the earlier Charniak’s parser (Char-
niak, 2000) obtains an f-score of 86.97 on the Wall
Street Journal Section 23 test set. The LFG parser
is robust as well, with coverage levels exceeding
99.9%, measured in terms of complete spanning
parse.
4 Dependency-based evaluation
Our dependency-based evaluation method, simi-
larly to BE, compares two unordered sets of de-
pendencies: one bag contains dependencies har-
vested from the candidate summary and the other
contains dependencies from one or more reference
summaries. Overlap between the candidate bag
and the reference bag is calculated in the form
of precision, recall, and the f-measure (with pre-
cision and recall equally weighted). Since for
ROUGE and BE the only reported score is recall,
we present recall results here as well, calculated as
in 2:
(2) DEPEVAL(summ) Recall =
|D
cand
|∩|D
ref
|
|D
ref
|
where D
cand
are the candidate dependencies
and D
ref
are the reference dependencies.
The dependency-based method using LFG an-
notation has been successfully employed in the
evaluation of Machine Translation (MT). In
Owczarzak (2008), the method achieves equal or
higher correlations with human judgments than
METEOR (Banerjee and Lavie, 2005), one of the
best-performing automatic MT evaluation metrics.
However, it is not clear that the method can be ap-
plied without change to the task of assessing au-
tomatic summaries; after all, the two tasks - of
summarization and translation - produce outputs
that are different in nature. In MT, the unit of
text is a sentence; text is translated, and the trans-
lation evaluated, sentence by sentence. In auto-
matic summarization, the output unit is a sum-
mary with length varying depending on task, but
which most often consists of at least several sen-
tences. This has bearing on the matching pro-
cess: with several sentences on the candidate and
reference side each, there is increased possibility
of trivial matches, such as dependencies contain-
ing function words, which might inflate the sum-
mary score even in the absence of important con-
tent. This is particularly likely if we were to em-
ploy partial matching for dependencies. Partial
matching (indicated in the result tables with the
tag pm) “splits” each predicate dependency into
two, replacing one or the other element with a
variable, e.g. for the dependency subject(resign,
John) we would obtain two partial dependencies
subject(resign, x) and subject(x, John). This pro-
cess helps circumvent some of the syntactic and
lexical variation between a candidate and a refer-
ence, and it proved very useful in MT evaluation
(Owczarzak, 2008). In summary evaluation, as
will be shown in Section 5, it leads to higher cor-
relations with human judgments only in the case
of human-produced model summaries, because al-
most any variation between two model summaries
is “legal”, i.e. either a paraphrase or another, but
equally relevant, piece of information. For au-
tomatic summaries, which are of relatively poor
quality, partial matching lowers our method’s abil-
ity to reflect human judgment, because it results in
overly generous matching in situations where the
examined information is neither a paraphrase nor
relevant.
Similarly, evaluating a summary against the
union of all references, as we do in the base-
line version of our method, increases the pool
of possible matches, but may also produce score
inflation through matching repetitive information
across models. To deal with this, we produce a
version of the score (marked in the result tables
with the tag one) that counts only one “hit” for ev-
ery dependency match, independent of how many
instances of a given dependency are present in the
comparison.
The use of WordNet
1
module (Rennie, 2000)
did not provide a great advantage (see results
tagged with wn), and sometimes even lowered our
correlations, especially in evaluation of automatic
systems. This makes sense if we take into consid-
eration that WordNet lists all possible synonyms
for all possible senses of a word, and so, given
a great number of cross-sentence comparisons in
multi-sentence summaries, there is an increased
risk of spurious matches between words which,
despite being potentially synonymous in certain
contexts, are not equivalent in the text.
Another area of concern was the potential noise
introduced by the parser and the annotation pro-
cess. Due to parsing errors, two otherwise equiv-
alent expressions might be encoded as differ-
ing sets of dependencies. In MT evaluation,
the dependency-based method can alleviate parser
1
/>193
noise by comparing n-best parses for the candidate
and the reference (Owczarzak et al., 2007), but this
is not an efficient solution for comparing multi-
sentence summaries. We have therefore attempted
to at least partially counteract this issue by remov-
ing relation labels from the dependencies (i.e. pro-
ducing dependencies of the form (resign, John) in-
stead of subject(resign, John)), which did provide
some improvement (see results tagged with norel).
Finally, we experimented with a predicate-only
version of the evaluation, where only the predi-
cate dependencies participate in the comparison,
excluding dependencies that provide purely gram-
matical information such as person, tense, or num-
ber (tagged in the results table as pred). This
move proved beneficial only in the case of system
summaries, perhaps by decreasing the number of
trivial matches, but decreased the method’s corre-
lation for model summaries, where such detailed
information might be necessary to assess the de-
gree of similarity between two human summaries.
5 Experimental results
The first question we have to ask is: which of
the manual evaluation categories do we want our
metric to imitate? It is unlikely that a single au-
tomatic measure will be able to correctly reflect
both Readability and Content Responsiveness, as
form and content are separate qualities and need
different measures. Content seems to be the more
important aspect, especially given that Readabil-
ity can be partially derived from Responsiveness
(a summary high in content cannot be very low
in readability, although some very readable sum-
maries can have little relevant content). Content
Responsiveness was provided in DUC 2007 data,
but not in TAC 2008, where the extrinsic Pyra-
mid measure was used to evaluate content. It is,
in fact, preferable to compare our metric against
the Pyramid score rather than Content Responsive-
ness, because both the Pyramid and our method
aim to measure the degree of similarity between
a candidate and a model, whereas Content Re-
sponsiveness is a direct assessment of whether the
summary’s content is adequate given a topic and
a source text. The Pyramid is, at the same time,
a costly manual evaluation method, so an auto-
matic metric that successfully emulates it would
be a useful replacement.
Another question is whether we focus on
system-level or summary-level evaluation. The
correlation values at the summary-level are gener-
ally much lower than on the system-level, which
means the metrics are better at evaluating sys-
tem performance than the quality of individual
summaries. System-level evaluations are essen-
tial to shared summarization tasks; summary-level
assessment might be useful to developers who
want to test the effect of particular improvements
in their system. Of course, the ideal evaluation
metric would show high correlations with human
judgment on both levels.
We used the data from the TAC 2008 and
DUC 2007 Summarization tracks. The first set
comprised 58 system submissions and 4 human-
produced model summaries for each of the 96 sub-
topics (there were 48 topics, each of which re-
quired two summaries: a main and an update sum-
mary), as well as human-produced Overall Re-
sponsiveness and Pyramid scores for each sum-
mary. The second set included 32 system submis-
sions and 4 human models for each of the 45 top-
ics. For fair comparison of models and systems,
we used jackknifing: while each model was evalu-
ated against the remaining three models, each sys-
tem summary was evaluated four times, each time
against a different set of three models, and the four
scores were averaged.
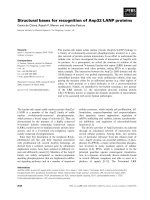
5.1 System-level correlations
Table 1 presents system-level Pearson’s cor-
relations between the scores provided by our
dependency-based metric DEPEVAL(summ),
as well as the automatic metrics ROUGE-2,
ROUGE-SU4, and BE-HM used in the TAC
evaluation, and the manual Pyramid scores, which
measured the content quality of the systems.
It also includes correlations with the manual
Overall Responsiveness score, which reflected
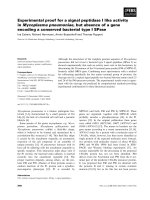
both content and linguistic quality. Table 3 shows
the correlations with Content Responsiveness
for DUC 2007 data for ROUGE, BE, and those
few select versions of DEPEVAL(summ) which
achieve optimal results on TAC 2008 data (for
a more detailed discussion of the selection see
Section 6).
The correlations are listed for the following ver-
sions of our method: pm - partial matching for
dependencies; wn - WordNet; pred - matching
predicate-only dependencies; norel - ignoring de-
pendency relation label; one - counting a match
only once irrespective of how many instances of
194
TAC 2008 Pyramid Overall Responsiveness
Metric models systems models systems
DEPEVAL(summ): Variations
base 0.653 0.931 0.883 0.862
pm 0.690 0.811 0.943 0.740
wn
0.687 0.929 0.888 0.860
pred 0.415 0.946 0.706 0.909
norel 0.676 0.929 0.880 0.861
one 0.585 0.958* 0.858 0.900
DEPEVAL(summ): Combinations
pm wn 0.694 0.903 0.952* 0.839
pm pred 0.534 0.880 0.898 0.831
pm norel 0.722 0.907 0.936 0.835
pm one 0.611 0.950 0.876 0.895
wn pred 0.374 0.946 0.716 0.912
wn norel 0.405 0.941 0.752 0.905
wn one 0.611 0.952 0.856 0.897
pred norel 0.415 0.945 0.735 0.905
pred one 0.415 0.953 0.721 0.921*
norel one 0.600 0.958* 0.863 0.900
pm wn pred 0.527 0.870 0.905 0.821
pm wn norel 0.738 0.897 0.931 0.826
pm wn one 0.634 0.936 0.887 0.881
pm pred norel 0.642 0.876 0.946 0.815
pm pred one 0.504 0.948 0.817 0.907
pm norel one 0.725 0.941 0.905 0.880
wn pred norel 0.433 0.944 0.764 0.906
wn pred one 0.385 0.950 0.722 0.919
wn norel one 0.632 0.954 0.872 0.896
pred norel one 0.452 0.955 0.756 0.919
pm wn pred norel
0.643 0.861 0.940 0.800
pm wn pred one 0.486 0.932 0.809 0.890
pm pred norel one
0.711 0.939 0.881 0.891
pm wn norel one 0.743* 0.930 0.902 0.870
wn pred norel one 0.467 0.950 0.767 0.918
pm wn pred norel one 0.712 0.927 0.887 0.880
Other metrics
ROUGE-2 0.277 0.946 0.725 0.894
ROUGE-SU4 0.457 0.928 0.866 0.874
BE-HM 0.423 0.949 0.656 0.911
Table 1: System-level Pearson’s correlation between auto-
matic and manual evaluation metrics for TAC 2008 data.
a particular dependency are present in the candi-
date and reference. For each of the metrics, in-
cluding ROUGE and BE, we present the correla-
tions for recall. The highest result in each category
is marked by an asterisk. The background gradi-
ent indicates whether DEPEVAL(summ) correla-
tion is higher than all three competitors ROUGE-
2, ROUGE-SU4, and BE (darkest grey), two of the
three (medium grey), one of the three (light grey),
or none (white). The 95% confidence intervals are
not included here for reasons of space, but their
comparison suggests that none of the system-level
differences in correlation levels are large enough
to be significant. This is because the intervals
themselves are very wide, due to relatively small
number of summarizers (58 automatic and 8 hu-
man for TAC; 32 automatic and 10 human for
DUC) involved in the comparison.
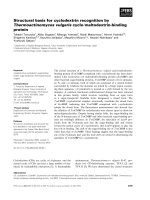
5.2 Summary-level correlations
Tables 2 and 4 present the same correlations,
but this time on the level of individual sum-
maries. As before, the highest level in each
category is marked by an asterisk. Contrary to
system-level, here some correlations obtained by
DEPEVAL(summ) are significantly higher than
those achieved by the three competing metrics,
ROUGE-2, ROUGE-SU4, and BE-HM, as de-
termined by the confidence intervals. The let-
ters in parenthesis indicate that a given DEPE-
VAL(summ) variant is significantly better at cor-
relating with human judgment than ROUGE-2 (=
R2), ROUGE-SU4 (= R4), or BE-HM (= B).
6 Discussion and future work
It is obvious that none of the versions performs
best across the board; their different character-
istics might render them better suited either for
models or for automatic systems, but not for
both at the same time. This can be explained if
we understand that evaluating human gold stan-
dard summaries and automatically generated sum-
maries of poor-to-medium quality is, in a way, not
the same task. Given that human models are by
default well-formed and relevant, relaxing any re-
straints on matching between them (i.e. allowing
partial dependencies, removing the relation label,
or adding synonyms) serves, in effect, to accept as
correct either (1) the same conceptual information
expressed in different ways (where the difference
might be real or introduced by faulty parsing),
or (2) other information, yet still relevant to the
topic. Accepting information of the former type
as correct will ratchet up the score for the sum-
mary and the correlation with the summary’s Pyra-
mid score, which measures identity of information
across summaries. Accepting the first and second
type of information will raise the score and the
correlation with Responsiveness, which measures
relevance of information to the particular topic.
However, in evaluating system summaries such re-
laxation of matching constraints will result in ac-
cepting irrelevant and ungrammatical information
as correct, driving up the DEPEVAL(summ) score,
but lowering its correlation with both Pyramid and
Responsiveness. In simple words, it is okay to give
a model summary “the benefit of doubt”, and ac-
cept its content as correct even if it is not match-
ing other model summaries exactly, but the same
strategy applied to a system summary might cause
mass over-estimation of the summary’s quality.
This substantial difference in the nature of
human-generated models and system-produced
summaries has impact on all automatic means of
evaluation, as long as we are limited to methods
that operate on more shallow levels than a full
195
TAC 2008 Pyramid Overall Responsiveness
Metric models systems models systems
DEPEVAL(summ): Variations
base 0.436 (B) 0.595 (R2,R4,B) 0.186 0.373 (R2,B)
pm 0.467 (B) 0.584 (R2,B) 0.183 0.368 (B)
wn
0.448 (B) 0.592 (R2,B) 0.192 0.376 (R2,R4,B)
pred 0.344 0.543 (B) 0.170 0.327
norel 0.437 (B) 0.596* (R2,R4,B) 0.186 0.373 (R2,B)
one 0.396 0.587 (R2,B) 0.171 0.376 (R2,R4,B)
DEPEVAL(summ): Combinations
pm wn 0.474 (B) 0.577 (R2,B) 0.194* 0.371 (R2,B)
pm pred 0.407 0.537 (B) 0.153 0.337
pm norel 0.483 (R2,B) 0.584 (R2,B) 0.168 0.362
pm one 0.402 0.577 (R2,B) 0.167 0.384 (R2,R4,B)
wn pred 0.352 0.537 (B) 0.182 0.328
wn norel 0.364 0.541 (B) 0.187 0.329
wn one 0.411 0.581 (R2,B) 0.182 0.384 (R2,R4,B)
pred norel 0.351 0.547 (B) 0.169 0.327
pred one 0.325 0.542 (B) 0.171 0.347
norel one 0.403 0.589 (R2,B) 0.176 0.377 (R2,R4,B)
pm wn pred 0.415 0.526 (B) 0.167 0.337
pm wn norel 0.488* (R2,R4,B) 0.576 (R2,B) 0.168 0.366 (B)
pm wn one 0.417 0.563 (B) 0.179 0.389* (R2,R4.B)
pm pred norel 0.433 (B) 0.538 (B) 0.124 0.333
pm pred one 0.357 0.545 (B) 0.151 0.381 (R2,R4,B)
pm norel one 0.437 (B) 0.567 (R2,B) 0.174 0.369 (B)
wn pred norel 0.353 0.541 (B) 0.180 0.324
wn pred one 0.328 0.535 (B) 0.179 0.346
wn norel one 0.416 0.584 (R2,B) 0.185 0.385 (R2,R4,B)
pred norel one 0.336 0.549 (B) 0.169 0.351
pm wn pred norel
0.428 (B) 0.524 (B) 0.120 0.334
pm wn pred one 0.363 0.525 (B) 0.164 0.380 (R2,R4,B)
pm pred norel one
0.420 (B) 0.533 (B) 0.154 0.375 (R2,R4,B)
pm wn norel one 0.452 (B) 0.558 (B) 0.179 0.376 (R2,R4,B)
wn pred norel one 0.338 0.544 (B) 0.178 0.349
pm wn pred norel one 0.427 (B) 0.522 (B) 0.153 0.379 (R2,R4,B)
Other metrics
ROUGE-2 0.307 0.527 0.098 0.323
ROUGE-SU4 0.318 0.557 0.153 0.327
BE-HM 0.239 0.456 0.135 0.317
Table 2: Summary-level Pearson’s correlation between automatic and manual
evaluation metrics for TAC 2008 data.
DUC 2007 Content Responsiveness
Metric models systems
DEPEVAL(summ) 0.7341 0.8429
DEPEVAL(summ) wn 0.7355 0.8354
DEPEVAL(summ) norel 0.7394 0.8277
DEPEVAL(summ) one
0.7507 0.8634
ROUGE-2 0.4077 0.8772
ROUGE-SU4 0.2533 0.8297
BE-HM 0.5471 0.8608
Table 3: System-level Pearson’s correlation
between automatic metrics and Content Respon-
siveness for DUC 2007 data. For model sum-
maries, only DEPEVAL correlations are signif-
icant (the 95% confidence interval does not in-
clude zero). None of the differences between
metrics are significant at the 95% level.
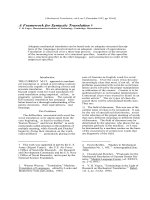
DUC 2007 Content Responsiveness
Metric models systems
DEPEVAL(summ) 0.2059 0.4150
DEPEVAL(summ) wn 0.2081 0.4178
DEPEVAL(summ) norel 0.2119 0.4185
DEPEVAL(summ) one
0.1999 0.4101
ROUGE-2 0.1501 0.3875
ROUGE-SU4 0.1397 0.4264
BE-HM 0.1330 0.3722
Table 4: Summary-level Pearson’s correlation
between automatic metrics and Content Respon-
siveness for DUC 2007 data. ROUGE-SU4 and
BE correlations for model summaries are not
statistically significant. None of the differences
between metrics are significant at the 95% level.
semantic and pragmatic analysis against human-
level world knowledge. The problem is twofold:
first, our automatic metrics measure identity rather
than quality. Similarity of content between a can-
didate summary and one or more references is act-
ing as a proxy measure for the quality of the can-
didate summary; yet, we cannot forget that the re-
lation between these two features is not purely lin-
ear. A candidate highly similar to the reference
will be, necessarily, of good quality, but a candi-
date which is dissimilar from a reference is not
necessarily of low quality (vide the case of par-
allel model summaries, which almost always con-
tain some non-overlapping information).
The second problem is the extent to which our
metrics are able to distinguish content through
the veil of differing forms. Synonyms, para-
phrases, or pragmatic features such as the choice
of topic and focus render simple string-matching
techniques ineffective, especially in the area of
summarization where the evaluation happens on
a supra-sentential level. As a result, then, a lot
of effort was put into developing metrics that
can identify similar content despite non-similar
form, which naturally led to the application of
linguistically-oriented approaches that look be-
yond surface word order.
Essentially, though, we are using imperfect
measures of similarity as an imperfect stand-in for
quality, and the accumulated noise often causes
a divergence in our metrics’ performance with
model and system summaries. Much like the in-
verse relation of precision and recall, changes and
additions that improve a metric’s correlation with
human scores for model summaries often weaken
the correlation for system summaries, and vice
versa. Admittedly, we could just ignore this prob-
lem and focus on increasing correlations for auto-
matic summaries only; after all, the whole point
of creating evaluation metrics is to score and rank
the output of systems. Such a perspective can be
rather short-sighted, though, given that we expect
continuous improvement from the summarization
systems to, ideally, human levels, so the same is-
sues which now prevent high correlations for mod-
els will start surfacing in evaluation of system-
produced summaries as well. Using metrics that
only perform reliably for low-quality summaries
might prevent us from noticing when those sum-
maries become better. Our goal should be, there-
fore, to develop a metric which obtains high cor-
relations in both categories, with the assumption
that such a metric will be more reliable in evaluat-
ing summaries of varying quality.
196
Since there is no single winner among all 32
variants of DEPEVAL(summ) on TAC 2008 data,
we must decide which of the categories is most im-
portant to a successful automatic evaluation met-
ric. Correlations with Overall Responsiveness are
in general lower than those with the Pyramid score
(except in the case of system-level models). This
makes sense, if we rememeber that Overall Re-
sponsiveness judges content as well as linguistic
quality, which are two different dimensions and so
a single automatic metric is unlikely to reflect it
well, and that it judges content in terms of its rel-
evance to topic, which is also beyond the reach
of contemporary metrics which can at most judge
content similarity to a model. This means that the
Pyramid score makes for a more relevant metric to
emulate.
The last dilemma is whether we choose to focus
on system- or summary-level correlations. This
ties in with the purpose which the evaluation met-
ric should serve. In comparisons of multiple sys-
tems, such as in TAC 2008, the value is placed
in the correct ordering of these systems; while
summary-level assessment can give us important
feedback and insight during the system develop-
ment stage.
The final choice among all DEPEVAL(summ)
versions hinges on all of these factors: we should
prefer a variant which correlates highly with the
Pyramid score rather than with Responsiveness,
which minimizes the gap between model and au-
tomatic peer correlations while retaining relatively
high values for both, and which fulfills these re-
quirements similarly well on both summary- and
system-levels. Three such variants are the base-
line DEPEVAL(summ), the WordNet version DE-
PEVAL(summ) wn, and the version with removed
relation labels DEPEVAL(summ) norel. Both the
baseline and norel versions achieve significant im-
provement over ROUGE and BE in correlations
with the Pyramid score for automatic summaries,
and over BE for models, on the summary level. In
fact, almost in all categories they achieve higher
correlations than ROUGE and BE. The only ex-
ceptions are the correlations with Pyramid for sys-
tems at the system-level, but there the results are
close and none of the differences in that category
are significant. To balance this exception, DE-
PEVAL(summ) achieves much higher correlations
with the Pyramid scores for model summaries than
either ROUGE or BE on the system level.
In order to see whether the DEPEVAL(summ)
advantage holds for other data, we examined the
most optimal versions (baseline, wn, norel, as
well as one, which is the closest counterpart
to label-free BE-HM) on data from DUC 2007.
Because only a portion of the DUC 2007 data
was evaluated with Pyramid, we chose to look
rather at the Content Responsiveness scores. As
can be seen in Tables 3 and 4, the same pat-
terns hold: decided advantage over ROUGE/BE
when it comes to model summaries (especially
at system-level), comparable results for automatic
summaries. Since DUC 2007 data consisted of
fewer summaries (1,620 vs 5,952 at TAC) and
fewer submissions (32 vs 57 at TAC), some results
did not reach statistical significance. In Table 3, in
the models category, only DEPEVAL(summ) cor-
relations are significant. In Table 4, in the model
category, only DEPEVAL(summ) and ROUGE-2
correlations are significant. Note also that these
correlations with Content Responsiveness are gen-
erally lower than those with Pyramid in previous
tables, but in the case of summary-level compari-
son higher than the correlations with Overall Re-
sponsiveness. This is to be expected given our
earlier discussion of the differences in what these
metrics measure.
As mentioned before, the dependency-based
evaluation can be approached from different an-
gles, leading to differences in performance. This
is exemplified in our experiment, where DEPE-
VAL(summ) outperforms BE, even though both
these metrics rest on the same general idea. The
new implementation of BE presented at the TAC
2008 workshop (Tratz and Hovy, 2008) introduces
transformations for dependencies in order to in-
crease the number of matches among elements that
are semantically similar yet differ in terms of syn-
tactic structure and/or lexical choices, and adds
WordNet for synonym matching. Its core modules
were updated as well: Minipar was replaced with
the Charniak-Johnson reranking parser (Charniak
and Johnson, 2005), Named Entity identification
was added, and the BE extraction is conducted us-
ing a set of Tregex rules (Levy and Andrew, 2006).
Since our method, presented in this paper, also
uses the reranking parser, as well as WordNet, it
would be interesting to compare both methods di-
rectly in terms of the performance of the depen-
dency extraction procedure.
197
References
Satanjeev Banerjee and Alon Lavie. 2005. METEOR:
An automatic metric for MT evaluation with im-
proved correlation with human judgments. In Pro-
ceedings of the ACL 2005 Workshop on Intrinsic and
Extrinsic Evaluation Measures for MT and/or Sum-
marization, pages 65–73, Ann Arbor, MI, USA.
Joan Bresnan. 2001. Lexical-Functional Syntax.
Blackwell, Oxford.
Aoife Cahill, Michael Burke, Ruth O’Donovan, Josef
van Genabith, and Andy Way. 2004. Long-
distance dependency resolution in automatically ac-
quired wide-coverage PCFG-based LFG approxima-
tions. In Proceedings of the 42th Annual Meeting
of the Association for Computational Linguistics,
pages 320–327, Barcelona, Spain.
Aoife Cahill, Michael Burke, Ruth O’Donovan, Stefan
Riezler, Josef van Genabith, and Andy Way. 2008.
Wide-coverage deep statistical parsing using auto-
matic dependency structure annotation. Comput.
Linguist., 34(1):81–124.
Eugene Charniak and Mark Johnson. 2005. Coarse-
to-fine n-best parsing and MaxEnt discriminative
reranking. In ACL 2005: Proceedings of the 43rd
Annual Meeting of the Association for Computa-
tional Linguistics, pages 173–180, Morristown, NJ,
USA. Association for Computational Linguistics.
Eugene Charniak. 2000. A maximum entropy inspired
parser. In Proceedings of the 1st Annual Meeting of
the North American Chapter of the Association for
Computational Linguistics, pages 132–139, Seattle,
WA, USA.
Hoa Trang Dang and Karolina Owczarzak. 2008.
Overview of the tac 2008 summarization track: Up-
date task. In to appear in: Proceedings of the 1st
Text Analysis Conference (TAC).
Eduard Hovy, Chin-Yew Lin, and Liang Zhou. 2005.
Evaluating DUC 2005 using Basic Elements. In
Proceedings of the 5th Document Understanding
Conference (DUC).
Ronald M. Kaplan and Joan Bresnan, 1982. The Men-
tal Representation of Grammatical Relations, chap-
ter Lexical-functional Grammar: A Formal System
for Grammatical Representation. MIT Press, Cam-
bridge, MA, USA.
Roger Levy and Galen Andrew. 2006. Tregex and tsur-
geon: Tools for querying and manipulating tree data
structures. In Proceedings of the 5th International
Conference on Language Resources and Evaluation.
Dekang Lin. 1995. A dependency-based method for
evaluating broad-coverage parsers. In Proceedings
of the 14th International Joint Conference on Artifi-
cial Intelligence, pages 1420–1427.
Chin-Yew Lin. 2004. ROUGE: A package for au-
tomatic evaluation of summaries. In Proceedings
of the ACL 2004 Workshop: Text Summarization
Branches Out, pages 74–81.
Karolina Owczarzak, Josef van Genabith, and Andy
Way. 2007. Evaluating Machine Translation with
LFG dependencies. Machine Translation, 21(2):95–
119.
Karolina Owczarzak. 2008. A novel dependency-
based evaluation metric for Machine Translation.
Ph.D. thesis, Dublin City University.
Rebecca J. Passonneau, Ani Nenkova, Kathleen McK-
eown, and Sergey Sigelman. 2005. Applying
the Pyramid method in DUC 2005. In Proceed-
ings of the 5th Document Understanding Conference
(DUC).
Jason Rennie. 2000. Wordnet::querydata: a
Perl module for accessing the WordNet database.
jrennie/WordNet.
Stephen Tratz and Eduard Hovy. 2008. Summariza-
tion evaluation using transformed Basic Elements.
In Proceedings of the 1st Text Analysis Conference
(TAC).
198