Identification and characterization of single nucleotide polymorphisms in 12 chicken growthcorrelated genes by denaturing high performance liquid chromatography
Bạn đang xem bản rút gọn của tài liệu. Xem và tải ngay bản đầy đủ của tài liệu tại đây (1.28 MB, 22 trang )
339
Genet. Sel. Evol. 37 (2005) 339–360
c INRA, EDP Sciences, 2005
DOI: 10.1051/gse:2005005
Original article
Identification and characterization of single
nucleotide polymorphisms in 12 chicken
growth-correlated genes by denaturing high
performance liquid chromatography
Qinghua Na , Mingming La , Jianhua Oa,b , Hua Za ,
Guanfu Ya , Xiquan Za∗
a
Department of Animal Genetics, Breeding and Reproduction, College of Animal Science,
South China Agricultural University, Guangzhou 510642, China
b
College of Animal Science and Technology, Jiangxi Agricultural University,
Nanchang 330045, China
(Received 6 May 2004; accepted 17 December 2004)
Abstract – The genes that are part of the somatotropic axis play a crucial role in the regulation
of growth and development of chickens. The identification of genetic polymorphisms in these
genes will enable the scientist to evaluate the biological relevance of such polymorphisms and
to gain a better understanding of quantitative traits like growth. In the present study, 75 pairs
of primers were designed and four chicken breeds, significantly differing in growth and reproduction characteristics, were used to identify single nucleotide polymorphisms (SNP) using the
denaturing high performance liquid chromatography (DHPLC) technology. A total of 283 SNP
were discovered in 31 897 base pairs (bp) from 12 genes of the growth hormone (GH), growth
hormone receptor (GHR), ghrelin, growth hormone secretagogue receptor (GHSR), insulin-like
growth factor I and II (IGF-I and -II), insulin-like growth factor binding protein 2 (IGFBP-2),
insulin, leptin receptor (LEPR), pituitary-specific transcription factor-1 (PIT-1), somatostatin
(SS), thyroid-stimulating hormone beta subunit (TSH-β). The observed average distances in bp
between the SNP in the 5’UTR, coding regions (non- and synonymous), introns and 3’UTR
were 172, 151 (473 and 222), 89 and 141 respectively. Fifteen non-synonymous SNP altered
the translated precursors or mature proteins of GH, GHR, ghrelin, IGFBP-2, PIT-1 and SS. Fifteen indels of no less than 2 bps and 2 poly (A) polymorphisms were also observed in 9 genes.
Fifty-nine PCR-RFLP markers were found in 11 genes. The SNP discovered in this study provided suitable markers for association studies of candidate genes for growth related traits in
chickens.
chickens / genes / SNP / DHPLC
∗
Corresponding author:
340
Q. Nie et al.
1. INTRODUCTION
Several quantitative traits for production such as growth, egg laying, feed
conversion, carcass weight and body weight at different day-ages are important in domestic animals. These traits are controlled by genetic factors, also
called quantitative trait loci (QTL). Progress has been made in mapping QTL
for production traits by using microsatellite markers [29–31, 36, 38, 39], but
fine mapping of QTL requires a much higher density of informative genetic
markers. Due to the apparent lower complexity of the chicken, as compared to
mammalian genomes, there seems to be lower numbers of microsatellite DNA
markers present in the genome.
SNP are a new type of DNA polymorphism, mostly bi-allelic, but widely
distributed along the chicken genome [40]. In humans, several high resolution SNP maps have been created for several chromosomes or even the whole
genome, providing useful resources for studies on haplotypes associated with
human diseases [2, 23, 28]. Furthermore, an SNP map of porcine chromosome
2 has been reported [18], however such studies have not been performed in the
chicken yet. Nevertheless the results of the Chicken Genome Project, which
ended in February of 2004, ( enable
the utilization of the draft sequence to identify SNP.
The candidate gene approach is an interesting way to study QTL affecting traits in chickens. As in mammals, the growth and development of chickens are primarily regulated by the somatotropic axis. The somatotropic axis,
also named neurocrine axis or hypothalamus-pituitary growth axis, consists
of essential compounds such as growth hormone (GH), growth hormone releasing hormone (GHRH), insulin-like growth factors (IGF-I and -II), somatostatin (SS), their associated carrier proteins and receptors, and other hormones
like insulin, leptin and glucocorticoids or thyroid hormones [7,26]. SNP markers in genes for this network could function as candidate genes for the evaluation of their effects on chicken growth traits [5].
Previous studies have shown that some SNP of the somatotropic axis genes
indeed affected (economic) traits or diseases either in domestic animals or
in humans [7, 26]. In chickens, certain SNP of GH [11], GHR [11, 12],
IGF-I and -II genes [3, 41] have been reported to be associated with chicken
growth, feeding and egg laying traits. The SNP in the porcine pituitaryspecific transcription factor-1 (PIT-1) gene are also significantly related to
carcass traits [33]. In humans, point mutations in ghrelin, PIT-1 and thyroidstimulating hormone beta subunit (TSH-β) genes have significant relationships
with obesity [37], congenital hypothyroidism or pituitary dwarfism [4,27], and
TSH-deficiency hypothyroidism [9], respectively. Until now, only limited SNP
Single nucleotide polymorphisms of 12 chicken genes
341
have been identified in these and other important genes of the chicken somatotropic axis. In part because the sequence of these genes was unknown, and
since few efficient methods are available to identify SNP in chromosomal regions spanning 100 kb or even 1 Mb.
The present study was conducted to identify SNP in the complete sequences
of 12 chicken genes of the somatotropic axis in four chicken populations that
were significantly different in growth and reproduction characteristics. The
12 selected genes are GH, GHR, ghrelin, growth hormone secretagogue receptor (GHSR), IGF-I and -II, insulin-like growth factor binding protein 2
(IGFBP-2), insulin, leptin receptor (LEPR), PIT-1, SS, TSH-β. The sequences
were obtained from Genbank [25] and were used to design gene specific
primers for the identification of SNP. Denaturing high-performance liquid
chromatography (DHPLC) was used to identify SNP because it is an efficient
way for screening sequence variation. The SNP identified with DHPLC were
also confirmed by direct sequencing. In addition, the possible effects of these
SNP on growth and laying traits were analysed. Potential PCR-RFLP markers
were also deduced when looking for restriction sites within sequences explored
for SNP.
2. MATERIALS AND METHODS
2.1. Chicken populations
Four chicken breeds with different growth-rates, morphological characteristics, and laying were used in this study: Leghorn (L), White Recessive Rock
(WRR), Taihe Silkies (TS) and Xinghua (X). Genomic DNA of 10 animals
per breed were isolated from the blood. The Leghorn is a layer breed and has
been bred as a laying-type for dozens of years, whereas WRR is a fast-growing
broiler line that has also been bred as a meat-type for many generations. Both
TS and X chickens are Chinese native breeds with the characteristics of being slow-growing, and having lower reproduction and favorable meat quality.
They have not been subjected to dedicated or intensive breeding programs.
2.2. Primer design and PCR amplification
The sequences of the 12 chicken candidate genes of the somatotropic
axis are obtained from Genbank (). The accession
numbers are given in Table I. Primers were designed using the GENETOOL
program ( />
342
Q. Nie et al.
Table I. Details of 75 pairs of primers used for SNP identification in the 12 selected
candidate genes.
Primer
101
102
103
104
105
106
107
108
109
201
202
203
204
205
206
207
208
209
210
211
701
Nucleotide constitutes
Forward primer (5’-3’) / Reverse
primer (5’-3’)
GH
gccctggcagccctgttaacc /
caccccaccatcgtatcccatc
GH
atgggatacgatggtggggtgt /
ccttcctgagcagagcacggtac
GH
cgcgccaaagagtgtaccgtg /
gcacggtcctggaggcatcaag
GH
gggctcagcacctccacctcct /
cgcagcctgggagtttttgttgg
GH
tcccaggctgcgttttgttactc /
acgggggtgagccaggactg
GH
gctgcttcggttttcactggttc /
gcccaaccccaacccactcc
GH
gcgggagtgggttggggttg /
ggggcctctgagatcatggaacc
GH
cccaacagtgccacgattccatg /
tgcgcaggtggatgtcgaacttg
GH
ccgcagccctctcgtcccacag /
cgccccgaacccgccctatat
GHR
cccttccattatgcattttatc /
gggggtacactctagtcacttg
GHR
gcaacatcagaatcgctttt /
tcccatcgtacttgaatatcc
GHR
tcacctgagctggagacattt /
ctgcctctgaattcctccact
GHR
gaacccaggctctcaacagtg /
tggaggttgaggtttatctgtc
GHR
tgccaacacagatacccaacagc /
cgcggctcatcctcttcctgt
GHR
ctccagggcagaaatccaaggtg /
gcacccaacccaagctgactctg
GHR
tgctgaaacccaaaatgagg /
tttcatgctcagttcccaattac
GHR
attgggaactgagcatgaaag /
aaccagaatttgatgaagaacag
GHR
tgcagcaaaaattaaaaacag /
ccgtattcaattcctgtgttt
GHR
tgaaacacaggaattgaatacg /
cgttctgaatcgtaaaaatcc
GHR
catgaatgctctctttgtgac /
gggacagatcaaagacaatac
ghrelin
catttctaagcttttgccagtt /
gcattattctgactttttacctg
Gene
Sequence
ID1
Length Temp2 Temp3
(bp)
(◦ C)
(◦ C)
AY461843
518
62
58.4
AY461843
689
65
60.4
AY461843
412
62
62.5
AY461843
546
65
60.5
AY461843
429
62
59.8
AY461843
396
68
60.0
AY461843
538
65
57.7
AY461843
483
62
61.1
AY461843
366
55
63.2
AJ506750
576
58
56.1
AJ506750
544
58
54.5
AY500876
529
60
55.8
AY468380
457
60
56.7
M74057
336
64
59.0
M74057
453
60
58.9
a
332
64
55.1
a
447
60
51.6
a
522
54
53.0
a
423
53
56.5
a
416
56
55.1
AY303688
431
55
55.2
343
Single nucleotide polymorphisms of 12 chicken genes
Table I. Continued.
Primer
Gene
702
ghrelin
703
ghrelin
704
ghrelin
705
ghrelin
706
ghrelin
707
ghrelin
1402
GHSR
1403
GHSR
1404
GHSR
1405
GHSR
1406
GHSR
1407
GHSR
1408
GHSR
301
IGF-´cñ
302
IGF-´cñ
303
IGF-´cñ
305
IGF-´cñ
306
IGF-´cñ
307
IGF-´cñ
308
IGF-´cñ
309
IGF-´cñ
Nucleotide constitutes
Forward primer (5’-3’) / Reverse
primer (5’-3’)
tctggctggctctagtttttt /
gcagatgcagcaaattagttag
ataaagtgaatgcagaatagt /
cactgttattgtcatcttctc
atttttcactcctgctcacat /
cttctccagtgcttgtccatac
gtcaagataacagaaagagagt /
tgtgtggtgggagttactac
gagcaacggaagtatctgatgt /
caggcactcaaatgaagaaag
agctttatctttcttcatttgag /
ggaaataaaataagcctacacgt
gtcgcctgcgtcctcctctt /
acgggcaggaaaaagaagatg
ctccagcatcttctttttcct /
tgtgggtttagaggttagt
cccacaaagttagctgcagac /
cacctctccatctggctcatt
ggcagaggtgaagggctaatg /
gcactgggctgttttcatatg
gcagatgaaaacagcccagtg /
catcttcctgagcccaacact
aggtggaaaaactgcaaaaag /
aggcaccccataacttttcag
tggttgaaaagagagaatgct /
ccacacgtctccttttatattc
ctgggctacttgagttactacat /
cacggaaaataagggaatg
gccacccgaaagttaaccagaat /
ttccattgcggctctatct
ggagagagagagaaggcaaatg /
agcagacaacacacagtaaaat
agaatacaagtagagggaacac /
gcaaataaaaaaacaccactt
ggagtaattcatcagccttgt /
ggccagaccctttcatataac
caagggaatagtggatgagtgct /
gcttttggcatatcagtgtgg
tgaaagggtctggccaaaaca /
gggaagagtgaaaatggcagagg
agctgttcgaatgatggtgtttt /
gccccagcattctctttcctt
Sequence
ID1
Length Temp2 Temp3
(bp)
(◦ C)
(◦ C)
AY303688
486
56
55.3
AY303688
323
55
56.1
AY303688
532
62
55.0
AY303688
354
58
57.3
AY303688
458
60
56.8
AY303688
340
58
56.5
AB095994
533
61
62.8
AB095994
523
59
57.1
AB095994
537
60
58.0
AB095994
500
69
57.9
AB095994
525
59
58
AB095994
534
59
57.2
AB095994
598
59
59.4
M74176
480
59
57.7
M74176
361
60
61.3
M74176
401
58
63.3
AY331392
457
59
55.7
AY331392
515
58
54.1
M32791
97
58
54.1
AY253744
387
62
53.3
AY253744
583
63
54.5
344
Q. Nie et al.
Table I. Continued.
Primer
Gene
310
IGF-´cđ
311
IGF-´cđ
902
IGF-´cị
903
IGF-´cị
904
IGF-´cị
811
IGFBP-2
812
IGFBP-2
813
IGFBP-2
815
IGFBP-2
816
IGFBP-2
817
IGFBP-2
818
IGFBP-2
819
IGFBP-2
820
IGFBP-2
1301
insulin
1302
insulin
1303
insulin
1304
insulin
1208
LEPR
1209
LEPR
Nucleotide constitutes
Forward primer (5’-3’) / Reverse
primer (5’-3’)
agtgctgcttttgtgatttcttg /
gctgcagtgagaacatcccttaa
atgtgaatgtgaaccaagaatact /
tccacatacgaactgaagagc
ggtagaccagtgggacgaaat /
cctttgggcaacatgacatag
gggcgagcagcaatgagtagagg /c
cggagcggcgtgatggtg
atcccactcctatgtcatgttgc /
gggaagggagaacaacacagtg
tcggtgaatgggcagcgtggag /
acggggcgaggagcaaaaaagac
tttggttgagtcctaggcttg /
aggcgtactacactgcagagg
aggcgtactacactgcagagg /
gggaaaaagggtgtgcaaaag
gggcatttatatctgaggaacac /
ggcaaagagcaacccaacac
tggcgaggcgttattttc /
gctgctttgcctgttccttagag
gggcaaccttttccagtgtgtc /
gggccacagcaagcaggac
agcccatgagcaggaggacc /
ggggacaggcaggacacaaga
ccccgagaccaaagactgtaaat /
aagcgaaaatggagggacaagag
gctgctcttgtccctccattt /
cggcggcagggaagttattt
cgtgtctcctttgcttcctac /
tggagctttctgtgacaattc
ggcaagcagggaaaggagatt /
tgggccaaatgcagaacagtt
tgttctgcatttggcccatac /
gcagaatgtcagctttttgtcc
ctccatgtggcttccctgta /
aatgctttgaaggtgcgatag
atgctgcttgattcttcctcct /
ccctaggcaaatggtaatgaac
cctgctcctctgccctat /
aatcatttggactcttacctact
Sequence
ID1
Length Temp2 Temp3
(bp)
(◦ C)
(◦ C)
b
503
61
54.6
c
300
62
59.6
AH005039
470
60
58.2
AH005039
448
68
61.8
AH005039
469
61
59.7
U15086
421
68
62.1
i
527
62
61.8
AY326194
540
60
61.3
AY326194
379
61
59.1
AY326194
468
58
61.9
AY331391
504
65
63.1
U15086
490
60
62.1
U15086
482
59
61.5
U15086
300
59
59.5
AY438372
462
60
58.1
AY438372
546
60
56.4
AY438372
530
59
58.7
AY438372
419
58
60.4
AF222783
501
58
58.9
AF222783
468
58
56.5
345
Single nucleotide polymorphisms of 12 chicken genes
Table I. Continued.
Primer
Gene
501
PIT-1
502
PIT-1
503
PIT-1
504
PIT-1
505
PIT-1
506
PIT-1
507
PIT-1
1002
SS
1003
SS
601
TSH-β
602
TSH-β
603
TSH-β
604
TSH-β
Nucleotide constitutes
Forward primer (5’-3’) / Reverse
primer (5’-3’)
tgaggatggctgaggggcttaat /
tgaaggcacagcacagggaaact
gcctgaccccttgcctttat /
ccagcttaattctccgcagttt
ctggagaggcactttggagaac /
ttaggccttcaacagtccaaat
tttgctgcctttctctggac /
cccacttgttctgcttcttcc
tgctgctgatgagggggaaagt /
atggtggttctgcgcttcctctt
ttttgtacccttgaattctgac /
gaaagctcccacaggtaatat
aggggactgtacatatttctgc /
ccccataggtagaggcttgat
ggggccgagcaggatgaagt /
cacgcaagaaccggtcagaaatc
ccctgctctccatcgccttg /
ggatgtgctggaagggtggtc
cccttcttcatgatgtctctcc /
ggtccttagttccatctgtgc
gagcacggtgagcattactgg /
ggaggtacatttctgccacgt
tgcacagatggaactaaggac /
aactgtagtgccaagggatct
cagcagcttgtctccatctag /
ccgtgctctgtggttttaaat
Sequence
ID1
Length Temp2 Temp3
(bp)
(◦ C)
(◦ C)
AF029892
444
62
56.6
AF029892
243
60
60.9
AF029892
407
60
56.2
d
384
60
58.6
e
391
62
55.4
f
540
55
55.4
g
435
60
57.8
X60191
357
65
57.6
j
466
60
63.1
AY341265
521
60
57.3
h
485
60
59.0
AY341265
528
62
58.0
AY341265
544
59
58.6
1
Sequence accession numbers used for primer designing. a: A sequence published by Burnside
et al. [6]; b: Forward (M32791), Reverse (unpublished intron sequence); c: Forward (unpublished intron sequence), Reverse (M32791); d: Forward (AY299400), Reverse (AF089892);
e: Forward (AY324228), Reverse (AF089892); f : Forward (AF089892), Reverse (AY324229);
g: Forward (AY324229), Reverse (AF089892); h: Forward (AY341265), Reverse (AF033495);
i: Forward (AY326194), Reverse (AY331391); j: Forward (X60191), Reverse (AY555066).
2
Annealing temperature for PCR amplification. 3 Column temperature for DHPLC detection.
The twenty-five µL PCR reaction mixture contained 50 ng of chicken genomic DNA, 1 × PCR buffer, 12.5 pmol of each primer, 100 µM dNTP (each),
1.5 mM MgCl2 and 1.0 Units Taq DNA polymerase (all reagents were from the
Sangon Biological Engineering Technology Company; Shanghai, China). The
PCR conditions were 3 min at 94 ◦ C, followed by 35 cycles of 30 s at 94 ◦ C,
45 s at certain annealing temperatures (ranged from 55 ◦ C to 68 ◦ C for each
346
Q. Nie et al.
primer), 1 min at 72 ◦ C, and a final extension of 5 min at 72 ◦ C in a Mastercycler gradient (Eppendorf Limited, Hamburg, Germany). The PCR products
were analyzed on a 1% agarose gel to assess the correct size and quality of the
fragments.
2.3. SNP identification with the DHPLC method and sequencing
confirmation
Mutation analysis was conducted with the DHPLC method on a WAVE
DNA Fragment Analysis System (Transgenomic Company, Santa Clara,
USA). Eight µL PCR products from each pair of primers were loaded on a
SaraSep DNASep column, and the samples were eluted from the column using
a linear acetonitrile gradient in a 0.1 M triethylamine acetate buffer (TEAA),
pH = 7, at a constant flow rate of 0.9 mL per min. The melting profile for each
DNA fragment, the respective elution profiles and column temperatures were
determined using the software WAVE Maker (Transgenomic Company, Santa
Clara, USA). Chromatograms were recorded with a fluorescence detector at
an emission wavelength of 535 nm (excitation at 505 nm) followed by a UV
detector at 260 nm. The lag time between fluorescence and UV detection was
0.2 min.
According to the DHPLC profiles, the representative PCR products with
different mutation types were purified and sequenced forward and reverse by
BioAsia Biotechnology Co. Ltd (Shanghai, China). The sequences obtained
were analyzed using the DNASTAR program ( />for SNP confirmation.
2.4. Calculations
In order to obtain an estimate of nucleotide diversity, the normalized numbers of variant sites (θ) was calculated as the number of observed nucleotide
changes (K) divided by the total sequence length in base pairs (L) and corrected for sample size (n), as described by Cargill et al. [8]. The formula is as
follows:
n−1
θ=K
i=1
i−1 L.
Single nucleotide polymorphisms of 12 chicken genes
347
2.5. Locating genes on chromosomes
The chicken genome sequence draft could be obtained from
and />chicken/. By BLAST analysis, the locations of all 12 genes in the chromosomes were made clear, which was consistent with the original mapping
results of some genes [10, 16, 32, 34, 42].
3. RESULTS
3.1. Characterizations of the primers
Ninety-two primer pairs were tested in this study, of which seventy-five successfully amplified specific fragments. There were 9 primer pairs for GH, 11
for GHR, 7 for ghrelin, 7 for GHSR, 10 for IGF-I, 3 for IGF-II, 9 for IGFBP-2,
4 for insulin, 2 for LEPR, 7 for PIT-1, 2 for SS and 4 for the TSH-β gene. The
details of these 75 primers, including their nucleotide constituents, length of
PCR products, annealing temperature for PCR and column temperature for
DHPLC, are shown in Table I. These primers spanned 31 897 bp of the genomic sequence, including 1543 bp of the 5’ regulatory region (5’-flanking and
5’UTR), 7095 bp of the coding region, 17 218 bp of the introns and 6041 bp of
the 3’ regulatory region (3’-flanking and 3’UTR).
3.2. PCR amplification, DHPLC profiles and sequencing confirmation
In 40 animals from the four divergent breeds used for SNP identification, good quality PCR products were obtained using each of these 75 pairs
of primers. After PCR products were analyzed with the WAVE DNA
Fragment Analysis System, different DHPLC profiles were observed among
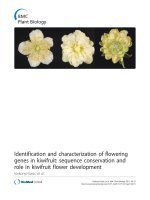
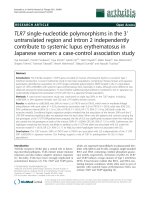
40 individuals (example shown in Fig. 1). Different nucleotides among individuals with different DHPLC profiles were identified, and their sites and nucleotide mutations were determined by direct sequencing (Fig. 1). In addition,
three genotypes in each SNP can also be easily determined by direct sequencing (Fig. 1).
3.3. Single nucleotide polymorphisms in 12 chicken candidate genes
In total, 283 SNP were identified in 31 897 bp of sequence within the 12 selected genes. The SNP markers are summarized in Table II. Considering the
348
Q. Nie et al.
Figure 1. Example of a DHPLC-plot and sequencing confirmation in the 5’UTR of
the chicken GH gene. Profiles A, B, C, and D indicate four mutation types identified
by DHPLC method, and their corresponding nucleotides in five SNP sites are marked
by the arrowhead. “N” represents two nucleotides existing in this site, and the SNP
location (152, 184, 185, 210 and 423) was given according to the chicken GH gene
sequence published (Genbank accession number: AY461843).
12 genes as a whole, every 113 bps generated one SNP on average, giving rise
to its corresponding θ value of 2.07 × 10⁻³ . The average spread in bps per SNP
and per gene region is presented in Table III.
The 283 SNP identified contained 74.2% of transitions (210 SNP), 11.3%
of transversions (15), and 1.8% of indel (5). All SNP obtained were bi-allelic
Table II. Summary of 283 SNP in the 12 selected candidate genes.
Chrom1
Bps
scanned
Primer
pairs
Total
SNP
GH
GHR
ghrelin
GHSR
IGF-I
IGF-II
IGFBP-2
insulin
LEPR
PIT-1
SS
TSH-β
In total
1
Z
7
9
1
5
7
5
8
1
9
26
-
3945
4007
2536
3628
3578
1681
4311
1793
1070
2400
944
2004
31897
9
11
7
7
10
3
9
4
2
7
2
4
75
46
33
25
27
15
4
35
24
9
23
11
31
283
SNP numbers2
5’UTR
4
0
1
0
3
0
0
1
0
0
0
0
9
Syn/non3/2
3/5
1/1
9/2
0/0
1/0
4/1
0/0
3/0
2/2
1/2
5/0
32/15
Intron
36
17
21
25
1
3
18
22
6
16
3
26
194
3’UTR
1
8
1
1
11
0
12
1
0
3
5
0
43
The chromosomes containing the chicken GH, GHR, IGF-II, insulin, and LEPR gene were confirmed by previous studies on physical mapping of
each gene [10,16,32,34,42], and those of the rest of the genes were determined according to the draft sequence of the chicken genome recently released
( 2 5’UTR = 5’ untranslation region; Syn = synonymous; non- = non-synonymous; 3’UTR = 3’ untranslation
region.
Single nucleotide polymorphisms of 12 chicken genes
1
Gene
349
350
Q. Nie et al.
Table III. The estimates for different classes of polymorphic sites.
Polymorphic
sites1
5’UTR
Coding
-Syn
-Non-syn
Introns
3’UTR
Total
bp
screened
1543
7095
7095
7095
17218
6041
31897
SNP No.
9
47
32
15
194
43
283
Density
(SNP/bp)
1/172
1/151
1/222
1/473
1/89
1/141
1/113
Individual
No.
40
40
40
40
40
40
40
θ value
1.35 × 10⁻³
1.55 × 10⁻³
1.05 × 10⁻³
4.9 × 10⁻⁴
2.63 × 10⁻³
1.65 × 10⁻³
2.07 × 10⁻³
1
5’UTR = 5’ untranslation region; Syn = synonymous; Non-syn = non-synonymous;
3’UTR = 3’ untranslation region.
Table IV. Non-synonymous SNP that led to the changes of amino acids.
Amino acid
change2
A13T
R59H
Region3
G1494A
G2075A
Codon
change
GCT→ACT
CGC→CAC
GHR
M74057
M74057
M74057
M74057
M74057
G1359A
G1475C
G1507T
A1512T
G1599C
GCT→ACT
CAG→CAC
AGC→ATC
ACA→TCA
GAG→CAG
A442T
Q480H
S491I
T493S
E522Q
Mat
Mat
Mat
Mat
Mat
ghrelin
IGFBP-2
AY303688
U15086
A2355G
G645T
CAG→CGG
ATG→ATT
Q113R
M205I
Pro
Mat
GHSR
AB095994
AB095994
A1071T
C3833T
AAC→TAC
GCC→GTC
N227Y
A323V
Mat
Mat
PIT-1
AJ236855
AJ236855
A499G
A761G
ATG→GTG
AAT→AGT
M167V
N254S
Mat
Mat
SS
X60191
X60191
A275G
A370G
CAG→CGG
AAA→GAA
Q79R
K111E
Pre
Mat
Gene
GH
1
3
Sequence
ID1
AY461843
AY461843
SNP
Pre
Mat
Refers to Genbank accession number of each sequence. 2 Indicates the changes of amino acids.
Pre = precursor; Mat = mature protein; Pro = procursor.
polymorphisms except in two cases: a tri-allelic SNP was observed in the insulin gene (T/C/A, nt 1295 of AY 438372) and the other in the LEPR gene
(T/G/A, nt 885 of AF 222783). For these two tri-allelic SNP, sequencing artefacts were excluded by performing repetitive sequencing for several individuals with different genotypes.
Single nucleotide polymorphisms of 12 chicken genes
351
3.4. Non-synonymous SNP
Fifteen non-synonymous SNP were identified in the present study, most
of which (12 of 15) affected the translated mature proteins (Tab. IV). In the
GH gene, G1494A and G2075A changed the signal peptide (A13T) and mature protein (R59H) respectively. Five SNP of G1359A (A442T), G1475C
(Q480H), G1507T (S491I), A1512T (T493S) and G1599C (E522Q) all occurred in the intracellular region of the GHR gene, but they had no influence
on the conserved features of 5 cysteine residues in this domain. A1071T and
C3833T altered the mature protein of the GHSR gene with the amino acid
changes of N227Y and A323V. Transitions A499G and A761G in the PIT-1
gene led to the changes of M167V and N254S, however, the conserved POU
domain was not affected. A2355G was located in the coding region of preproghrelin. A275G (Q79R) and A370G (K111E) of the SS gene changed the
precursor and mature somatostatin-14 (or -28) respectively.
3.5. Other sequence variations identified
Seventeen DNA sequence variations, other than SNP, were identified in
9 genes: GH, GHR, ghrelin, GHSR, IGFBP-2, insulin, PIT-1, SS and TSH-β.
These changes included 15 cases of indel polymorphisms of no less than 2 bp
and 2 cases of polymorphic numbers of continuous A nucleotide in the present
study. Most of these variations were polymorphisms with minor allelic frequencies over 1% (Tab. V). These variations occurred in non-coding regions
of each functional gene, and did not change the terminal products of translated
precursors.
3.6. PCR-RFLP DNA markers
From the 283 SNP and 17 other variations, 58 SNP and one case of a
6 bp indel polymorphism, led to the presence or absence of some restriction
sites. As a result, 59 PCR-RFLP markers were developed, but they were not
validated experimentally. The numbers of markers developed for the 12 genes
are summarized in Table VI. All these PCR-RFLP markers were located in either coding regions (synonymous and non-synonymous) or non-coding regions
such as 5’-flanking, 5’UTR, intron and 3’UTR. Furthermore, the choice of a
PCR-RFLP marker was also based on the cost of the restriction enzyme.
352
Q. Nie et al.
Table V. Other sequence variations identified in the 9 chicken growth-correlated
genes.
Gene
GH
GHR
ghrelin
GHSR
IGFBP-2
insulin
PIT-1
SS
Sites
Sequence
ID1
Variations
3308-3357
AY461843
50 bp lost
2180
71-72
79-86
643-662
AY303688
TG indel
3407-3412
AB095994
965
AY326194
783-794
1295-1296
1589-1593
586
AY438372
AY438372
AY438372
AY396150
GGTACA
indel
CCAGGTG
indel
12 bp indel
TC indel
ATTTT indel
57 bp indel
394-405
423-424
TSH-β
Intron 4
M74057 GTGA indel 3’UTR
AY303688
CC indel
5’UTR
AY303688 CTAACCTG 5’UTR
indel
AY303688
(A)n
Intron 2
1418-1419
270
Region
Intron 3
Intron
Intron 2
Frequency
(%)2
Comment3
0.5
Nie et al. [25]
7.5
2.5
5
2.5
2.5
30
7.5
Intron
Intron
Intron
Intron 2
12.5
5
2.5
30
Exon 1
81 bp
insertion
Intron 2
AY341265
(A)n,
n = 12,13,15
AY341265
CA indel
Intron 2
0.5
X60191
1120-1123
AY341265
TTGT indel
1662
AY341265
GT indel
Intron 2
Intron 2
AB075215;
AY299454
SSC 1(+)
86752736∼86752792
2.5
10
5
25
1
Refer to Genbank accession number. 2 Indicates minor allele frequencies. 3 Means some results were
proven by previous studies; AB075215 and AY299454 are Genbank accession numbers; “SSC 1(+)
86752736∼86752792” refer to the inserted 57 bp sequences were nt 86752736∼86752792 of chromosome 1(+) published by the Chicken Genome Project ( />
4. DISCUSSION
In this study DHPLC was successfully used to discover SNP in functional
chicken genes. As a highly sensitive and automated method, DHPLC is mainly
based on the capability of ion-pair reverse-phase liquid chromatography
353
Single nucleotide polymorphisms of 12 chicken genes
Table VI. Fifty-nine PCR-RFLP DNA markers in the 11 chicken genes.
No
SNP site
Gene
Region
T185G
C423T
G662A
G2048A
G2248A
T3094C
C3199T
G3581T
G565A
C895G
A387G
G2408A
C2907A
G687A
T1167A
T2100C
C2466T
Sequence
No1
AY461843
AY461843
AY461843
AY461843
AY461843
AY461843
AY461843
AY461843
AJ506750
AJ506750
AY468380
M74057
M74057
AY303688
AY303688
AY303688
AY303688
1
2
3
4
5
6
7
8
9
10
11
12
13
14
15
16
17
GH
GH
GH
GH
GH
GH
GH
GH
GHR
GHR
GHR
GHR
GHR
ghrelin
ghrelin
ghrelin
ghrelin
18
G656A
AB095994
GHSR
19
C842T
AB095994
GHSR
20
21
22
23
24
25
A1071T
T1857C
A1965G
A2044G
C2047T
T2133A
3407∼3412
indel
AB095994
AB095994
AB095994
AB095994
AB095994
AB095994
GHSR
GHSR
GHSR
GHSR
GHSR
GHSR
5’-flanking
5’-flanking
Intron 1
Intron 2
Intron 3
Intron 4
Intron 4
Intron 4
Intron 5
Intron 5
Intron 7
3’-UTR
3’-UTR
Intron 2
Intron 3
Intron 4
3’-UTR
Exon 1 (R
synonymous)
Exon 1 (A
synonymous)
Exon 1 (N→Y)
Intron 1
Intron 1
Intron 1
Intron 1
Intron 1
AB095994
GHSR
Intron 1
27
C3678T
AB095994
GHSR
28
C3753T
AB095994
GHSR
29
30
31
32
33
34
T159C
C253T
C570A
C664T
C129T
G329A
M74176
M74176
M74176
AY331392
AY253744
S82962
IGF- I
IGF- I
IGF- I
IGF- I
IGF- I
IGF-´cò
26
Exon 2 (F
synonymous)
Exon 2 (S
synonymous)
5’UTR
5’UTR
5’UTR
3’UTR
3’UTR
Intron 2
Restriction
enzyme
Hin 6 I
Pag I
Msp I
Mph 1103 I
EcoR´cõ
Msp I
Msp I
Bsh 1236 I
Eco 72 I
BsuR´cõ
Eco 1051
Hin 6 I
BsuR I
KspA I
Nde I
Pag I
Csp 6 I
Msp I
BsuR I
Csp 6 I
Hin 6 I
Nco I
Hin 6 I
BspT I
Tas I
Csp 6 I
Bsp 119 I
Hin 6 I
Tas I
Mph 1103 I
Hinf I
Hinf I
Bsp 119 I
Hinf I
354
Q. Nie et al.
Table VI. Continued.
1
No
SNP site
Sequence
No1
Gene
35
G639A
U15086
IGFBP-2
36
37
38
39
40
41
42
43
44
45
46
47
48
49
50
51
52
53
54
55
G645A
G1510A
G1946A
G287A
A754G
G809T
C1032T
C173T
C206T
C208T
C195T
T409C
A428G
C1218A
C1549T
T3737C
A3971G
C352T
G427A
A660G
U15086
U15086
U15086
AY326194
AY326194
AY326194
AY326194
AY331391
AY331391
AY331391
AY438372
AY438372
AY438372
AY438372
AY438372
AY438372
AY438372
AF222783
AF222783
AF222783
IGFBP-2
IGFBP-2
IGFBP-2
IGFBP-2
IGFBP-2
IGFBP-2
IGFBP-2
IGFBP-2
IGFBP-2
IGFBP-2
insulin
insulin
insulin
insulin
insulin
insulin
insulin
LEPR
LEPR
LEPR
56
G543A
AJ236855
PIT-1
57
C425G
AY341265
TSH-β
58
T1761C
AF341265
TSH-β
59
G1821A
AF341265
TSH-β
Region
Restriction
enzyme
Exon 2 (S
Bsh 1236
synonymous)
I
Exon 2 (M→I)
BseG I
3’UTR
Xho I
3’UTR
Eco 72 I
Intron 2
Alu I
Intron 2
Alw 44 I
Intron 2
Dra I
Intron 2
Eco 72 I
Intron 3
Mva I
Intron 3
Bsp 143 I
Intron 3
Bgl´cò
5’UTR
BsuR I
Intron 2
Taq I
Intron 2
Nde I
Intron 2
Nde I
Intron 2
Msp I
Intron 2
Msp I
3’UTR
Msp I
Intron 8
Bsh 1236 I
Intron 8
Bsh 1236 I
Intron 8
Tas I
Exon 3 (E
EcoR I
synonymous)
Intron 2
Csp 6 I
Exon 3 (S
Hin 6 I
synonymous)
Exon 3 (P
Msp I
synonymous)
Refers to Genbank accession number of each sequence.
to resolve homoduplex from heteroduplex molecules under conditions of partial denaturation [15]. Currently, DHPLC seems to be limited in distinguishing
different kinds of homoduplex and in genotyping individuals for each SNP,
especially when several SNP are present in a DNA fragment [22]. For this reason, and due to the small sample size (10 individuals for each breed) used in
this study, the allele frequency of each SNP in four chicken breeds was not
calculated. Nevertheless allele frequency estimates would provide important
information for a future evaluation of the potential effect of each SNP.
Single nucleotide polymorphisms of 12 chicken genes
355
In the present study, 283 SNP were identified in a total length of 31 897 bp
of DNA, covering the 12 chicken genes in the somatotropic axis. The results
provide basic information on the distribution and characteristics of SNP in
chicken genes. The average bps per SNP in the 12 selected genes was very
low (113 bp), consequently the nucleotide diversity seems to be much higher
in chickens even when this is adjusted for the small sample size studied (40 individuals or 80 chromosomes) (Tab. III). In human SNP screening studies, the
SNP density reported is much lower, and one SNP is reported to occur in every
1000–2000 bases when two human chromosomes are compared [2, 23, 28].
Another study analysing SNP incidence in 106 human genes, provided a
higher density of one SNP per 348 bp, and their θ values of synonymous and
non-synonymous SNP in coding regions were 1.0 × 10⁻³ and 1.96 × 10⁻⁴
when corrected for sample size. These θ values were quite comparable to
our results [8]. The lower SNP density reported in humans might be due to
the fact that fewer intronic SNP were identified and sequences of less individuals were compared. On the contrary, the chicken genome is much more
compact than that of humans, since their genome size were almost 3.2 and
1.1 billion respectively ( The higher
SNP incidence in chickens seemed to compensate for its small genome size and
much lower repetitive DNA (including microsatellite sequences) occurrence.
A forthcoming paper that focuses on millions of SNP in the chicken genome
will be available soon in Nature. In the pig, a recently developed SNP map of
chromosome 2 showed that the SNP density is much higher [18], which is in
accordance with the present study.
Among 283 SNP, 278 were single-base substitutions and only 5 were single
base indels. Furthermore, over 74% of the SNP (210 of 283) were transitions,
similar to the ratio (75%) obtained from 10 human genes [14]. Although most
SNP were bi-allele polymorphisms, two tri-allelic variations were observed in
the insulin gene (T/C/A, nt 1295 of AY 438372) and the LEPR gene (T/G/A, nt
885 of AF 222783), respectively. Since expected introns had higher SNP densities than coding regions and up- or down stream regions because of selection
pressure on exons and flanking regions, the latter is likely to be related to the
control of expression levels.
In this study, most 283 SNP of the 12 candidate genes identified are from
TS and X chickens, which seems to indicate that the two Chinese native
chicken breeds are more diverse than the two commercial breeds. It has previously been shown that the level of heterozygosity in commercial broilers
and layers is lower than that observed in Chinese native chicken breeds in
allozymes, random amplified polymorphism DNA and microsatellite DNA
356
Q. Nie et al.
polymorphisms [43]. The long-term and intense selection for growth and production traits has resulted in decreasing diversity of the Leghorn and WRR
breeds. However, further study is needed on the effect of the observed variation
and the differences in growth rate and egg production between these breeds.
The SNP from the 12 candidate genes identified in the present study provides
suitable genetic markers for the analysis of such differences.
The twelve functional genes studied are all key factors in the chicken somatotropic axis, and play crucial roles in growth and in the metabolism of the
chicken. There might be certain underlying relationships between some of the
SNP identified in these genes and quantitative traits like growth and carcass
traits. The SNP or more specifically the 59 PCR-RFLP markers identified in
this study provide a good opportunity to perform association studies for growth
or reproduction related traits in the diverse breeds used.
A few SNP of these twelve genes have been reported previously, and some
of them are related to growing, laying, meaty quality or disease-resistance
traits. In the chicken GH gene, several SNP in introns have been identified
and reported to be associated with growth, egg production and disease resistance [11, 13, 20]. Sex-linked dwarf chickens are just due to a mutation at an
exon-intron splicing site of the GHR gene [17]. Another SNP that led to the
presence or absence of a poly (A) signal in intron 2 was found to influence
ages at first egg and egg production from 274 to 385 days [11, 12]. Two SNP
in the IGF-II gene were significantly related to growth and feeding traits [3].
Fifteen non-synonymous SNP changed the translated precursor of the
chicken GH, GHR, ghrelin, IGFBP-2, PIT-1 and SS, and could affect the normal function of the mature proteins (Tab. IV). Other SNP in non-coding regions of 5’UTR, 3’UTR and introns, could also affect gene expression levels
because of regulatory elements present in 5’UTR or 3’UTR regions [21]. These
SNP with obviously different allelic frequencies between high reproduction (L)
or fast-growing breeds (WRR) and slow-growing ones (TS and X) could contribute to their divergent growth performance (Tab. VI).
In seventeen other types of sequence variations (Tab. V), some of them were
consistent with previous studies. A 50 bp deletion was reported to be present
in the chicken GH gene of Chinese TS [24]. A 1773 bp deletion in exon 10 and
3’UTR of the GHR gene, however, have been proven to translate into a dysfunctional precursor and could explain the existence of sex-linked dwarf chickens [1]. For the PIT-1 gene, a 57 bp indel polymorphism in intron 2 was quite
frequent both in Chinese native chickens (TS and X) and commercial lines
(L and WRR). This indel was confirmed by a Genbank sequence (AY396150)
and the released genome sequence (nt 86752736∼86752792 of Z chromosome)
Single nucleotide polymorphisms of 12 chicken genes
357
of the Chicken Genome Project ( />For the SS gene, many variations have been described in several species, including chickens, however, insertion or deletion of dozens of bps has not been
reported before [35]. Since the SS gene consists of two exons in nearly all
species, the 81 bp insertion in the chicken SS gene in the present study is remarkable. This might mean that the SS gene of the chicken contains 27 additional amino acids. Further study at the functional level is needed to asses the
biological effects of this large insertion.
In conclusion, 283 SNP and 17 other variations in 12 chicken growthcorrelated genes were identified in the present study. Some of these SNP could
serve as useful markers for association studies for growth related traits, since
there are indications that there are allele frequency differences among diverse
chicken breeds.
ACKNOWLEDGEMENTS
This work was funded by projects under the Major State Basic Research
Development Program, China, project no. G2000016102. We would like to
thank Drs. Richard Crooijmans (Wageningen University, The Netherlands) and
Changxi Li (University of Alberta, Canada), and the two referees for their
comments on this manuscript.
REFERENCES
[1] Agarwal S.K., Cogburn L.A., Burnside J., Dysfunctional growth hormone receptor in a strain of sex-linked dwarf chicken: evidence for a mutation in the
intracellular domain, J. Endocrinol. 142 (1994) 427–434.
[2] Altshuler D., Pollara V.J., Cowles C.R., van Etten W.J., Baldwin J., Linton L.,
Lander E.S., An SNP map of the human genome generated by reduced representation shotgun sequencing, Nature 407 (2000) 513–516.
[3] Amills M., Jimenez N., Villalba D., Tor M., Molina E., Cubilo D., Marcos C.,
Francesch A., Sanchez A., et al., Identification of three single nucleotide polymorphisms in the chicken insulin-like growth factor 1 and 2 genes and their
associations with growth and feeding traits, Poult. Sci. 82 (2003) 1485–1493.
[4] Blankenstein O., Muhlenberg R., Kim C., Wuller S., Pfaffle R., Heimann G.,
A new C-terminal located mutation (V272ter) in the PIT-1 gene manifesting
with severe congenital hypothyroidism. Possible functionality of the PIT-1 Cterminus, Horm. Res. 56 (2001) 81–86.
358
Q. Nie et al.
[5] Breier B.H., Regulation of protein and energy metabolism by the somatotropic
axis, Domest. Anim. Endocrinol. 17 (1999) 209–218.
[6] Burnside J., Liou S.S., Cogburn L.A., Molecular cloning of the chicken growth
hormone receptor complementary deoxyribonucleic acid: mutation of the gene
in sex-linked dwarf chickens, Endocrinology 128 (1991) 3183–3192.
[7] Buyse J., Decuypere E., The role of the somatotropic axis in the metabolism of
the chicken, Domest. Anim. Endocrinol. 17 (1999) 245–255.
[8] Cargill M., Altshuler D., Ireland J., Sklar P., Ardlie K., Patil N., Lane C.R., Lim
E.P., Kalyanaraman N., et al., Characterization of single-nucleotide polymorphisms in coding regions of human genes, Nat. Genet. 22 (1999) 231–238.
[9] Dacou-Voutetakis C., Feltquate D.M., Drakopoulou M., Kourides I.A.,
Dracopoli N.C., Familial hypothyroidism caused by a nonsense mutation in the
thyroid-stimulating hormone beta-subunit gene, Am. J. Hum. Genet. 46 (1990)
988–993.
[10] Dunn I.C., Boswell T., Friedman-Einat M., Eshdat Y., Burt D.W., Paton I.R.,
Mapping of the leptin receptor gene (LEPR) to chicken chromosome 8, Anim.
Genet. 31 (2000) 290.
[11] Feng X.P., Kuhnlein U., Aggrey S.E., Gavora J.S., Zadworny D., Trait association of genetic markers in the growth hormone and growth hormone receptor
gene in a white Leghorn strain, Poult. Sci. 76 (1997) 1770–1775.
[12] Feng X.P., Kuhnlein U., Faithfull R.W., Aggrey S.E., Yao J., Zadworny D., A genetic marker in the growth hormone receptor gene associated with body weight
in chickens, J. Hered. 89 (1998) 355–359.
[13] Fotouhi N., Karatzas C.N., Kuhlein U., Zadworny D., Identification of growth
hormone DNA polymorphisms which response to divergent selection for abdominal in chickens, Theor. Appl. Genet. 85 (1993) 931–936.
[14] Garcia C.K., Mues G., Liao Y., Hyatt T., Patil N., Cohen J.C., Hobbs H.H.,
Sequence diversity in genes of lipid metabolisms, Genome Res. 11 (2001)
1043–1052.
[15] Giordano M., Oefner P.J., Underhill P.A., Sforza L.C., Tosi R., Richiardi P.M.,
Identification by denaturing high-performance liquid chromatography of numerous polymorphisms in a candidate region for multiple sclerosis susceptibility,
Genomics 56 (1999) 247–253.
[16] Habermann F.A., Biet C., Fries R., Physical mapping of the genes encoding
tryptophan hydroxylase and insulin to chicken chromosome 5, Anim. Genet. 32
(2001) 319–321.
[17] Huang N., Cogburn L.A., Agarwal S.K., Marks H.L., Burnside J.,
Overexpression of a truncated growth hormone receptor in the sex-linked dwarf
chicken: evidence for a splice mutation, Mol. Endocrinol. 7 (1993) 1391–1398.
[18] Jungerius B.J., Rattink A.P., Crooijmans R.P., van der Poel J.J., van Oost B.A.,
te Pas M.F., Groenen M.A., Development of a single nucleotide polymorphism
map of porcine chromosome 2, Anim. Genet. 34 (2003) 429–437.
[19] Klein S., Morrice D.R., Sang H., Crittenden L.B., Burt D.W., Genetic and physical mapping of the chicken IGF1 gene to chromosome 1 and conservation of
synteny with other vertebrate genomes, J. Hered. 87 (1996) 10–14.
Single nucleotide polymorphisms of 12 chicken genes
359
[20] Kuhnlein U., Ni L., Weigend S., Gavora J.S., Fairfull W., Zadworny D., DNA
polymorphisms in the chicken growth hormone gene: response to selection for
disease resistance and association with egg production, Anim. Genet. 28 (1997)
116–123.
[21] Laere A.V., Nguyen M., Braunschweig M., Nezer C., Collette C., Moreau L.,
Archibald A.L., Haley C.S., Buys N., et al., A regulatory mutation in IGF2
causes a major QTL effect on muscle growth in the pig, Nature 425 (2003)
832–836.
[22] Lovell A.D., Yotova V., Xiao F., Batzer M.A., Labuda D., Polymorphisms within
a polymorphism: SNPs in and around a polymorphic Alu insertion in intron 44
of the human dystrophin gene, J. Hum. Genet. 49 (2004) 269–272.
[23] Mullikin J.C., Hunt S.E., Cole C.G., Mortimore B.J., Rice C.M., Burton J.,
Matthews L.H., Pavitt R., Plumb R.W., et al., An SNP map of human chromosome 22, Nature 407 (2000) 516–520.
[24] Nie Q., Ip S.C.Y., Zhang X., Leung F.C., Yang G., New variations in intron 4 of
growth hormone gene in Chinese native chickens, J. Hered. 93 (2002) 277–279.
[25] Nie Q., et al., Genbank accession numbers: AY 461843, AY 500876, AY 468380,
AY 331392, AY 253744, AY 299400, AY 324228, AY 324229, AY 341265, AY
303688, AY 326194, AY 331391, AY 555066, AY 438372. Other sequences
published by other people are also necessary for this study, and their accession
numbers are AJ 506750, M 74057, M 74176, M 32791, AF 029892, AF 033495,
U 15086, AH 005039, X 60191, AF 222783, AB 095994. All above sequences
are available in (2003).
[26] Renaville R., Hammadi M., Portetelle D., Role of the somatotropic axis in the
mammalian metabolism, Domest. Anim. Endocrinol. 23 (2002) 351–360.
[27] Rodrigues-Martineli A.M., Braga M., De Lacerda L., Raskin S., Graf H.,
Description of a Brazilian patient bearing the R271W Pit-1 gene mutation,
Thyroid 8 (1998) 299–304.
[28] Sachidanandam R., Weissman D., Schmidt S.C., Kakol J.M., Stein L.D., Marth
G., Sherry S., Mullikin J.C., Mortimore B.J., et al., A map of human genome
sequence variation containing 1.42 million single nucleotide polymorphisms,
Nature 409 (2001) 928–933.
[29] Sasaki O., Odawara S., Takahashi H., Nirasawa K., Oyamada Y., Yamamoto R.,
Ishii K., Nagamine Y., Takeda H., et al., Genetic mapping of quantitative trait
loci affecting body weight, egg character and egg production in F2 intercross
chickens, Anim. Genet. 35 (2004) 188–194.
[30] Schutz K., Kerje S., Carlborg O., Jacobsson L., Andersson L., Jensen P., QTL
analysis of a red junglefowl × White Leghorn intercross reveals trade-off in
resource allocation between behavior and production traits, Behav. Genet. 32
(2002) 423–433.
[31] Sewalem A., Morrice D.M., Law A., Windsor D., Haley C.S., Ikeobi C.O.,
Burt D.W., Hocking P.M., Mapping of quantitative trait loci for body weight
at three, six, and nine weeks of age in a broiler layer cross, Poult. Sci. 81 (2002)
1775–1781.
360
Q. Nie et al.
[32] Shaw E.M., Shoffner R.N., Foster D.N., Guise K.S., Mapping of the growth
hormone gene by in situ hybridization to chicken chromosome 1, J. Hered. 82
(1991) 505–508.
[33] Stancekova K., Vasicek D., Peskovicova D., Bulla J., Kubek A., Effect of genetic
variability of the porcine pituitary-specific transcription factor (PIT-1) on carcass
traits in pigs, Anim. Genet. 30 (1999) 313–315.
[34] Suzuki T., Kansaku N., Kurosaki T., Shimada K., Zadworny D., Koide M., Mano
T., Namikawa T., Matsuda Y., Comparative FISH mapping on Z chromosomes
of chicken and Japanese quail, Cytogenet. Cell Genet. 87 (1999) 22–26.
[35] Trabucchi M., Tostivint H., Lihrmann I., Blahser S., Vallarino M., Vaudry H.,
Characterization of the cDNA encoding a somatostatin variant in the chicken
brain: comparison of the distribution of the two somatostatin precursor mRNAs,
J. Comp. Neurol. 461 (2003) 441–451.
[36] Tuiskula-Haavisto M., Honkatukia M., Vilkki J., de Koning D.J., Schulman N.F.,
Maki-Tanila A., Mapping of quantitative trait loci affecting quality and production traits in egg layers, Poult. Sci. 81 (2002) 919–927.
[37] Ukkola O., Ravussin E., Jacobson P., Snyder E.E., Chagnon M., Sjostorm L.,
Bouchard C., Mutations in the preproghrelin/ghrelin gene associated with obesity in humans, J. Clin. Endocrinol. Metab. 86 (2001) 3996–3999.
[38] van Kaam J.B.C.H.M., Groenen M.A.M., Bovenhuis H., Veenendaal A.,
Vereijken A.L.J., van Arendonk J.A.M., Whole genome scan in chickens for
quantitative trait loci affecting carcass traits, Poult. Sci. 78 (1999) 1091–1099.
[39] van Kaam J.B.C.H.M., Groenen M.A.M., Bovenhuis H., Veenendaal A.,
Vereijken A.L.J., van Arendonk J.A.M., Whole genome scan in chickens for
quantitative trait loci affecting growth and feed efficiency, Poult. Sci. 78 (1999)
15–23.
[40] Vignal A., Milan D., SanCristobal M., Eggen A., A review on SNP and other
types of molecular markers and their use in animal genetics, Genet. Sel. Evol.
34 (2002) 275–305.
[41] Yan B., Li N., Deng X., Hu X., Liu Z., Zhao X., Lian Z., Wu C., Single nucleotide
polymorphism analysis in chicken insulin-like growth factor-II gene and its associations with growth and carcass traits, Acta Genet. Sin. 29 (2002) 30–33.
[42] Yokomine T., Kuroiwa A., Tanaka K., Tsudzuki M., Matsuda Y., Sasaki H.,
Sequence polymorphisms, allelic expression status and chromosome locations of
the chicken IGF2 and MPR1 genes, Cytogenet. Cell Genet. 93 (2001) 109–113.
[43] Zhang X., Leung F.C., Chan D.K.O., Yang G., Wu C., Genetic diversity of
Chinese native chicken breeds based on protein polymorphism, randomly amplified polymorphic DNA, and microsatellite polymorphism, Poult. Sci. 81 (2002)
1463–1472.