Mechanical characterisation of agarose-based chromatography resins for biopharmaceutical manufacture
Bạn đang xem bản rút gọn của tài liệu. Xem và tải ngay bản đầy đủ của tài liệu tại đây (2.3 MB, 9 trang )
Journal of Chromatography A, 1530 (2017) 129–137
Contents lists available at ScienceDirect
Journal of Chromatography A
journal homepage: www.elsevier.com/locate/chroma
Full length article
Mechanical characterisation of agarose-based chromatography resins
for biopharmaceutical manufacture
Mauryn C. Nweke a , R. Graham McCartney b , Daniel G. Bracewell a,∗
a
b
Department of Biochemical Engineering, University College London, Bernard Katz Building, Gower Street, London, WC1E 6BT, United Kingdom
Eli Lilly & Co. Dunderrow, Kinsale, Co. Cork, Ireland
a r t i c l e
i n f o
Article history:
Received 21 July 2017
Received in revised form
15 November 2017
Accepted 16 November 2017
Available online 20 November 2017
Keywords:
Mechanical characterisation
Chromatography media
Agarose beads
Pressure-flow
Dynamic mechanical analysis
a b s t r a c t
Mechanical characterisation of agarose-based resins is an important factor in ensuring robust chromatographic performance in the manufacture of biopharmaceuticals. Pressure-flow profiles are most
commonly used to characterise these properties. There are a number of drawbacks with this method,
including the potential need for several re-packs to achieve the desired packing quality, the impact of
wall effects on experimental set up and the quantities of chromatography media and buffers required.
To address these issues, we have developed a dynamic mechanical analysis (DMA) technique that characterises the mechanical properties of resins based on the viscoelasticity of a 1 ml sample of slurry.
This technique was conducted on seven resins with varying degrees of mechanical robustness and the
results were compared to pressure-flow test results on the same resins. Results show a strong correlation between the two techniques. The most mechanically robust resin (Capto Q) had a critical velocity
3.3 times higher than the weakest (Sepharose CL-4B), whilst the DMA technique showed Capto Q to
have a slurry deformation rate 8.3 times lower than Sepharose CL-4B. To ascertain whether polymer
structure is indicative of mechanical strength, scanning electron microscopy images were also used to
study the structural properties of each resin. Results indicate that DMA can be used as a small volume,
complementary technique for the mechanical characterisation of chromatography media.
© 2017 The Author(s). Published by Elsevier B.V. This is an open access article under the CC BY license
( />
1. Introduction
Manufacturers must ensure that chromatography media meet
a broad range of requirements before use for the separation/purification of biological products. These requirements
include a number of safety considerations (leachables, toxicology), performance (capacity, specificity, throughput), cost (capital
investment, longevity) and stability, among others [1]. Stability can
be split broadly into two categories − chemical and mechanical. The
chemical resistance of chromatography media is dependent on the
coupling chemistry as well as the choice of spacer and ligand chemistry and stability. Whereas, the mechanical stability is dependent
largely on the choice and composition of the base material, particle
size distribution, particle porosity, and to a lesser extent, ligand and
ligand deployment [2,3].
The base material is chosen based on a number of factors such
as cost, the properties of the material to be processed and surface
area and mass transfer characteristics, giving rise to parameters
∗ Corresponding author.
E-mail address: (D.G. Bracewell).
such as dynamic binding capacity (DBC) maximum flow rates,
maximum number of cycles etc. Based on this, different manufacturers use different composite materials for their chromatographic
media [4]. Agarose is a commonly used base matrix material in
biopharmaceutical purification as it relatively straightforward to
manufacture and customise certain properties such as porosity
and specific binding properties. This paper focuses particularly on
MabSelectTM , Sepharose TM and CaptoTM media (GE Healthcare,
Uppsala, Sweden).
Agarose is one of two main constituents of agar and is generally
extracted from seaweed. It is composed of a polysaccharide polymer material formed of repeating units of 1–3-linked -D galactose
and 1,4-linked 3,6-anhydro-␣-l-galactose [5]. Once the agar has
been processed, the agarose is in the form of a dry powder. It is
then dissolved in an aqueous solution >85◦ C, causing the chains
to degrade [3,6]. When the solution reaches a certain viscosity, it
is cooled and poured, whilst simultaneously being stirred into a
non-polar organic solvent which contains an emulsifier. These conditions induce the formation of spherical beads (emulsification).
The stirring and cooling rates are a key parameters in determining
certain structural characteristics such as porosity, pore size distri-
/>0021-9673/© 2017 The Author(s). Published by Elsevier B.V. This is an open access article under the CC BY license ( />
130
M.C. Nweke et al. / J. Chromatogr. A 1530 (2017) 129–137
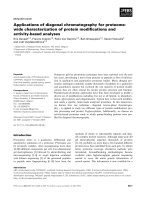
Fig. 1. General method for making porous agarose beads. The agarose solid is dissolved in water heated to about 90◦ C. This is then added to a stirred vessel containing a
hydrophobic solution (eg. Toluene or mineral oil) together with an emulsifier. The solutions are immiscible meaning that constant agitation causes the formation of agarose
droplets. A surfactant is added to prevent droplet coalescing. The solution is then cooled to below the gelation point of agarose (∼35◦ C) and the beads are then washed,
sieved to narrow the size distribution and cross-linked with a reagent.
bution and particle size distribution, which tends to range from 20
to 300 m [4] (Fig. 1).
Upon formation, the beads are insoluble and sediment into the
higher density water phase, as opposed to the organic solvent
phase. The beads are subsequently cross-linked with a reagent
such as epichlorohydrin. The extent to which this is done is one
of the critical factors that determine the rigidity of the matrix.
However, caution must be taken at this step as over-cross-linking
may reduce porosity, ligand deployment and compressibility characteristics [7,8]. When the process is completed, the resin can be
used in various applications such as size exclusion and desalting. It
may alternatively go on to be functionalised with different ligand
chemistries, after which it can be used in a number of modes for
various biopharmaceutical applications [1,3,9–11].
To ensure consistency in the structural and mechanical properties of chromatography media, the media has to be well
characterised. Structural integrity testing involves looking at pore
size and particle size distributions and porosity, which can generally be ascertained indirectly by observing titration curves or static
capacity. There have also been reports on developing lab-based procedures that involve the use of micromanipulation [9,12]. A better
idea of mechanical and column performance is usually determined
by pressure-flow characterisation. This technique involves gradually increasing the flow rate and observing a rise in the pressure
profile in the column. At a certain flow velocity, the pressure in the
column will continue to rise without further increase to the flow
rate. It is at this point that the critical velocity has been reached and
the column has ‘failed’ [13].
The advantages of this method include the ability to determine
the behaviour of chromatography media in a packed bed and how
mechanical properties vary with media viscosity, pH, ionic strength
etc. However, a drawback of this method is that it requires that the
operator adheres to stringent packing criteria to obtain meaningful
data. When packing columns, several re-packs may be required to
achieve the desired asymmetry and each resin, depending on its
chemical and mechanical properties, has its own specific packing
criteria. Furthermore, it is necessary to use a column of a suitable
diameter, such that wall effects that support the resin in narrow
columns do not dominate [14]. The bed height also needs to be representative, as pressure drop directly correlates to the height of the
bed, meaning heights of 15 cm or greater are typically used [15]. For
these reasons, the pressure-flow technique consumes large quantities of chromatographic media and buffers, which is costly [16].
To address these drawbacks, we have developed the use
of dynamic mechanical analysis (DMA) (Fig. 2). This technique
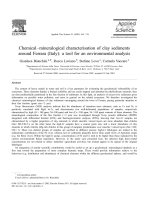
Fig. 2. Schematic of DMA set up and dimensions (not drawn to scale). The lid has a
diameter of 10 mm and the column that sits inside the pan has an inner diameter of
11 mm and an outer diameter of 14 mm. A sinusoidal force of 100mN is applied at a
frequency of 1 Hz over a period of 80 min. The output is strain v time, where strain
is the displacement of the lid relative to the sample height.
involves applying a small deformation to a sample in a cyclic manner and allows for the sample material to respond to changes in
stress, temperature, strain, frequency, force as well as other parameters. It is used widely in the bioengineering sector and the field of
biosciences to characterise the viscoelastic properties of various
biological tissue and other biomaterials. Traditionally, the stress
and strain parameters are used to calculate Young’s modulus to
give an indication of changes in elastic properties. Moroni et al.,
2006 [17] used the technique to investigate the use of scaffolds to
mimic human tissue. They found that the technique was particularly sensitive to pore size changes in scaffolds. With increasing
porosity in the scaffolds, there was a decrease in elastic properties,
which corresponded to an increase in strain. It has also been used
to look at the mechanical properties of materials similar to agarose
gels, such as hydrogels. Meyvis & Stubbe 2002 [18] used DMA as a
comparative technique to shear rheometry to investigate mechanical properties of pharmaceutical hydrogels. They found a strong
correlation between the two techniques but observed that DMA
can be used to investigate many more mechanical parameters than
solely viscoelasticity.
We have applied the use of DMA to investigate the viscoelastic properties of small quantities of seven agarose-based
M.C. Nweke et al. / J. Chromatogr. A 1530 (2017) 129–137
Table 1
Packing flowrates for Sepharose 4FF, Sepharose 6FF, Q-Sepharose HP, MabSelect and
Capto Q.
Resin
Packing flow rates
Sepharose 4 FF, Sepharose 6 FF, Q Sepharose HP
MabSelect
Capto Q
400 cm/hr − 2 min
500 cm/hr − 2 min
600 cm/hr − 2 min
resins, namely: Sepharose CL–4 B (SCL4B), Sepharose 4FF (S4FF),
Sepharose CL–6 B (SCL6B), Sepharose 6FF (S6FF), Q-Sepharose High
Performance (Q-HP), MabSelectTM (MabSelect) and CaptoTM Q
(Capto Q) (GE Healthcare, Uppsala, Sweden). We investigate how
the slurries respond to strain over a fixed period of time. We
then look to draw correlations between the results obtained from
pressure-flow and DMA experiments to ascertain whether DMA
can be used as complementary technique for the mechanical characterisation of chromatography media.
2. Materials and methods
2.1. Pressure-flow
2.1.1. Equipment
A bench-scale column with adjustable column length and inner
diameter of 1.6 cm (model XK16, GE Healthcare, Uppsala, Sweden)
was used. This was operated on the AKTA Pure (GE Healthcare, Uppsala, Sweden). Column pressure drop ( P) was measured using
the internal pressure measurement devices installed in the feed
delivery system of the AKTA Pure and the volumetric flow rate was
measured manually using the method employed by [15].
2.1.2. Chromatography media
Sepharose CL-4B, Sepharose CL-6B, Sepharose 4 Fast Flow,
Sepharose 6 Fast Flow, Q Sepharose High Performance, MabSelect and Capto Q (GE Healthcare, Uppsala, Sweden) were used in
this study. These agarose-based chromatography resins have an
average particle size of 80 m, with a bead size distribution of
between 24 and 165 m. The mechanical differences between the
seven resins lie in the agarose content and the extent of structural
cross-linking present.
MabSelect and Capto Q are made of highly cross-linked agarose,
whereas Sepharose CL-4B/CL-6B, Sepharose 4 FF/6 FF and Q
Sepharose HP are structurally simpler in terms of their crosslinking. However Sepharose 6 FF, CL-6B, Q Sepharose HP and
MabSelect all contain the same percentage of agarose in their matrices (6%), while Sepharose CL–4 B and Sepharose 4 FF contain 4% and
Capto Q 7%.
2.1.3. Procedure
Packing – All chromatography media was made up to 50% slurry
concentration. The same procedure was repeated for all seven
resins. 30 ml of slurry was poured into the column and allowed to
gravity settle overnight. The adaptor was lowered into the supernatant to start the flow pack. All columns were packed at 15 cm/hr
for 60 min and subsequently at 30 cm/hr for 30 min. The columns
shown in Table 1 were further consolidated. The top adaptor was
then lowered to the top of the bed. The packing medium used for
all buffers was distilled H2 O (dH2 O).
Performance testing – 2% v/v of acetone was measured and
®
added into 30 ml of dH2 O in a 50 ml falcon tube (CELLSTAR , UK).
1 ml of this solution was injected into a 600 l loop and then
loaded onto the column. The eluent used in this study was dH2 O
at 30 cm/hr. A peak was then generated within 30 min. The asymmetry was calculated using the in-built function on the Unicorn 6.4
software.
131
Pressure-flow method – The flow rate of the packing buffer was
continually gradually increased until a 35 kPa increase in pressure
drop was observed, as described by Tran et al., 2007 [15]. At this
point, the flow rate and any changes in bed height were manually recorded. At a certain flow rate, the pressure began to increase
exponentially with no further change to the flow velocity. At this
point it was deemed that the critical velocity for the column had
been reached.
2.2. Dynamic mechanical analysis
2.2.1. Column/holder design
10 identical cylindrical blocks of transparent acrylic were drilled
with an inner diameter of 11 mm, an outer diameter of 14 mm and
a height of 15 mm. The bottom was wrapped in a thin sheet of
parafilm (0.1 mm thickness) to contain the slurry.
2.2.2. Sample preparation
An aliquot of 10 ml of each resin was placed into a labelled
50 ml falcon tube and centrifuged for 5 min at 3000 rpm (Eppendorf centrifuge 5810 R, Thermo Fisher Scientific, UK) and the slurry
concentration was noted based on the volume ratio of liquid to
slurry in the falcon tube. The storage buffer (20% ethanol) was
decanted, replaced with their respective packing buffers and the
slurry solution was made up to a 70% slurry concentration. The
aliquots were resuspended and the procedure was repeated until
the storage buffer had been completely removed. 1.42 ml of each
aliquot was pipetted into their respectively labelled holder and left
to settle overnight, such that their settled bed height was 1 cm. A
consistent slurry concentration is important in achieving a uniform
settled bed volume and height for comparable strain measurements
across all resins.
2.2.3. DMA procedure
DMA was carried out on the DMA 7e hardware, with a TAC 7/DX
controller and Pyris Manager software (PerkinElmer, UK). In this
procedure the force reading is zeroed, the weight of the probe is
tared and the probe position is zeroed when the lid is lowered to the
base of the pan. The lid is lifted and the holder containing the slurry
is placed onto the pan. The lid is lowered to the top of the resin bed,
the height is read and the methodology is started. In this methodology, the lid applies a force of 100mN/min at a frequency of 1 Hz
for 80 min and a time-strain plot is generated simultaneously. Upon
completion of the methodology, the slope of the line is manually fitted from the origin to the point before ultimate compression (Fig. 6)
using the in-built slope function in the Pyris Manager software.
2.3. Scanning electron microscopy
All samples were critical point dried and imaged using the same
protocol described in Nweke et al., 2016 [19].
3. Results & discussion
The resins used in this study were selected based on their differences in percentage of agarose content and differences observed
in their fibrous structure, pore size distribution and cross-linking
via scanning electron microscopy (Fig. 5, Table 2). Their mechanical properties are characterised using the standard pressure-flow
method and this will then be compared to results from dynamic
mechanical analysis.
3.1. Pressure-flow
In this technique, the flow rate is manually increased until a
runaway rise in the pressure profile is observed. The flow rate at
132
M.C. Nweke et al. / J. Chromatogr. A 1530 (2017) 129–137
Table 2
Nominal bead size, pore size, % agarose and extent of cross linking of the resins used in this study. Information is based on GE Healthcare data sheets unless cited otherwise.
Resin
Bead size range (m)
Pore size range (nm)
% agarose
Extent of cross-linking
Sepharose CL-4B
Sepharose CL-6B
Sepharose 4 Fast Flow
Sepharose 6 Fast Flow
Q-Sepharose High Performance
MabSelect
Capto Q
45–165
45–165
∼90
∼90
24–44
∼85
∼90
∼42-70 [28,26]
∼24-70 [28,26]
∼45-100 [28,26]
∼29-70 [28,26]
∼70 [26]
∼60 −130 [29,26]
∼50 [26]
4%
6%
4%
6%
6%
6%
7%
Simple
Simple
Simple
Simple
Simple
High
High
Fig. 3. (a) Pressure-flow plot showing 3 repeats for Sepharose 6FF (6% cross-linked agarose) (one solid line, one dashed line, one dotted line) (circles). (b) Pressure-flow plot
showing averages of 3 out of the 7 resins – Sepharose CL–4 B (4% cross-linked agarose) (squares), Sepharose 6FF (6% cross-linked agarose) (circles) and Capto Q (7% highly
cross-linked agarose) (triangles). Error bars representing pressure and flow rate are +/− one standard deviation taken from the 3 repeats.
Fig. 4. Critical velocity for each resin obtained using the pressure-flow technique
in an XK16 column, bed height 15 cm. Each bar represents an average of the point
before column failure. The error bars represent the standard deviation of 3 repeats
of each resin. Capto Q (7% highly cross-linked agarose), MabSelect (6% highly crosslinked agarose), Q Sepharose HP (6% cross-linked agarose), Sepharose 6FF (6%
cross-linked agarose), Sepharose CL–6 B (6% cross-linked agarose), Sepharose 4FF
(4% cross-linked agarose), Sepharose CL–4 B (4% cross-linked agarose).
which this occurs is converted to linear velocity. This is the point
at which the column has ‘failed’ and is termed the critical velocity.
The more rigid the resin is, the higher the critical velocity. Three
repeats of the procedure (section 2.1) were conducted for all seven
resins and the averages are plotted. The standard deviations from
the average (based on the repeats) are represented by the error
bars (Fig. 3). The degree to which any individual repeat may vary
is reliant mainly on column packing and the resulting asymmetry.
The probability that a column will pack in exactly the same way,
despite using the same procedure is low. This is represented by the
asymmetry value obtained. Although the asymmetry differed for all
repeats, it was maintained in the range of 0.8-1.2 (which may have
required multiple repacks to achieve). A reduction in bed height
during the changes to flow velocity may also be observed [15].
Fig. 4 shows the critical velocities for each resin using the
pressure-flow characterisation technique using an XK16 column
with a bed height of 15 cm. Capto Q has the highest critical velocity at 492 cm/hr, followed by MabSelect − 423 cm/hr, Q-Sepharose
HP − 353 cm/hr, Sepharose 6FF − 348 cm/hr, Sepharose CL–6 B −
283 cm/hr, Sepharose 4FF − 204 cm/hr and Sepharose CL–4 B −
149 cm/hr.
The results show that Capto Q is the least compressible of the 7
resins, followed by MabSelect. This is expected as both resins are
made of highly cross-linked agarose polymers and contain 7% and
6% agarose respectively. Q-HP and S6FF are cross-linked resins that
contain 6% agarose. These two resins have quasi-identical critical
velocities. Their main structural differences are observed in their
average bead size and their average pore size distributions (Fig. 5,
Table 2) so their dynamic behaviour in the column is not exactly the
same (Fig. 3b – Q-HP exhibits slightly higher pressure drop). S6FF
resins are 2–3 times larger in size (dp ) compared to Q-HP, however the average pore size of S6FF (and Fast Flow resins in general)
is approximately 2–3 times smaller than that of Q-HP [20–22]. It
has been established that both pore size distribution and bead size
contribute to the mechanical properties of chromatography media
[23,9]. The trade-off between these two parameters, as well as their
identical mechanical traits, may explain why both resins have very
similar critical velocity values.
The results also show the differences in mechanical strength
between SCL6 B and S6FF, as well as SCL4 B and S4FF. Both pairs of
resins are cross-linked and contain 6% and 4% agarose in their matrices respectively, however both fast flow resins are mechanically
M.C. Nweke et al. / J. Chromatogr. A 1530 (2017) 129–137
133
Fig. 5. Scanning electron micrographs showing: Sepharose 4FF (4% cross-linked agarose), Sepharose CL–4 B (4% cross-linked agarose), Sepharose 6FF (6% cross-linked agarose),
Sepharose CL–6 B (6% cross-linked agarose), Q-Sepharose HP (6% cross-linked agarose), MabSelect (6% highly cross-linked agarose) and Capto Q (7% highly cross-linked
agarose). All images are taken post-critical point drying. Each image is x40000 magnification, 2.0 kV. Scale: 1 cm bar represents 400 nm of resin in all micrographs.
stronger than their – CL counterparts. In both cases, the fast flow
resins withstand much higher flow rates according to the manufacturer’s specification, which may indicate that their cross-linking
was more extensive. Scanning electron micrographs were obtained
to show the structural properties of each resin, which were used to
ascertain whether polymer structure is indicative of mechanical
strength. Their micrographs show that they are structurally different (Fig. 5). SCL6B, for example, appears to be more fibrous and
134
M.C. Nweke et al. / J. Chromatogr. A 1530 (2017) 129–137
Fig. 6. Schematic of DMA methodology. The lid is equipped with a sensor that records the initial height of the sample. When the methodology is started the descending lid
applies a sinusoidal force of 100 mN to the sample, causing the slurry to deform and move around the sides of the lid. Strain (slurry displacement) is recorded with time. A
strain versus time plot is generated by the Pyris Manager software and the slope of the line before ultimate compression determines the slurry deformation rate.
more discontinuous compared to its fast flow counterpart which
has a more homogenous, continuous structure, which may indicate greater mechanical strength. It should be noted that the cited
literature plots [14], [15] depict axes with varying metrics. These
citations are used to describe the method by which pressure-flow
characterisation was carried out in this study. GE Healthcare data
sheets depict similar profiles to the ones obtained in this study
[25], [26]. Differences in critical velocity values reported in this
study may be attributed to different packing techniques in the
different columns used [27]. The pressure-flow profiles obtained
by GE Healthcare use production scale columns (AxiChrom, BPG)
and mainly pack-in-place and axial mechanical compression packing, whilst this study uses lab-scale XK16 columns under the flow
packing technique. It is worth highlighting that the most critical
aspect of this study is that the same batch of resins were used in
the application of all techniques reported in this study.
3.2. Dynamic mechanical analysis (DMA)
This technique characterises mechanical properties based on
the viscoelasticity of a small sample of resin. Conventional DMA is
used to characterise homogeneously shaped biomaterials to determine elastic properties such as Young’s modulus [17] however, we
have adapted the technique such that it characterises the properties of a slurry. The equipment is composed mainly of a pan and a
lid, equipped with sensors. The lid in particular is equipped with
a sensor that allows it to stop just at the surface of the slurry
once in descent. When the methodology is started, a sinusoidal
force is applied at a constant frequency. As the lid descends, the
slurry moves around the sides of the lid and this movement is
recorded as a displacement percentage with time. Meanwhile, a
time-strain profile is generated, where strain is the displacement
of the lid through the resin bed recorded as a percentage. Once a
strain threshold is exceeded, the rate of increase is vastly reduced
or the plot begins to level out completely and at this point ultimate
compression is reached. This is either when the lid has hit the bottom of the pan, or when little or no further deformation of the slurry
can be achieved with constant force. For consistency, the slope of
the line is taken before ultimate compression and this provides
information about the movement of the lid through the slurry with
constant force. A strain versus time plot is generated by the Pyris
Manager software and the slope of the line before ultimate compression determines the slurry deformation rate. The slope of the
line is manually fitted from the origin to the point before ultimate
compression using the in-built slope function in the Pyris Manager
software. The units are recorded as%/min (Fig. 6). The less viscous
the media is, the quicker the lid will move through the slurry, therefore the higher the% strain per minute. The procedure is repeated
3 times for each resin (Fig. 7).
Fig. 8a shows the slurry deformation rates for each resin using
the DMA technique. Capto Q has the slowest slurry deformation
rate at 0.36%/min, followed by MabSelect – 0.55%/min, Q-Sepharose
HP and Sepharose 6FF – 1.1%/min, Sepharose CL–6 B – 1.7%/min,
Sepharose 4 FF – 2.5%/min and Sepharose CL–4 B – 3%/min.
Fig. 8b shows the graph obtained by plotting the reciprocal of
the SDR values for each resin. The resulting parameter was termed
‘slurry resistance (1/%min−1 )’. This was done to more clearly show
the trend between the pressure-flow technique and the DMA
technique with particular focus on the gap between the more
mechanically robust resins and the weaker resins. The results show
Capto Q has the highest slurry resistance of 2.8, followed by MabSelect − 1.81, Q-HP and S6FF − 0.90, SCL6 B − 0.59, S4FF − 0.4 and
SCL4 B − 0.3.
The same trends observed in Fig. 3 are observed in Fig. 8b. The
results from Fig. 8b show that Capto Q is most resistant to deformation, followed by MabSelect, Q-Sepharose High Performance and
Sepharose 6 Fast Flow, Sepharose CL-6B, Sepharose 4 Fast Flow
and Sepharose CL-4B. Similar to the trends observed in section
3.1, the results also show that Q-Sepharose High Performance and
Sepharose 6 Fast Flow exhibit very similar viscoelastic properties.
Both resins contain 6% agarose however there are differences in
their average bead sizes and pore sizes. Pore size is influenced by a
number of factors, including the extent of cross linking which influences mechanical rigidity [1]. This becomes of relevance when the
beads move past each other through the gaps as the lid descends
and the gap size of 500 m is large enough such that it does not
allow for radial restriction/compression of single beads. The tradeoff between the fact that Q-HP has a larger average pore size than
S6FF, but S6FF has a larger bead size range, would mean that there
are fewer S6FF beads for the same given volume. This could explain
M.C. Nweke et al. / J. Chromatogr. A 1530 (2017) 129–137
135
Fig. 7. (a) Strain v time plot for 3 repeats of Sepharose CL–4 B (4% cross-linked agarose) (one solid line, one dashed line, one dotted line). (b) Averages of 3 out of 7 resins –
Capto Q (7% highly cross-linked agarose) (circles) – SDR 0.36%/min, Sepharose 6FF (6% cross-linked agarose) (squares) − SDR 1.1%/min and Sepharose CL–4 B (4% cross-linked
agarose) (triangles) – SDR 3%/min. Error bars representing strain are standard deviations taken from the 3 repeats of each resin. An error bar is plotted once every 250 data
points.
Fig. 8. (a) SDR for all 7 resins. For all resins, the slope of the lines for all three repeats are taken and averaged. The bar represents the average value and the error bars
are standard deviations based on the three repeats. Capto Q has the slowest slurry deformation rate at 0.36%/min, followed by MabSelect − 0.55%/min, Q-Sepharose HP
and Sepharose 6FF − 1.1%/min, Sepharose CL–6 B − 1.7%/min, Sepharose 4 FF − 2.5%/min and Sepharose CL–4 B – 3%/min. (b) Parity plot − Slurry resistance. The values
are obtained by calculating 1/SDR values obtained for all 7 resins. This can then be better compared to Fig. 4. Capto Q has the highest slurry resistance of 2.8, followed by
MabSelect − 1.81, Q-HP and S6FF − 0.90, SCL6 B − 0.59, S4FF − 0.4 and SCL4 B − 0.3.
Fig. 9. (a) SDR values shown in Fig. 8(a) plotted against ucrit values shown in Fig. 4. Plot shows strong negative trend (b) Parity plot showing slurry resistance. Slurry resistance
values are calculated as 1/SDR. Plot shows strong positive trend. 1- Sepharose CL-4B, 2- Sepharose 4 Fast Flow, 3 – Sepharose CL-6B, 4–Sephrose 6 Fast Flow, 5–Q-Sepharose
High Performance 6–MabSelect, 7–Capto Q.
136
M.C. Nweke et al. / J. Chromatogr. A 1530 (2017) 129–137
why the two resins have similar SDR values. The results also show
the differences in viscoelastic properties between SCL6 B and S6FF,
as well as SCL4 B and S4FF. Further explanations for the observed
trends are outlined in Section 3.1. The data from Figs. 4 and 8 are
plotted to establish a trend (Fig. 9).
3.3. Data correlation – pressure-flow vs dynamic mechanical
analysis
Fig. 9a shows a strong negative correlation between critical
velocity and slurry deformation rate for all 7 resins used in this
study. This means that the stronger resins such as MabSelect and
Capto Q have low SDRs and high ucrit values and the opposite is true
for mechanically weaker resins such as SCL4 B and S4FF. The trend
begins in a linear fashion with the first five resins but then tails off
when the more mechanically robust resins appear. This representation of results indicates that as the resins become mechanically
more similar and the difference in mechanical properties becomes
less significant.
Fig. 9b shows a parity plot of Fig. 9a and the y-axis is represented
as ‘slurry resistance’. The values are calculated based on 1/SDR for
each resin. The trend observed is a positive polynomial trend for
slurry resistance against critical velocity. The first 5 resins show a
gradual increase in mechanical resistance, however, the difference
in mechanical strength becomes more apparent when the more
robust resins (MabSelect and Capto Q) are plotted. This plot better demonstrates the disparity in mechanical behaviour between
each resin and depicting the data in this way correlates positively
with the pressure-flow data and is more easily comparable. Both
plots show that DMA can be used as a combinatory technique to
pressure-flow for the characterisation of chromatography media.
DMA has shown additional benefits in its use for resin characterisation. It allows for the use of small quantities of sample (∼1 ml)
and requires relatively little preparation. The low force of 100 mN
applied in a sinusoidal manner is non-destructive to the media
over an extended period of time (80 min). Given these advantages,
it can potentially be used to investigate the mechanical properties of other media types, e.g. non-agarose based resins. It may
also be used in the development of new resins for rapid testing
post-emulsification.
4. Conclusion and potential applications
Currently, manufacturers use the pressure-flow characterisation technique to decipher mechanical limits of chromatography
media by packing columns up to many litres in size. This is not
only costly, but it is also time-consuming in its preparation and
it requires a number of buffers to be used. We have developed a
DMA technique that does not require the use of multiple buffers
and uses a much reduced quantity of resin. The development
of this technique considered a number of factors also associated
with pressure-flow characterisation, including bead size, pore size
and slurry concentration. This technique was tested on seven
resins with varying mechanical properties and compared to their
pressure-flow characteristics. The results show a strong correlation between both techniques. Using the pressure-flow method, the
most robust resin (Capto Q) had a critical velocity 3.3 times higher
than Sepharose CL-4B, whilst the DMA technique showed Capto Q
to have a slurry deformation rate 8.3 times lower than Sepharose
CL-4B. This could be due to increased sensitivity of mechanical
changes as the sample volume used for DMA is much smaller than
that of pressure-flow. This correlation indicates that DMA can be
used as a combinatory technique for determining mechanical performance of a given resin. Although additional tests can always
be performed to increase confidence in its application to other
media types, the results from this study show definitive correlations between the two techniques for agarose-based resins. The
correlation further suggests that DMA may be applied to predict
pressure-flow characteristics. This technique may also be useful
for rapid testing of a range of resins post-emulsification and during
the development of new resins. Furthermore, it may also be used
to test resins exposed to different conditions in the column as well
as at different stages of its lifetime during bioprocessing. It may
also be considered to investigate the impact of exposure to varying
mechanical stresses during operation of large-scale chromatography.
Acknowledgments
This work was supported by theEPSRC, Eli Lilly & Co., UCL
Eastman Dental Instituteand UCL Department of Biochemical Engineering. The support is gratefully acknowledged.
References
[1] N. Ioannidis, Manufacturing of Agarose-based Chromatographic Media with
Controlled Pore and Particle Size, University of Birmingham, 2009.
[2] G. Jagschies, G. Sofer, L. Hagel, Handbook of Process Chromatography –
Development, Manufacturing, Validation and Economics, 2nd ed., Elsevier,
2008.
[3] M. Andersson, Characterisation of Chromatography Media Aimed for
Purification of Biomolecules, Uppsala Universitet, 2014.
[4] A. Jungbauer, Chromatographic media for bioseparation, J. Chromatogr. A
1065 (1) (2005) 3–12.
[5] A. Gerstein, Molecular Biology Problem Solver: A Laboratory Guide, 2nd ed.,
Wiley, 2004.
[6] Y. Mu, A. Lyddiatt, A.W. Pacek, Manufacture by water/oil emulsification of
porous agarose beads: effect of processing conditions on mean particle size,
size distribution and mechanical properties, Chem. Eng. Process. Process
Intensif. 44 (10) (2005) 1157–1166.
[7] Q.-Z. Zhou, L.-Y. Wang, G.-H. Ma, Z.-G. Su, Multi-stage premix membrane
emulsification for preparation of agarose microbeads with uniform size, J.
Membr. Sci. 322 (1) (2008) 98–104.
[8] Q.-Z. Zhou, G.-H. Ma, Z.-G. Su, Effect of membrane parameters on the size and
uniformity in preparing agarose beads by premix membrane emulsification, J.
Membr. Sci. 326 (2) (2009) 694–700.
[9] Y. Yan, Z. Zhang, J.R. Stokes, Q.Z. Zhou, G.H. Ma, M.J. Adams, Mechanical
characterization of agarose micro-particles with a narrow size distribution,
Powder Technol. 192 (1) (2009) 122–130.
[10] N. Ioannidis, J. Bowen, A. Pacek, Z. Zhang, Manufacturing of agarose-based
chromatographic adsorbents – effect of ionic strength and cooling conditions
on particle structure and mechanical strength, J. Colloid Interface Sci. 367 (1)
(2012) 153–160.
[11] K. Keller, T. Friedmann, A. Boxman, The bioseparation needs for tomorrow,
Trends Biotechnol. 19 (11) (2001) 438–441.
[12] A. Ellis, J.C. Jacquier, Manufacture and characterisation of agarose
microparticles, J. Food Eng. 90 (2) (2009) 141–145.
[13] P. Gavara, N. Bibi, M. Sanchez, M. Grasselli, M. Fernandez-Lahore,
Chromatographic characterization and process performance of
column-packed anion exchange fibrous adsorbents for high throughput and
high capacity bioseparations, Processes 3 (1) (2015) 204–221.
[14] J.J. Stickel, A. Fotopoulos, Pressure-flow relationships for packed beds of
compressible chromatography media at laboratory and production scale,
Biotechnol. Progr. 17 (4) (2001) 744–751.
[15] R. Tran, J.R. Joseph, A. Sinclair, D. Bracewell, Y. Zhou, N.J. Titchener-Hooker, A
framework for the prediction of scale-up when using compressible
chromatographic packings, Biotechnol. Progr. 23 (2) (2007) 413–422.
[16] T. Warner, S. Nochumson, Rethinking the economics of pensions, BioPharm
Int. 22 (3) (2003) 15–39.
[17] L. Moroni, J.R. De Wijn, C.A. Van Blitterswijk, 3D fiber-deposited scaffolds for
tissue engineering: influence of pores geometry and architecture on dynamic
mechanical properties, Biomaterials 27 (7) (2006) 974–985.
[18] T. Meyvis, B. Stubbe, A comparison between the use of dynamic mechanical
analysis and oscillatory shear rheometry for the characterisation of hydrogels,
Int. J. Pharm. 244 (2002) 163–168.
[19] M.C. Nweke, M. Turmaine, R.G. McCartney, D.G. Bracewell, Drying techniques
for the visualisation of agarose-based chromatography media by scanning
electron microscopy, Biotechnol. J. 12 (2016) 1600583.
[20] P. DePhillips, A. Lenhoff, Pore size distributions of cation-exchange
adsorbents determined by inverse size-exclusion chromatography, J.
Chromatogr. A 883 (2000) 39–54.
[21] C. Tarmann, A. Jungbauer, Adsorption of plasmid DNA on anion exchange
chromatography media, J. Sep. Sci. 31 (14) (2008) 2605–2618.
M.C. Nweke et al. / J. Chromatogr. A 1530 (2017) 129–137
[22] A.M. Hardin, C. Harinarayan, G. Malmquist, A. Axen, R. van Reis, Ion exchange
chromatography of monoclonal antibodies: effect of resin ligand density on
dymanic binding capacity, J. Chromatogr. A 20 (1216) (2009) 4366–4371.
[23] Q.-Z. Zhou, L.-Y. Wang, G.-H. Ma, Z.-G. Su, Preparation of uniform-sized
agarose beads by microporous membrane emulsification technique, J. Colloid
Interface Sci. 311 (1) (2007) 118–127.
[25] G.E. Healthcare, Packing MabSelect TM and MabSelect SuRe TM Media Using
Verified Methods, GE Healthcare, Uppsala, Sweden, 2015, pp. 110.
[26] J. Avallin, A. Nilsson, M. Asplund, N. Pettersson, T. Searle, C. Jägersten,
Columns Upto 1600 Mm in Diameter Packed with Protein A Chromatography
137
Medium Using Axial Mechanical Compression, GE Healthcare, Uppsala,
Sweden, 2016, pp. 291.
[27] M. Dorn, F. Eschbach, D. Hekmat, D. Weuster-Botz, Influence of different
packing methods on the hydrodynamic stability of chromatography columns,
J. Chromatogr. A (2017).
[28] L. Hagel, M. Ostberg, T. Andersson, Apparent pore size distributions of
chromatography media, J. Chromatogr. A 743 (1) (1996) 33–42.
[29] M. Barrande, et al., Characterisation of porous materials for bioseparation, J.
Chromatogr. A 1216 (41) (2009) 6906–6916.