In-line Fourier-transform infrared spectroscopy as a versatile process analytical technology for preparative protein chromatography
Bạn đang xem bản rút gọn của tài liệu. Xem và tải ngay bản đầy đủ của tài liệu tại đây (1.91 MB, 8 trang )
Journal of Chromatography A, 1547 (2018) 37–44
Contents lists available at ScienceDirect
Journal of Chromatography A
journal homepage: www.elsevier.com/locate/chroma
In-line Fourier-transform infrared spectroscopy as a versatile process
analytical technology for preparative protein chromatography
Steffen Großhans a,1 , Matthias Rüdt a,1 , Adrian Sanden a,1 , Nina Brestrich a ,
Josefine Morgenstern a , Stefan Heissler b , Jürgen Hubbuch a,∗
a
Institute of Engineering in Life Sciences, Section IV: Biomolecular Separation Engineering, Karlsruhe Institute of Technology, Fritz-Haber-Weg 2, Karlsruhe,
Germany
b
Institute of Functional Interfaces, Karlsruhe Institute of Technology, Hermann-von-Helmholtz-Platz 1, Eggenstein-Leopoldshafen, Germany
a r t i c l e
i n f o
Article history:
Received 20 October 2017
Received in revised form 19 February 2018
Accepted 4 March 2018
Available online 5 March 2018
Keywords:
Chromatography
Proteins
Process analytical technology (PAT)
Fourier-transform infrared spectroscopy
(FTIR)
Downstream processing
a b s t r a c t
Fourier-transform infrared spectroscopy (FTIR) is a well-established spectroscopic method in the analysis
of small molecules and protein secondary structure. However, FTIR is not commonly applied for inline monitoring of protein chromatography. Here, the potential of in-line FTIR as a process analytical
technology (PAT) in downstream processing was investigated in three case studies addressing the limits
of currently applied spectroscopic PAT methods. A first case study exploited the secondary structural
differences of monoclonal antibodies (mAbs) and lysozyme to selectively quantify the two proteins with
partial least squares regression (PLS) giving root mean square errors of cross validation (RMSECV) of
2.42 g/l and 1.67 g/l, respectively. The corresponding Q2 values are 0.92 and, respectively, 0.99, indicating
robust models in the calibration range. Second, a process separating lysozyme and PEGylated lysozyme
species was monitored giving an estimate of the PEGylation degree of currently eluting species with
RMSECV of 2.35 g/l for lysozyme and 1.24 g/l for PEG with Q2 of 0.96 and 0.94, respectively. Finally, Triton
X-100 was added to a feed of lysozyme as a typical process-related impurity. It was shown that the species
could be selectively quantified from the FTIR 3D field without PLS calibration. In summary, the proposed
PAT tool has the potential to be used as a versatile option for monitoring protein chromatography. It
may help to achieve a more complete implementation of the PAT initiative by mitigating limitations of
currently used techniques.
© 2018 The Authors. Published by Elsevier B.V. This is an open access article under the CC BY-NC-ND
license ( />
1. Introduction
Preparative chromatography of biopharmaceuticals is typically
monitored by measuring univariate signals such as pH, conductivity, pressure, and UV/Vis absorbance at a given wavelength [1,2].
Among these, especially single-wavelength UV/Vis spectroscopy
has been a staple for process monitoring of biopharmaceutical
chromatography due to its linear response to protein concentration as well as its broad dynamic range, sensitivity, and robustness.
In spite of advantages, single-wavelength UV/Vis absorption measurements generally do not allow for selective quantification of
multiple co-eluting proteins [3].
Even before the PAT initiative by the FDA in 2004 [4], research
towards more selective monitoring methods for preparative chro-
∗ Corresponding author.
E-mail address: (J. Hubbuch).
1
These authors contributed equally to this work.
matography was conducted. But the often small differences
between biopharmaceutical product and protein as well as nonprotein contaminants make this a nontrivial task [5,6]. As a possible
solution, fast at- or on-line analytical methods, such as analytical chromatography, have been established. Discrete samples are
taken from the process stream and analyzed on the spot. This
approach has been proposed for controlling capture [7–9] and
polishing steps [10,11]. However, at- or on-line analytical chromatography is complex in terms of equipment requiring a sampling
module as well as an analytical chromatography system close to the
process stream. Furthermore, the sampling and analysis time may
be too long compared to the typical time frame available for taking
process decisions.
An alternative approach exploits slight differences in UV/Vis
absorption spectra of different components to selectively quantify
different species by chemometric methods [6]. The approach yields
results quickly enough to allow for real-time process decisions in
chromatography [12–14] and works for minute spectral differences
[15]. However, in the commonly measured spectral ranges, UV/Vis
/>0021-9673/© 2018 The Authors. Published by Elsevier B.V. This is an open access article under the CC BY-NC-ND license ( />0/).
38
S. Großhans et al. / J. Chromatogr. A 1547 (2018) 37–44
spectroscopy lacks sensitivity towards relevant aspects of protein structure, notably the secondary structure [16]. Furthermore,
organic compounds are often not UV-active (e.g. sugars, polyols,
and Polyethylene Glycol [PEG][17,18]) or they may obscure the protein signal (e.g. Triton X-100 [19] and benzyl alcohol [16]). Due to
the high sensitivity, UV/Vis absorption spectroscopy is also prone
to detector saturation [6,20].
FTIR allows to address several of these short-comings. Like
UV/Vis spectroscopy, FTIR is a non-destructive, quantitative, and
quick method which can be performed in-line [21–23]. FTIR measures the vibrational modes of samples and thereby provides
a spectroscopic fingerprint for different organic molecules. Proteins absorb in the IR spectral range mainly due to vibrations
of the polypeptide backbone [24,16,25]. Based on the backbone
vibrations, FTIR grants insight into the secondary structure of the
measured proteins. In consequence, FTIR is a widely used method
for assessing the structural integrity of proteins during protein
purification and formulation [16]. Furthermore, FTIR was previously used as an at-line PAT tool in downstream processing of
biopharmaceuticals for quantifying product content, high molecular weight species (HMW), and host cell proteins (HCP) [26,27].
In this work, in-line FTIR as a PAT tool for preparative protein
purification was implemented. An FTIR instrument was coupled
to a lab-scale preparative chromatography system to perform the
experiments. Three case studies were selected to investigate potential applications of FTIR as a PAT tool. First, a mixture of lysozyme
and mAb was chosen due to the significant differences in secondary
structure of the two proteins. While lysozyme mainly consists of
alpha-helices (PDB ID 193L), mAb largely consists of beta-sheets
(PDB ID 1HZH). The expected spectral differences can be used to
selectively quantify the two proteins by PLS regression. Four lineargradient elutions with varying gradient lengths were performed.
Based on the results, a PLS model for each protein was optimized.
The error of the PLS model was assessed by cross validation. Second,
the preparative separation of PEGylated lysozyme was monitored.
In contrast to UV/Vis spectroscopy, PEG gives a distinct signal in
IR which can be used for quantification by PLS regression. Again,
four linear gradient elutions were performed for the calibration of
two PLS models. Finally, the potential to monitor process-related
impurities using in-line FTIR was demonstrated by adding Triton
X-100 to a feed solution of lysozyme. Triton X-100 is employed for
virus inactivation in biopharmaceutical production and has to be
removed from the product [19,28]. Based on an off-line calibration
curve, mass-balancing of Triton X-100 in the flow-through during
product loading was performed.
2. Materials and methods
2.1. Experimental setup
In-line FTIR measurements were performed using a Tensor 27 by
Bruker Optics (Ettlingen, Germany) connected to an ÄKTApurifier
system by GE Healthcare (Little Chalfort, UK). The chromatography
system was equipped with a P-900 pump, a P-960 sample pump,
UV-900 UV/Vis cell, and a Frac-950 fraction collector (all GE Healthcare). Unicorn 5.31 (GE Healthcare) was used to control the system.
The FTIR was equipped with a liquid nitrogen-cooled Mercury Cadmium Telluride (MCT) detector and a BioATR II (Bruker Optics)
with a flow-cell insert and a seven-reflections silicon crystal. The
instrument was controlled by OPUS 7.2 (Bruker Optics).
In this setup, the effluent stream from the column outlet was
diverted through the FTIR instrument and then back into the UV/Vis
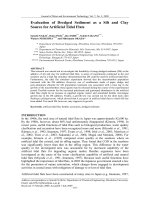
cell in the ÄKTApurifier system. The flowpath is illustrated in Fig. 1.
The delay volume between the FTIR and the fraction collector
was determined gravimetrically. As the flow rate was set in the
Fig. 1. Schematic representation of the flow path in the custom chromatography
setup, solid lines represent the common flow path in the ÄKTApurifier while the
dashed line represents the modification.
chromatographic methods, the measurement of the delay volume
enables the correlation of spectral data from the FTIR to collected
fractions.
The interconnection between OPUS and Unicorn was achieved
using a software solution developed in-house consisting of a Matlab
(The Mathworks, Natrick, MA, United States) script and a VBScript
in the built-in visual basic script engine of OPUS. The custom software enables start of a measurement at a time defined by Unicorn
by sending a digital signal through the I/O port of the pump of the
ÄKTApurifier System. The signal is captured by a USB-6008 data
acquisition device (National Instruments, Austin, Tx, United States)
controlled by Matlab which in turn triggers the measurement in
OPUS.
2.2. Proteins and buffers
All solutions were prepared using water purified by a PURELAB
Ultra water purification system by ELGA Labwater (High Wycombe,
United Kingdom). Buffers were filtered using a 0.2 m filter purchased from Sartorius (Göttingen, Germany) and degassed by
sonification before use. All buffers were pH-adjusted using 32% HCl
(Merck, Darmstadt, Germany).
Lysozyme was purchased from Hampton Research (Aliso Viejo,
CA, United States). mAb was provided by Lek Pharmaceuticals d.d.
(Mengeˇs, Slovenia) as a virus-inactivated Protein A eluate pool.
Preparative CEX chromatography runs in case studies I and III
were conducted with a 50 mM sodium citrate buffer as equilibration buffer and with an added 500 mM NaCl as elution buffer. Both
buffers were adjusted to pH 6.0. Sodium citrate tribasic dihydrate
was purchased from Sigma-Aldrich (St. Louis, MO, United States),
sodium chloride was purchased from Merck. For the CEX chromatography experiments in case study II, a 25 mM sodium acetate
buffer (pH 5.0) was used as equilibration buffer. As elution buffer, a
25 mM sodium acetate buffer with 1 M NaCl (pH 5.0) was used.
Sodium acetate trihydrate was purchased from Sigma-Aldrich.
Batch-PEGylation of lysozyme was performed in a 25 mM sodium
phosphate buffer at pH 7.2 using sodium phosphate monobasic dihydrate (Sigma-Aldrich) and di-sodium hydrogen phosphate
dihydrate (Merck).
Analytical cation-exchange chromatography was carried out at
pH 8.0 using a 20 mM Tris (Merck) buffer for equilibration and a
20 mM Tris buffer with 700 mM NaCl for elution.
2.2.1. PEGylation of lysozyme
The PEGylation protocol was adapted from [29]. Briefly, activated 5 kDa PEG was purchased as Methoxy-PEG-propionaldehyde
(mPEG-aldehyde, Sunbright ME-050 AL) from NOF Corporation (Tokyo, Japan). Sodium cyanoborohydride (NaCNBH3 , Sigma
Aldrich) was added to the reaction buffer to a concentration of
20 mM as reducing agent. mPEG-aldehyde was added to a molar
PEG-to-protein ratio of 6.67. After 3 h, the mixture was diluted vol-
S. Großhans et al. / J. Chromatogr. A 1547 (2018) 37–44
umetrically 7-fold using the acetate equilibration buffer and loaded
onto the chromatography column.
2.3. Preparative chromatography experiments
For all chromatography experiments, FTIR spectra were
recorded continuously in the chromatography mode of OPUS with
a resolution of 2 cm−1 in a range from 4000 cm−1 to 900 cm−1 without averaging multiple scans. In the given setup, each measurement
took 3.22 s. Background measurements at the beginning of chromatographic runs were taken at the same resolution with 400 scans
in equilibration buffer. All experiments were conducted twice, once
with protein injection and once with buffer only as a blank run.
The FTIR spectra from the blank runs were subsequently subtracted
from the protein runs to account for spectral effects by the gradient.
2.3.1. Case study I: selective protein quantification
For case study I, a HiTrap column by GE Healthcare prepacked
with SP Sepharose FF resin (Column Volume [CV] 5 ml) was used.
The column was loaded to a density of 18.75 g/l, consisting of
12.5 g/l lysozyme and 6.25 g/l monoclonal antibody. The flow rate
for all experiments was set to 0.5 ml/min. The column was equilibrated in a low-salt buffer for 5 CV before injection. The 50 ml
sample was injected using a 50 ml superloop from GE Healthcare.
Elution was carried out with a linear gradient from 0% to 100%
high-salt buffer with gradient lengths of 1 CV, 2 CV, 3 CV, 4 CV. After
elution, a high-salt wash of 8 CV was performed for column regeneration. The effluent was collected over the complete injection and
elution in 500 l fractions for offline analytics.
2.3.2. Case study II: separation of pegylated lysozyme species
The experiments with different PEGylated lysozyme species
were conducted with Toyopearl Gigacap S-650M resin prepacked
in a MiniChrom column (CV 5 ml) by Tosoh (Griesheim, Germany).
The column was loaded to a density of 50 g/l of the heterogeneous
batch PEGylation. The sample pump was run at 1 ml/min for loading. For the remaining chromatography run, the flow rate was set to
0.5 ml/min. The column was first equilibrated for 1 CV, followed by
an injection of 57.6 CV of sample solution. Linear-gradient elutions
from 0% to 100% high-salt buffer were conducted with gradients of
2 CV, 3 CV, 4 CV and 5 CV length, followed by a 2 CV high-salt rinse.
The effluent was collected from the beginning of the gradient until
the end of the high-salt rinse in 500 l fractions for offline analytics.
In some of the collected fractions, unconjugated lysozyme
started to precipitate after elution probably due to the low pH,
high salt concentration or low temperature [30,29]. Fractions and
the corresponding spectra showing signs of precipitation were
excluded from PLS model calibration.
2.3.3. Case study III: process-related impurity
For the simulated process-related impurity experiments, a
HiTrap column by GE Healthcare prepacked with SP Sepharose FF
resin (CV 5 ml) was used. Triton X-100 Biochemica was purchased
from AppliChem GmbH (Darmstadt, Germany). The column was
loaded with 5 ml of 25 g/l lysozyme and 10 g/l Triton X-100 solution
[28]. The elution step was set to 2 CV.
Reference samples were generated by diluting defined amounts
of Triton X-100 in equilibration buffer at concentrations from
1.25 g/l to 10 g/l. To generate a calibration curve, the samples were
manually applied onto the ATR crystal. FTIR measurements were
performed with 400 scans for background and samples.
2.4. Analytical CEX chromatography
As reference analytics for case study I, analytical CEX chromatography was performed using a Dionex UltiMate 3000 liquid
39
chromatography system by Thermo Fisher Scientific (Waltham,
MA, United States). The system was composed of a HPG-3400RS
pump, a WPS-3000TFC analytical autosampler, a TCC-3000RS column thermostat, and a DAD3000RS detector. The system was
controlled by Chromeleon 6.80 (Thermo Fisher Scientific). Fractions
from preparative CEX chromatography were analyzed off-line on
a Proswift SCX-1S 4.6 mm × 50 mm column by Thermo Fisher Scientific. A flow rate of 1.5 ml/min was used. For each sample, the
column was first equilibrated for 1.8 min with equilibration buffer.
Next, 20 l sample was injected into the system and washed for
0.5 min with equilibration buffer. A linear gradient was performed
during the next 2 min from 0% to 50% followed by a step to 100%
elution buffer which was maintained for 2 min.
For the experiments in case study II, a Vanquish UHPLC system
(Thermo Fisher Scientific) was used. The Vanquish UHPLC System
consisted of a Diode Array Detector HL, a Split Sampler FT, a Binary
Pump F, and a Column Compartment H including a preheater and
post-column cooler (all Thermo Fisher Scientific). The same buffers,
column, and flow rate were used as for case study I. After injecting
5 l of sample, the column was washed for 0.5 min. Subsequently, a
bilinear gradient was performed from 0% to 50% elution buffer over
5 min and 50–100% elution buffer over 1.75 min. After the elution,
a high-salt strip at 100% was run for 1 min. Calibration was performed by a dilution series of pure lysozyme. Since PEG does not
absorb in UV/Vis, solely lysozyme contributes to the absorption signal. Peak identification with respect to the PEGylation degree was
conducted using purified samples prepared according to [18]. From
the molar concentration of PEGylated lysozyme species, the molar
concentration of PEG was calculated.
2.5. Data analysis
All data analysis was performed in Matlab. For case studies I and
II, the data was first preprocessed and subsequently fitted with PLS1 models by the SIMPLS algorithm [31]. Preprocessing consisted of
linearly interpolating off-line analytics to be on the same time scale
as the FTIR spectra. For case studies I and II, spectral data above
2000 cm−1 resp. above 3100 cm−1 was discarded. Next, a SavitzkyGolay filter with a second-order polynomial was applied on the
spectra and optionally, the first or second derivative was taken [32].
Cross-validation was performed by excluding one chromatography
run, calibrating a PLS model on the remaining runs, and calculating
a residual sum of squares on the excluded run. This procedure was
repeated until all runs had been excluded once. All residual sums
of squares for the different submodels were subsequently summed
yielding the Predictive Residual Sum of Squares (PRESS). The PRESS
was scaled according to Wold et al. by the number of samples and
latent variables used in the PLS model [33]. Based on the scaled
PRESS, an optimization was performed using the built-in genetic
algorithm of Matlab for integers [34]. The genetic algorithm optimized the window width of the Savitzky-Golay filter, the order of
derivative, as well as the number of latent variables for the PLS1 model. The RMSECV was calculated from the PRESS by dividing
by the total number of samples. The Q2 values were calculated by
dividing the PRESS by the summed squares of the response corrected to the mean [33].
For case study III, spectral data was smoothed both in direction of time and wavenumber using a Savitzky-Golay filter with
a second-order polynomial and a frame length of 17 and 51,
respectively. A linear baseline was calculated and subtracted for
each spectrum individually to account for a non-horizontal nonzero baseline. The baseline subtraction was performed on the
reference spectra as well as on the spectra from the chromatography experiment. Based on the area under the spectrum between
wavenumbers 1007–1170 cm−1 , a mass balance for Triton X-100
was calculated from the spectral data of the chromatography run.
40
S. Großhans et al. / J. Chromatogr. A 1547 (2018) 37–44
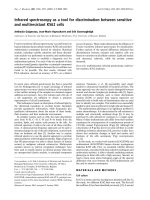
Fig. 2. Work flow for data treatment of chromatography spectra illustrated with data from case study I, 4 CV run: background run – salt gradient without protein (A); raw
spectra of the run with protein (B); spectral data after the background has been subtracted (C); data after smoothing by Savitzky–Golay algorithm (D).
The volume represented by each spectrum was calculated from the
recording time and the volumetric flow rate of the experiment. Triton X-100 masses in each segment were calculated utilizing the
calibration curve and summed up over time.
3. Results and discussion
In-line FTIR measurements were applied as a PAT tool for different preparative chromatographic protein separations. In three
different case studies, FTIR was used for selective quantification
of different species. First, background correction of the FTIR chromatograms is discussed which was necessary for further data
processing. In a first case study, the capability of FTIR to measure
differences in secondary structure in-line and utilize the differences
for selective quantification of mAb and lysozyme was demonstrated. A second case study made use of the absorption of PEG in
IR to monitor the PEGylation degree of eluting PEGylated lysozyme
species. Finally, the third case study used the selectivity of FTIR to
selectively quantify Triton-X 100, a detergent used for viral inactivation.
3.1. Background subtraction and spectral preprocessing
Background subtraction for in-line FTIR measurements is of
major importance as water has an absorption band around
1600 cm−1 (cf. Fig. 2A) which coincides with the most prominent
protein band amide I. The spectral processing workflow is illustrated in Fig. 2 using data from case study I. Specifically the elution
of mAb and lysozyme using a 4 CV gradient is shown. Most of the
water absorption can be eliminated by taking a background with
the equilibration buffer at the beginning of each chromatographic
run. The water band is, however, also influenced by the salt content of the buffer around 1650 cm−1 . Salt gradients therefore cause
a change in absorption over the run (cf. Fig. 2A and B). To reduce
buffer effects, it is important to find a suitable dynamic background
correction. An approach based on reference spectra matrices and
chemometric correlations was not implemented due to the overlap
of water and protein bands [35]. Instead, an alternative approach
was chosen. Based on the retention time, a blank run without protein but including the salt gradient was subtracted from the actual
preparative run (cf. Fig. 2C). The resulting chromatogram provided
a smooth baseline over the whole experiment. After baseline correction, additional data preprocessing was performed. The single
scan spectra were smoothed by a Savitzky-Golay filter to reduce
random noise (cf. Fig. 2D) and to take derivatives on the spectral
data.
3.2. Case study I: selective protein quantification
mAb and lysozyme feature significant differences in secondary
structure. While mAb consists largely of beta-sheets (PDB ID 1HZH),
lysozyme mainly contains alpha-helices (PDB ID 193L). These differences make the two proteins simple model components to study
the performance of in-line FTIR for selectively quantifying proteins.
The bands visible between 1200 cm−1 and 1700 cm−1 in Fig. 2D
are characteristic amide bands associated with the protein backbone [16,24,25]. Especially the amide I band is frequently used for
assessing the secondary structure of proteins. For PLS calibration, all
wavenumbers below 2000 cm−1 were taken into account to include
all protein bands without interference at the boundary due to the
Savitzky-Golay filter.
Based on four CEX runs, two PLS-1 models were optimized for
selective quantification of mAb and lysozyme, respectively. The
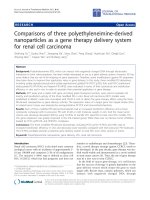
resulting model parameters are listed in Table 1. Fig. 3 shows a
comparison from off-line analytics and the prediction of PLS models. Both PLS models match peak maxima and peak widths well and
are able to discern the two components. For mAb, a root-meansquare error of cross validation (RMSECV) of 2.42 g/l was reached.
For lysozyme, the RMSECV was 1.67 g/l. The corresponding Q2 values were 0.92 and 0.99, respectively. The high Q2 values show, that
a large part of the variation in the off-line concentration measurements could be explained by the PLS model. The differentiation
S. Großhans et al. / J. Chromatogr. A 1547 (2018) 37–44
Table 1
Model parameters for case studies I and II are listed below including the parameters
for the Savitzky–Golay filter and the latent variables of the PLS-1 model. Additionally, the RMSECV for each model is listed.
Savitzky–Golay Window
Derivative
Latent variables
RMSECV (g/l)
Case study I
Case study II
mAb
lysozyme
lysozyme
PEG
215
0
3
2.41
21
0
7
1.63
101
2
6
2.35
361
2
8
1.24
Fig. 3. Four chromatographic runs are shown for in-line FTIR measurements and
selective quantification of mAb and lysozyme. The red bars and lines refer to the mAb
off-line measurement and mAb PLS prediction, respectively. The blue bars and lines
refer to the lysozyme off-line measurement and lysozyme PLS prediction, respectively. The different subplots show different gradient lengths: A 1 CV, B 2 CV, C 3 CV,
D 4 CV. (For interpretation of the references to color in this figure legend, the reader
is referred to the web version of the article.)
between different proteins may however become more challenging for smaller differences in secondary structure. Interestingly, the
combination of Savitzky-Golay filtering and PLS modeling allowed
to reduce the measurement noise compared to single-wavelength
measurements. As shown by Figs. 2C and 3, the measurement noise
in the IR spectra is higher than the noise observed in the PLS prediction. By filtering and projecting the spectra to latent variables,
random noise is reduced [32,33]. Furthermore, 3.23 s measurement time makes FTIR quick enough for monitoring most practical
preparative chromatography applications in real-time. In-line FTIR
spectroscopy allowed to cover high concentration ranges. The predicted concentration of lysozyme during the 1 CV run reaches
112 g/l without any interference from detector saturation. The
measurement setup therefore covers all concentrations typically
occurring in preparative protein chromatography.
In summary, the results show that FTIR in conjunction with PLS
modeling can differentiate in-line between proteins based on their
secondary structure and has the potential to be applied for realtime monitoring and control of preparative chromatography.
41
3.3. Case study II: separation of PEGylated lysozyme species
In conventional chromatography systems, the separation of differently PEGylated species cannot be monitored holistically as PEG
does not absorb in UV. Contrary to this, PEG produces a number
of prominent bands in IR. A strong band around 1090 cm−1 with
multiple shoulders is characteristic of C–O stretching [36]. Due to
symmetric CH2 stretching, PEG furthermore generates a doublet
at 2884 cm−1 and 2922 cm−1 . Bands occurring between 1200 cm−1
and 1700 cm−1 are related to the protein backbone with some interference from PEG C–H bending.
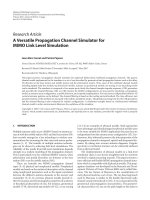
Fig. 4 shows a typical chromatographic separation of PEGylated
lysozyme species. During the elution, the ratio between PEG and
protein bands decreases. First, with a retention volume of 6.8 ml,
the absorption of the C–O band at 1090 cm−1 (denoted as CO1 in
Fig. 4) exceeds the absorption of amide I band (AI1 ). For the second peak with a retention volume of 10.3 ml, the absorption of the
amide I (AI2 ) is higher than for the C–O stretching band (CO2 ). The
last peak does not show characteristic PEG bands, i.e. consists of
unconjugated lysozyme. The order of elution followed a descending degree of PEGylation which is in line with previous publications
[18,37,38].
Based on the evaluation of IR absorption bands, it was decided
to include all wavenumbers from 900 cm−1 to 3100 cm−1 into PLS
model calibration. Initial PLS calibration on the concentration of
the different PEGylated lysozyme species showed that the conjugation did not cause large enough band shifts to allow for selective
quantification of the different PEGylated lysozyme species. Instead,
two PLS models were fitted on the total PEG resp. lysozyme concentration independently. PEG concentration was calculated by
weighting the off-line lysozyme concentration according to the
PEGylation degree. In Table 1, the optimization results are summarized. Fig. 5 compares the PLS prediction with off-line analytics.
RMSECV values of 1.24 g/l and 2.35 g/l were reached for the PEG and
lysozyme concentration, respectively. The corresponding Q2 values were respectively 0.96 and 0.94 showing that the PLS models
predicted the responses well. Based on the PEG and lysozyme concentrations, a molar ratio could be calculated corresponding to the
current average PEGylation degree. To simplify visual interpretation, the molar ratio was only plotted if the lysozyme concentration
exceeded its RMSECV 3-fold.
The predicted PEG and lysozyme concentrations accurately
followed the concentrations measured by off-line analytics. Furthermore, the molar ratio gives a suitable tool for in-line monitoring
of the elution of different PEG species. Interestingly, the two PLS
models are able to extend their prediction over the calibration
range, i.e. to perform a weak extrapolation. This can be seen as the
PEG-to-lysozyme ratio exceeds the value of two, which limits the
calibration range spanned by off-line analytics. Higher PEGylated
species of lysozyme do however occur and could be measured by
the FTIR [18,39].
In summary, FTIR allows to monitor not only the protein and PEG
concentration but also the PEGylation degree during chromatographic separations.
3.4. Case study III: quantification of a process-related impurity
Triton X-100 is used for viral inactivation of biopharmaceuticals if pH treatment has to be circumvented, e.g. for Factor VIII or
pH-sensitive mAbs [19,28]. To achieve viral inactivation, Triton X100 concentration needs to be above a minimal level. Typically, a
concentration of 1% (w/V) is used. Here, Triton X-100 concentration of a mock virus inactivation batch was monitored during the
subsequent load phase onto a chromatographic column. During the
chromatographic run, in-line FTIR measurements were perform (cf.
Fig. 6).
42
S. Großhans et al. / J. Chromatogr. A 1547 (2018) 37–44
Fig. 4. Elution of PEGylated lysozyme species from a CEX column with a gradient length of 5 CV. Bands visible between wavenumbers 1200–1700 cm−1 are the characteristic
amide bands associated with protein. The major protein bands amide I and amide II are marked as AI and AII, respectively. The band at approximately 1100 cm−1 is characteristic
of PEG (C–O stretching, marked as CO). The subscript numerals refer to the elution order.
Fig. 5. Four chromatographic runs are shown for in-line FTIR measurements and selective quantification of PEG and lysozyme. The red bars and lines refer to the PEG off-line
measurement and PEG PLS prediction, respectively. The blue bars and lines refer to the lysozyme off-line measurement and lysozyme PLS prediction, respectively. Grey
bars correspond to measured protein concentrations on partially precipitated samples. Black dots show the molar ratio between PEG and lysozyme, i.e. the current mean
PEGylation degree. The different subplots show different gradient lengths: A 2 CV, B 3 CV, C 4 CV, D 5 CV. (For interpretation of the references to color in this figure legend,
the reader is referred to the web version of the article.)
S. Großhans et al. / J. Chromatogr. A 1547 (2018) 37–44
43
Fig. 6. Triton X-100 as a process-related impurity can be seen in the flow-through of the cation-exchange experiment from 5.5 ml to 11 ml at 1090 cm−1 .
In IR, Triton X-100 causes a characteristic band due to C–O
stretching at 1090 cm−1 . By comparison of the blank run and
the actual experiment, it was concluded that Triton X-100 is not
retained on the column and is mainly present in the flow-through.
The flow-through occurred between 5.5 ml and 11 ml As Triton X100 and protein spectra only weakly interfere with each other, the
Triton X-100 content was measured by simply correlating the band
area of C–O stretching from 1007 cm−1 to 1170 cm−1 to the Triton
X-100 concentration. A linear regression for the calibration curve
resulted in a R2 > 0.9997. Based on the calibration curve, in-line
mass-balancing could be performed. The mass balance for Triton
X-100 showed a recovery rate of 94.12% in the flow-through. This
shows that it is possible to selectively quantify Triton X-100 content
during the chromatographic load phase.
4. Conclusion and outlook
FTIR spectroscopy was successfully implemented in-line as
a PAT tool for biopharmaceutical purification processes. It was
demonstrated that FTIR is able to distinguish and selectively
quantify proteins in-line based on their secondary structure. Furthermore, FTIR presents a powerful tool for monitoring different
chemical components such as PEG or Triton X-100. Based on selective in-line quantification of PEG and protein, PEGylation degrees
could be measured in-line. Selective mass balancing was performed
on the process-related contaminant Triton X-100. In summary, FTIR
provides orthogonal information to the typically measured UV/Vis
spectra. It therefore is potentially interesting for monitoring process attributes which have been previously hidden. FTIR may help
to achieve a more complete implementation of the PAT initiative.
Future research should be directed towards making the setup
more compatible with the production environment. Challenges
include the use of detectors without liquid nitrogen cooling and
the application of fiber optics for in-line process probes.
Acknowledgements
This work has received funding from the European Union’s
Horizon 2020 research and innovation programme under grant
agreement no 635557. We are thankful for the mAb protein A pool
which we received from Lek Pharmaceuticals, d.d. We would also
like to thank Daniel Büchler for his help conducting the experiments.
References
[1] G. Carta, A. Jungbauer, Protein Chromatography: Process Development and
Scale-up, John Wiley & Sons, 2010.
[2] H. Schmidt-Traub (Ed.), Preparative Chromatography of Fine Chemicals and
Pharmaceutical Agents, Wiley, 2005, />[3] Methods for affinity-based separations of enzymes and proteins, in: M.N.
Gupta (Ed.), Methods and Tools in Biosciences and Medicine, 1st ed.,
Birkhäuser, 2002, />[4] FDA, Guidance for industry. PAT – A framework for innovative pharmaceutical
development, manufacturing, and quality assurance, 2004.
[5] A.S. Rathore, G. Kapoor, Application of process analytical technology for
downstream purification of biotherapeutics, J. Chem. Technol. Biotechnol. 90
(2) (2015) 228–236.
[6] M. Rüdt, T. Briskot, J. Hubbuch, Advances in downstream processing of
biologics-spectroscopy: an emerging process analytical technology, J.
Chromatogr. A 1490 (2017) 2–9.
[7] R.L. Fahrner, G.S. Blank, Real-time control of antibody loading during protein
A affinity chromatography using an on-line assay, J. Chromatogr. A 849 (1)
(1999) 191–196.
[8] D.J. Karst, F. Steinebach, M. Soos, M. Morbidelli, Process performance and
product quality in an integrated continuous antibody production process,
Biotechnol. Bioeng. 114 (2) (2017) 298–307, />26069.
[9] A. Williams, E.K. Read, C.D. Agarabi, S. Lute, K.A. Brorson, Automated 2d-hplc
method for characterization of protein aggregation with in-line fraction
collection device, J. Chromatogr. B 1046 (2017) 122–130.
[10] R.L. Fahrner, P.M. Lester, G.S. Blank, D.H. Reifsnyder, Real-time control of
purified product collection during chromatography of recombinant human
insulin-like growth factor-i using an on-line assay, J. Chromatogr. A 827 (1)
(1998) 37–43.
[11] A.S. Rathore, M. Yu, S. Yeboah, A. Sharma, Case study and application of
process analytical technology (PAT) towards bioprocessing: use of on-line
high-performance liquid chromatography (HPLC) for making real-time
44
[12]
[13]
[14]
[15]
[16]
[17]
[18]
[19]
[20]
[21]
[22]
[23]
[24]
[25]
S. Großhans et al. / J. Chromatogr. A 1547 (2018) 37–44
pooling decisions for process chromatography, Biotechnol. Bioeng. 100 (2)
(2008) 306–316.
N. Brestrich, T. Briskot, A. Osberghaus, J. Hubbuch, A tool for selective inline
quantification of co-eluting proteins in chromatography using spectral
analysis and partial least squares regression, Biotechnol. Bioeng. 111 (7)
(2014) 1365–1373.
N. Brestrich, A. Sanden, A. Kraft, K. McCann, J. Bertolini, J. Hubbuch, Advances
in inline quantification of co-eluting proteins in chromatography:
process-data-based model calibration and application towards real-life
separation issues, Biotechnol. Bioeng. 112 (7) (2015) 1406–1416.
M. Rüdt, N. Brestrich, L. Rolinger, J. Hubbuch, Real-time monitoring and
control of the load phase of a protein a capture step, Biotech. Bioeng. 114 (2)
(2017) 368–373.
S.K. Hansen, B. Jamali, J. Hubbuch, Selective high throughput protein
quantification based on UV absorption spectra, Biotechnol. Bioeng. 110 (2)
(2013) 448–460.
W. Jiskoot, D. Crommelin, Methods for Structural Analysis of Protein
Pharmaceuticals, Vol. 3, Springer Science & Business Media, 2005.
D.A. Parkins, U.T. Lashmar, The formulation of biopharmaceutical products,
Pharma. Sci. Technol. Today 3 (4) (2000) 129–137, />S1461-5347(00)00248-0.
J. Morgenstern, M. Busch, P. Baumann, J. Hubbuch, Quantification of pegylated
proteases with varying degree of conjugation in mixtures: an analytical
protocol combining protein precipitation and capillary gel electrophoresis, J.
Chromatogr. A 1462 (2016) 153–164.
A. Strancar, P. Raspor, H. Schwinn, R. Schutz, D. Josic, Extraction of
Triton-X-100 and its determination in virus-inactivated human plasma by the
solvent detergent method, J. Chromatogr. A 658 (2) (1994) 475–481, http://
dx.doi.org/10.1016/0021-9673(94)80038-3.
S.V. Thakkar, K.M. Allegre, S.B. Joshi, D.B. Volkin, C.R. Middaugh, An
application of ultraviolet spectroscopy to study interactions in proteins
solutions at high concentrations, J. Pharm. Sci. 101 (9) (2012) 3051–3061,
/>pii/S0022354915314520.
E.E. Remsen, J.J. Freeman, A size-exclusion chromatography/ft-ir (SEC/FT-IR)
technique for improved FTIR spectroscopy of proteins in d 2 o solution, Appl.
Spectrosc. 45 (5) (1991) 868–873.
G.W. Somsen, C. Gooijer, U.A.T. Brinkman, Liquid
chromatography-Fourier-transform infrared spectrometry, J. Chromatogr. A
856 (1–2) (1999) 213–242, />J. Kuligowski, G. Quintás, M. de la Guardia, B. Lendl, Analytical potential of
mid-infrared detection in capillary electrophoresis and liquid
chromatography: a review, Anal. Chim. Acta 679 (1–2) (2010) 31–42, http://
dx.doi.org/10.1016/j.aca.2010.09.006.
E. Goormaghtigh, V. Cabiaux, J.-M. Ruysschaert, Determination of soluble and
membrane protein structure by Fourier transform infrared spectroscopy: I.
assignment of model compounds Physicochemical Methods in the Study of
Biomembranes, Vol. 23, Springer, 1994, pp. 328–357.
R. Schweitzer-Stenner, Advances in vibrational spectroscopy as a sensitive
probe of peptide and protein structure: a critical review, Vib. Spectrosc. 42 (1)
(2006) 98–117.
[26] F. Capito, R. Skudas, H. Kolmar, B. Stanislawski, Host cell protein
quantification by Fourier transform mid infrared spectroscopy (FT-MIR),
Biotechnol. Bioeng. 110 (1) (2013) 252–259.
[27] F. Capito, R. Skudas, H. Kolmar, C. Hunzinger, At-line mid infrared
spectroscopy for monitoring downstream processing unit operations, Process
Biochem. 50 (6) (2015) 997–1005, />03.005.
[28] P.L. Roberts, Virus elimination during the purification of monoclonal
antibodies by column chromatography and additional steps, Biotechnol. Prog.
30 (6) (2014) 1341–1347.
[29] J. Morgenstern, P. Baumann, C. Brunner, J. Hubbuch, Effect of peg molecular
weight and pegylation degree on the physical stability of pegylated lysozyme,
Int. J. Pharm. 519 (1) (2017) 408–417.
[30] K. Baumgartner, L. Galm, J. Nötzold, H. Sigloch, J. Morgenstern, K. Schleining, S.
Suhm, S.A. Oelmeier, J. Hubbuch, Determination of protein phase diagrams by
microbatch experiments: exploring the influence of precipitants and ph, Int. J.
Pharm. 479 (1) (2015) 28–40, />027 />[31] S. de Jong, Simpls: an alternative approach to partial least squares regression,
Chemom. Intell. Lab. Syst. 18 (3) (1993) 251–263, />0169-7439(93)85002-X />016974399385002X.
[32] A. Savitzky, M.J.E. Golay, Smoothing and differentiation of data by simplified
least squares procedures, Anal. Chem. 36 (8) (1964) 1627–1639.
[33] S. Wold, M. Sjöström, L. Eriksson, PLS-regression: a basic tool of
chemometrics, Chemom. Intell. Lab. Syst. 58 (2) (2001) 109–130, http://dx.
doi.org/10.1016/S0169-7439(01)00155-1, arXiv:S0169-74390100155-1.
[34] K. Deep, K.P. Singh, M. Kansal, C. Mohan, A real coded genetic algorithm for
solving integer and mixed integer optimization problems, Appl. Math.
Comput. 212 (2) (2009) 505–518, />044 />[35] G. Quintás, B. Lendl, S. Garrigues, M. de la Guardia, Univariate method for
background correction in liquid chromatography-Fourier transform infrared
spectrometry, J. Chromatogr. A 1190 (1–2) (2008) 102–109, />10.1016/j.chroma.2008.02.111.
[36] E. Pretsch, P. Bühlmann, C. Affolter, E. Pretsch, P. Bhuhlmann, C. Affolter,
Structure Determination of Organic Compounds, Vol. 13, Springer, 2009.
[37] J.E. Seely, C.W. Richey, Use of ion-exchange chromatography and hydrophobic
interaction chromatography in the preparation and recovery of polyethylene
glycol-linked proteins, J. Chromatogr. A 908 (1) (2001) 235–241.
[38] S. Yamamoto, S. Fujii, N. Yoshimoto, P. Akbarzadehlaleh, Effects of protein
conformational changes on separation performance in electrostatic
interaction chromatography: Unfolded proteins and pegylated proteins, J.
Biotechnol. 132 (2) (2007) 196–201.
[39] S.K. Hansen, B. Maiser, J. Hubbuch, Rapid quantification of
protein-polyethylene glycol conjugates by multivariate evaluation of
chromatographic data, J. Chromatogr. A 1257 (2012) 41–47, />10.1016/j.chroma.2012.07.089.