Quantitative determination of major alkaloids in Cinchona bark by Supercritical Fluid Chromatography
Bạn đang xem bản rút gọn của tài liệu. Xem và tải ngay bản đầy đủ của tài liệu tại đây (1.07 MB, 6 trang )
Journal of Chromatography A, 1554 (2018) 117–122
Contents lists available at ScienceDirect
Journal of Chromatography A
journal homepage: www.elsevier.com/locate/chroma
Quantitative determination of major alkaloids in Cinchona bark by
Supercritical Fluid Chromatography
Adele Murauer, Markus Ganzera ∗
Institute of Pharmacy, Pharmacognosy, Center for Molecular Biosciences (CMBI), University of Innsbruck, Innsbruck, Austria
a r t i c l e
i n f o
Article history:
Received 14 March 2018
Received in revised form 12 April 2018
Accepted 15 April 2018
Available online 18 April 2018
Keywords:
Cinchona sp.
Cinchona bark
Supercritical Fluid Chromatography
Chinoline alkaloids
Quinine
Quantification
a b s t r a c t
Chinoline alkaloids found in Cinchona bark still play an important role in medicine, for example as antimalarial and antiarrhythmic drugs. For the first time Supercritical Fluid Chromatography has been utilized
for their separation. Six respective derivatives (dihydroquinidine, dihydroquinine, quinidine, quinine, cinchonine and cinchonidine) could be resolved in less than 7 min, and three of them quantified in crude plant
extracts. The optimum stationary phase showed to be an Acquity UPC2 Torus DEA 1.7 m column, the
mobile phase comprised of CO2 , acetonitrile, methanol and diethylamine. Method validation confirmed
that the procedure is selective, accurate (recovery rates from 97.2% to 103.7%), precise (intra-day ≤2.2%,
inter-day ≤3.0%) and linear (R2 ≥ 0.999); at 275 nm the observed detection limits were always below
2.5 g/ml. In all of the samples analyzed cinchonine dominated (1.87%–2.30%), followed by quinine and
cinchonidine. Their total content ranged from 4.75% to 5.20%. These values are in good agreement with
published data, so that due to unmatched speed and environmental friendly character SFC is definitely
an excellent alternative for the analysis of these important natural products.
© 2018 The Author(s). Published by Elsevier B.V. This is an open access article under the CC BY license
( />
1. Introduction
Cinchonae cortex, which originates from several related species
of the genus Cinchona (C. pubescens, C. calisaya, C. ledgeriana and
hybrids) according to the European Pharmacopeia, was used as
antimalarial drug by the indigenous population of South America
for centuries. It became the primary remedy against this disease
worldwide, and only after World War 2 synthetic antimalarials
like chloroquine replaced the natural product [1]. However, due to
increasing resistances and also availability issues quinine is still relevant for malaria treatment today [2]; besides that the compound
is added to beverages as bitter agent [3], serves a catalyst in asymmetric organic synthesis [4], or acts as chiral selector in stationary
phases [5]. The alkaloid pattern in Cinchona bark is rather complex with more than 30 known representatives [6]. They mainly
are chinoline derivatives, including the diastereomeric pairs quinine/quinidine and cinchonine/cinchonidine. Additional alkaloids
are, among others, their dihydro-derivatives.
Not only due to the medicinal and commercial importance of
Cinchona bark but also the narrow therapeutic window of quinine
many analytical studies focused on the determination of alkaloids in the crude drug. The compendial method in the 9th edition
of the Ph.Eu. is based on a photometric determination of quinine (348 nm) and cinchonine-type (316 nm) alkaloids. Research
papers mainly emphasized on the separation of the dominant representatives utilizing TLC [7], isotachophoresis [8], aqueous [9] and
non-aqueous CE [10], vibrational spectroscopy [11], NMR [12] and
HPLC [3,6,13–16]. For example, Hoffmann et al. utilized a chiral
strong cation exchange material to excellently resolve eight Cinchona alkaloids in 15 min, yet an application to plant material is
missing [16]. The latter was presented in the most recent study,
in which Holmfred et al. reported on the separation of the four
main isomers on 2.6 m C-18 core shell material (Kinetex XB-C18)
in 25 min [17]. Whether Supercritical Fluid Chromatography (SFC)
is a possible and equivalent alternative has never been investigated. In the past the technique was predominantly used for the
analysis of non-polar compounds like fatty acids [18], triglycerides
[19] or carotenoids [20]. Recent publications point to a much wider
range of possible applications also including polar natural products
[21,22] and alkaloids [23–25]. Therefore, we attempted to separate
and quantify the alkaloids in Cinchona bark by SFC.
2. Materials and methods
2.1. Standards and reagents
∗ Corresponding author at: Institute of Pharmacy, Pharmacognosy, University of
Innsbruck, Innrain 80-82, 6020 Innsbruck, Austria.
E-mail address: (M. Ganzera).
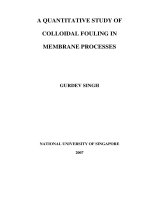
Six Cinchona alkaloids (compounds 1-6, see Fig. 1 for structures)
with a purity ≥98% were available as standards; they were pur-
/>0021-9673/© 2018 The Author(s). Published by Elsevier B.V. This is an open access article under the CC BY license ( />
118
A. Murauer, M. Ganzera / J. Chromatogr. A 1554 (2018) 117–122
Fig. 1. Chemical structure of the assayed Cinchona alkaloids.
chased from Phytolab (Vestenbergsreuth, Germany; compounds
1 and 2) and Sigma Aldrich (St. Louis, MO, USA; compounds 36). Plant samples (CC-2017-1 to CC-2017-4) were bought 2017
in different pharmacies in Innsbruck, Austria; voucher specimens
are deposited at the Institute of Pharmacy, Pharmacognosy, University of Innsbruck. Compressed carbon dioxide for SFC analysis
had a purity of ≥99.995% (4.5 grade) and came from Messer
(Gumpoldskirchen, Austria). All solvents and reagents (methanol,
acetonitrile, diethylamine, trimethylamine, sodium hydroxide,
acetic acid, ammonium acetate, phosphoric acid) utilized in this
study were of analytical grade and purchased from Merck (Darmstadt, Germany). An Arium 611 water purification system from
Sartorius (Göttingen, Germany) produced the required HPLC grade
water.
2.2. Sample preparation
The plant material (Cinchonae cortex Ph.Eu.) was finely pulverized in a mill and 150 mg were extracted following a published
protocol [6]. Extraction solvent was a methanol/0.1 M NaOH mixture in the ratio 49/1; the samples were extracted three-times
with 10 ml of this mixture by sonication (Bandelin Sonorex, Berlin,
Germany) for 20 min each. After each step they were centrifuged
for 10 min at 1500g, and the clear supernatant combined in a
50 ml volumetric flask. Then the latter was filled to volume with
the extraction solvent. Sample solutions were membrane filtered
right before analysis (0.45 m cellulose acetate membrane, VWR,
Vienna, Austria) and injected in triplicate. If stored at 4 ◦ C sample
and standard solutions are stable for at least 2 weeks.
2.3. Analytical method
For all experiments an Acquity UPC2 -SFC instrument from
Waters (Milford, MA, USA), equipped with convergence manager,
column oven, sample manager, binary solvent manager and PDA
detector was used; the operating software was Empower 3. Optimum separation of the six standards was achieved on an Acquity
UPC2 Torus DEA column (3.0 × 100 mm, 1.7 m) from Waters, protected by a guard filter (critical clean; Waters). The mobile phase
comprised CO2 (A) and 0.8% diethylamine in a mixture of 10% ace-
tonitrile and 90% methanol (B). Isocratic separation was achieved
by maintaining a concentration of 97.7A/2.3B over 10 min. The
injected sample volume was 1 l, while flow rate, column temperature and ABPR pressure were set to 1.8 ml/min, 15 ◦ C and 150 bar
(2175 psi). The compounds of interest were detected at 275 nm.
The sample manager was maintained at 10 ◦ C, and a mixture of
methanol/2-propanol (1:1) and methanol served as a weak and
strong wash, respectively.
2.4. Method validation
To assure that the developed SFC method conforms to regulatory standards it was validated according to ICH guidelines [26].
For the construction of calibration curves as well as to determine
the linear range approximately 1 mg of each standard was accurately weighted and dissolved in 1 ml methanol (stock solution).
This solution was used to prepare further calibration levels by
serial dilution in the ratio of 1:1 with the same solvent. LOD (limit
of detection) and LOQ (limit of quantification) values were calculated as described in the guidelines based on standard deviation
of the response and slope of the calibration curve. Selectivity was
confirmed by utilizing PDA data and the peak purity option of
the operating software. Precision was assured by preparing and
analyzing five solutions of sample CC-2017-2 on each of three
consecutive days. Variations within one day (intra-day precision)
and within three days (inter-day precision) were calculated based
on the peak area. Accuracy was investigated by spiking sample
CC-2017-2 with different concentrations of all standards (high,
medium and low spike). Spiked samples were then extracted and
analyzed as proposed. Recovery rates were calculated by comparing the actually found concentrations with the theoretically present
ones. All results of the validation experiments are summarized in
Table 1.
3. Results and discussion
Since its beginnings in the 1960s SFC has evolved into a widely
utilized and efficient separation technique. A better understanding of the underlying theory, together with significantly improved
instruments and stationary phases have led to many successful
A. Murauer, M. Ganzera / J. Chromatogr. A 1554 (2018) 117–122
119
Table 1
Results of method validation.
Regr. equation
1
y = 297.1 x +848.7
2
y = 315.1 x +182.1
3
y = 267.6 x −189.4
4
y = 273.4 x −34.1
5
y = 239.1 x −679.9
6
y = 252.8 x −724.0
R2
Linear rangea
LODa
LOQa
Precision
intra-dayb
inter-dayc
Accuracyd
high spike
medium spike
low spike
0.9998
990–30.9
2.3
6.8
0.9997
990–30.9
2.4
7.3
0.9996
990–30.9
1.5
4.5
0.9992
1020−31.9
1.4
4.2
0.9994
1020−31.9
0.6
1.9
0.9992
1010−31.6
0.9
2.7
–
–
–
–
–
–
1.0
1.9
1.2
1.8
2.2
3.0
98.5
97.3
97.9
97.8
97.3
98.5
99.5
97.3
97.2
102.3
100.9
98.0
103.3
101.8
98.8
103.7
101.8
97.5
a
b
c
d
g/ml.
Maximum deviation within one day based on peak area in percent.
Deviation over three days based on peak area in percent.
Expressed as recovery rate in percent.
separations and a broad field of applications. However, relevant
medicinal plants, whose ingredients seem to be not suitable for SFC
because of their polarity, have never been investigated till date.
One of them is Cinchona bark, a drug which is analytically challenging as it contains diastereomeric chinoline alkaloids as active
constituents.
3.1. Method development
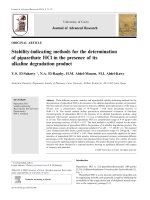
The optimum SFC separation of six major Cinchona alkaloids,
namely dihydroquinidine (1), dihydroquinine (2), quinidine (3),
quinine (4), cinchonine (5) and cinchonidine (6), within less than
7 min is shown in Fig. 2A. During method development it was
observed that this result is only feasible by one specific combination of mobile and stationary phase. Concerning the latter,
eight different SFC columns from Waters with identical dimensions
(3.0 × 100 mm) and a particle size ≤2 m were tested: four from the
Torus series, i.e. 2-PIC, Diol, 1-AA and DEA, and four Viridis columns
(BEH, BEH 2-EP, CSH Fluoro-Phenyl and HSS C18 SB). According
to West and colleagues, who classified more than 30 ultra-high
performance SFC stationary phases using a modified LSER (linear
solvation energy relationship) model, from all the stationary phases
available in this study Torus DEA (diethylamine) material has the
highest basic character [27]. For this material the relevant a-term
(basicity) is higher than 2.6, whereas for example for Viridis phases
it ranges from 0.3 (CSH Fluoro-Phenyl) to 1.4 (BEH 2-EP). Accordingly, this material is designed to provide superior peak shape for
bases [28]. With pKa values around 8.5 [29] the target analytes
are such compounds, and therefore it seemed logic that this stationary phase was selected for further experiments. Only on Torus
DEA material the compounds could be separated with acceptable
resolution and peak shape, on others including all Viridis columns
the compounds eluted as broad and overlapping signals only (see
supporting information).
Concerning the mobile phase it was required to add organic
solvents and diethylamine as modifiers. The polarity of pure CO2
is similar to hexane [30], and therefore a small percentage of
methanol was required; the combination with acetonitrile was
advantageous in terms of resolution (Fig. 2B), thus a MeOH/ACN
mixture in the ratio of 9:1 was employed. However, without an
alkaline eluent no acceptable result was possible. This observation
was in agreement to literature, where an enhanced SFC separation of basic substances with an alkaline mobile phase is reported
[31]. The authors attributed this effect to reduced secondary ionic
interactions with residual silanols. For the current application the
addition of 0.8% diethylamine (DEA) to the modifier (i.e. the aforementioned mixture of MeOH and ACN) showed to be the optimum.
In terms of elution mode conditions had to be fine-tuned as well.
Even with a very flat gradient the first four signals merged, so that
isocratic conditions had to be selected; 97.7% phase A (CO2 ) and
2.3% B (MeOH, ACN and DEA) provided the best resolution. It is noteworthy to say that already a slight change (e.g. to 2.5% B; Fig. 2C)
had a negative impact on the separation. Lowering the modifier
concentration to 2.0% resulted in prolonged retention times, yet
compounds 2 and 3 gradually overlapped.
Another parameter with significant influence on the separation of the six alkaloids was column temperature (Fig. 2D). Rather
surprisingly, by lowering column temperature down to 15 ◦ C retention times steadily increased. The opposite would be expected
because at lower temperatures fluid density increases, resulting in
reduced retention. A possible explanation for the observed effects
might be changes in the polarity of the stationary phase due to a
temperature-dependent adsorption of mobile phase components
[32]. It is obvious that carbon dioxide was not present in the supercritical state anymore, because its critical temperature is 31 ◦ C;
however, working in the subcritical stage has no significant disadvantages and it is described (but not necessarily mentioned)
quite often [33]. Further chromatograms indicating the relevance
of individual method parameters are compiled as supplementary
material. An interesting fact shown there is the influence of applied
backpressure (ABPR). This setting is usually of minor importance,
yet in the current application it modified resolution, particularly
between compounds 2 and 3. The latter could be resolved best at
an applied ABPR of 150 bar.
3.2. Method validation
Assay development was followed by method validation; data
presented in Table 1 confirms that all requirements were satisfactorily met in this respect. Selectivity was deduced by several facts.
First, structurally closely related compounds (including diastereomers) could be resolved, second, no signs of co-elutions (e.g. peak
shoulders) were visible, and third, the PDA data was very consistent within individual peaks. A final confirmation of peak purity
by SFC-MS was not possible, because this technical option was
not available. For all standards calibration curves were linear from
approx. 1000–30 g/ml, with determination coefficients always
being higher than 0.999. LOD values showed to be in the range from
0.6 (5) to 2.4 (2) g/ml, LOQ values varied from 1.9–7.3 g/ml. They
naturally cannot compete with those achievable by fluorescence
detection (e.g. LOD for quinine is 2 fmol, [6]); however, they are
comparable to conventional HPLC-UV as LOQ values of 5 g/g are
stated in reference [17]. Precision was investigated by repeatedly
assaying sample CC-2017-2 under optimized extraction and sepa-
120
A. Murauer, M. Ganzera / J. Chromatogr. A 1554 (2018) 117–122
Fig. 2. Separation of Cinchona alkaloids by SFC; optimum conditions (A; column: Acquity UPC2 Torus DEA 1.7 m, 3.0 × 100 mm; mobile phase: CO2 (A) and 0.8% diethylamine
in a mixture of 10% acetonitrile and 90% methanol (B); elution: isocratic with 97.7A/2.3B; sample volume: 1 l; flow rate: 1.8 ml/min; column temperature: 15 ◦ C; ABPR
pressure: 150 bar; detection wavelength: 275 nm) and variations thereof: only MeOH and 0.8% DEA as modifier (B), isocratic elution with 2.5% B (C) and separation at 20 ◦ C
(D). Peak assignment is according to Fig. 1.
ration conditions. Intra-day (≤2.2%) as well as inter-day variations
(≤3.0%) were acceptable and typical for investigating plant material, which usually shows some degree of inhomogeneity. Last but
not least, accuracy was determined in spiking experiments (high
spike: 200 g/ml, medium spike: 100 g/ml, low spike: 50 g/ml).
Recovery rates were not lower than 97.2% (3, low spike) and not
higher than 103.7% (6, high spike), indicating validity of this parameter too.
3.3. Analysis of the samples
Four samples of dried and milled Cinchona bark, all of them with
Ph.Eu. quality, were available for quantification. Concerning the
optimum extraction protocol a procedure described by Gatti et al.
was adopted [6]. It utilizes alkaline methanol and sonication, and
showed to be advantageous over others like soxhlet extraction in
their work due to the mild conditions applied; the observed quan-
A. Murauer, M. Ganzera / J. Chromatogr. A 1554 (2018) 117–122
121
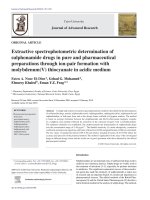
Fig. 3. Analysis of sample CC-2017-1 under optimized SFC conditions (see Fig. 2). Peak assignment is according to Fig. 1.
Table 2
Quantitative results as determined by SFC. Values reflect percent (mg alkaloid/100 mg crude drug), standard deviation are given in parenthesis (n = 3).
Compound
CC-2017-1
CC-2017-2
CC-2017-3
CC-2017-4
quinine (4)
cinchonine (5)
cinchonidine (6)
˙
1.59 (1.22)
2.30 (1.23)
0.90 (0.91)
4.79
1.89 (0.92)
2.16 (0.99)
1.15 (1.47)
5.20
1.62 (1.34)
1.87 (1.55)
1.26 (1.14)
4.75
1.76 (1.34)
2.24 (1.22)
1.05 (0.89)
5.05
titative results were comparable. We modified the procedure in a
way that sonication was repeated three times in order to assure
exhaustiveness. The following facts support this estimation. First,
if the remaining plant material is extracted and assayed one more
time no remains of the alkaloids were detectable, and second, the
excellent recovery rates already mentioned in the previous chapter.
A typical SFC chromatogram of a sample solution is shown
in Fig. 3. The compiled quantitative results presented in Table 2
indicate that all of the investigated specimens were of similar
composition. Three of the six standards were clearly assignable
by matching retention times and UV-spectra; if these criteria
were not met, e.g. peaks were too small for providing meaningful
spectra, respective signals were not considered for quantitation.
The assigned compounds were quinine, cinchonine and cinchonidine, with the latter always being the least abundant alkaloid
(0.90%–1.26%). Most dominant was cinchonine (1.87%–2.30%), followed by quinine, which ranged from 1.59% to 1.89%; an excellent
repeatability was observed while performing these experiments
(rel ≤ 1.55, n = 3). The total alkaloid content varied from 4.75%
(sample CC-2017-3) to 5.20% (sample CC-2017-2).
4. Conclusion
This study is another proof for the excellent separation efficiency
and versatility of SFC, especially in the field of natural products. The
determination of alkaloids in Cinchona bark is a challenging task,
because the target analytes are structurally very similar and the
investigated matrix is complex like most biological samples. Due
to the persisting practical relevance of the drug many attempts
have been made to determine these compounds, mostly by using
conventional RP-HPLC in combination with fluorescence detection.
This assured an excellent sensitivity; however, the required analysis time was in the range from 15 [16] to 50 min [6], when only
recent publications are considered. That a comparable separation
is also feasible in less than 7 min by using a “green technology” has
been shown in the current study. This was only possible after meticulous method optimization, but once completed, a reproducible,
accurate and rugged system was available for routine use; method
validation confirmed this estimation. In the samples analyzed three
out of six standards could be assigned. This is less than in previous
reports, but explainable by the different detection techniques used.
However, if suitable instrumentation is present (e.g. fluorescence
detectors for SFC are available) there will be probably no difference in the number of identified compounds. With the available
instrumentation quinine, cinchonine and cinchonidine could easily be assigned in crude Cinchona bark extracts. The quantitative
results were well comparable to published data, which for example report the following values for a drug with Ph.EU. quality: 1.80%
quinine, 1.65% cinchonine, and 1.25% cinchonidine [17]. This successful application of SFC, on for the utilized technique “untypical”
compounds, should raise further interest to fully explore the potential of this separation technique, which definitely is not limited to
the “classics” like carotenoids, fatty acids or terpenes. This and other
studies on natural products like anthraquinones [34], kavalactones
[35] or furocoumarins [36] are good indicators actually.
Conflict of interest
The authors declare no conflict of interest.
Acknowledgement
The authors would like to thank the Austrian Science Fund (FWF,
project P269170) for financial support.
Appendix A. Supplementary data
Supplementary data associated with this article can be found,
in the online version, at />038.
References
[1] J. Achan, A.O. Talisuna, A. Erhart, A. Yeka, J.K. Tibenderana, F.N. Baliraine, P.J.
Rosenthal, U. D’Alessandro, Quinine, an old anti-malarial drug in a modern
world: role in the treatment of malaria, Malar. J. 10 (2011) 144.
122
A. Murauer, M. Ganzera / J. Chromatogr. A 1554 (2018) 117–122
[2] N.G. Sanders, D.J. Meyers, D.J. Sullivan, Antimalarial efficacy of
hydroxyethylapoquinine (SN-119) and its derivatives, Antimicrob. Agents
Chemother. 58 (2014) 820–827.
[3] M. Horie, M. Oishi, F. Ishikawa, T. Shindo, A. Yasui, O. Shuzo, K. Ito, Liquid
chromatographic analysis of Cinchona alkaloids in beverages, J. AOAC Int. 89
(2006) 1042–1047.
[4] E.M.O. Yeboah, S.O. Yeboah, G.S. Singh, Recent applications of Cinchona
alkaloids and their derivatives as catalysts in metal-free asymmetric
synthesis, Tetrahedron 67 (2011) 1725–1762.
[5] G. Lajko, T. Orosz, N. Grecso, B. Fekete, M. Palko, F. Fulop, W. Lindner, P. Antal,
I. Ilisz, High-performance liquid chromatographic enantioseparation of cyclic
ß-aminohydroxamic acids on zwitterionic chiral stationary phases based on
Cinchona alkaloids, Anal. Chim. Acta 921 (2016) 84–94.
[6] R. Gatti, M.G. Gioia, V. Cavrini, Determination of Cinchona alkaloids and
vitamin B6 by high-performance liquid chromatography with fluorescence
detection, Anal. Chim. Acta 512 (2004) 85–91.
[7] T. Mroczek, K. Glowniak, TLC and HPTLC assay for quinoline and quinuclidine
alkaloids in Cinchonae cortex and pharmaceutical preparations, J. Planar
Chromatogr. 13 (2000) 457–462.
[8] H. Klein, T. Teichmann, Determination of Cinchona alkaloids in
pharmaceutical preparations by isotachophoresis (iontophoresis), Pharm. Ztg.
132 (1987) 1131–1135.
[9] W. Zhao, Y. Li, Y. Zhang, Y. Hongfen, H. Yu, A. Chen, Determination of Cinchona
alkaloids by capillary electrophoresis with novel complex formation, Anal.
Lett. 49 (2016) 1176–1183.
[10] W. Buchberger, D. Gstöttenmayr, M. Himmelsbach, Determination of
Cinchona alkaloids by non-aqueous CE with MS detection, Electrophoresis 31
(2010) 1208–1213.
[11] M. Romon, K. Chruszcz-Lipska, M. Baranska, Vibrational analysis of Cinchona
alkaloids in the solid state and aqueous solutions, J. Raman Spectrosc. 46
(2015) 1041–1052.
[12] A. Yilmaz, N.T. Nyberg, J.W. Jaroszewski, Extraction of alkaloids for NMRbased profiling: exploratory analysis of an archaic Cinchona bark collection,
Planta Med. 78 (2012) 1885–1890.
[13] A.S. Fabiano-Tixier, A. Elomri, A. Blanckaert, E. Seguin, E. Petitcolas, F. Chemat,
Rapid and green analytical method for the determination of quinoline
alkaloids from Cinchona succirubra based on microwave-integrated extraction
and leaching (MIEL) prior to high performance liquid chromatography, Int. J.
Mol. Sci. 12 (2011) 7846–7860.
[14] D.V. McCalley, Analysis of Cinchona alkaloids by high-performance liquid
chromatography and other techniques, J. Chromatogr. A 967 (2002) 1–19.
[15] D.V. McCalley, Quantitative analysis of alkaloids from Cinchona bark by
high-performance chromatography, Analyst 115 (1990) 1355–1358.
[16] C.V. Hoffmann, M. Lämmerhofer, W. Lindner, Separation of Cinchona alkaloids
on a novel strong cation-exchange-type chiral stationary phase – comparison
with commercially available strong cation exchanger and reversed-phase
packing materials, Anal. Bioanal. Chem. 393 (2009) 1257–1265.
[17] E. Holmfred, C. Cornett, C. Maldonado, N. Ronsted, S.H. Hansen, An optimized
method for routine separation and quantification of major alkaloids in cortex
Cinchona by HPLC coupled with UV and fluorescence detection, Phytochem.
Anal. 28 (2017) 374–380.
[18] M. Ashraf-Khorassani, G. Isaac, P. Rainville, K. Fountain, L.T. Taylor, Study of
ultrahigh performance supercritical fluid chromatography to measure free
fatty acids without fatty acid ester preparation, J. Chromatogr. B 997 (2015)
45–55.
[19] E. Lesellier, A. Latos, A.L. de Oliveira, Ultra high efficiency/low pressure
supercritical fluid chromatography with superficially porous particles for
triglyceride separation, J. Chromatogr. A 1327 (2014) 141–148.
[20] D. Giuffrida, P. Donato, P. Dugo, L. Mondello, Recent analytical techniques
advances in the carotenoids and their derivatives determination in various
matrixes, J. Agric. Food Chem. 66 (2018) 3302–3307.
[21] Y. Huang, T. Zhang, Y. Zhao, H. Zhou, G. Tang, M. Fillet, J. Crommen, Z. Jiang,
Simultaneous analysis of nucleobases, nucleosides and ginsenosides in
ginseng extracts using supercritical fluid chromatography coupled with single
quadrupole mass spectrometry, J. Pharm. Biomed. Anal. 144 (2017) 213–219.
[22] J. Yang, L. Zhu, Y. Zhao, Y. Xu, Q. Sun, S. Liu, C. Liu, B. Ma, Separation of
furostanol saponins by supercritical fluid chromatography, J. Pharm. Biomed.
Anal. 145 (2017) 71–78.
[23] W. Yang, Y. Zhang, H. Pan, C. Yao, J. Hou, S. Yao, L. Cai, R. Feng, Supercritical
fluid chromatography for separation and preparation of tautomeric
7-epimeric spiro oxindole alkaloids from Uncaria macrophylla, J. Pharm.
Biomed. Anal. 134 (2017) 352–360.
[24] Q. Fu, Z. Li, C. Sun, H. Xin, Y. Ke, Y. Jin, X. Liang, Rapid and simultaneous
analysis of sesquiterpene pyridine alkaloids from Tripterygium wilfordii Hook.
f. using supercritical fluid chromatography-diode array detector-tandem
mass spectrometry, J. Supercrit. Fluids 104 (2015) 85–93.
[25] A. Hartmann, M. Ganzera, Supercritical fluid chromatography – theoretical
background and applications on natural products, Planta Med. 81 (2015)
1570–1581.
[26] (Accessed 6 March 2018).
[27] C. West, E. Lemasson, S. Bertin, P. Henning, E. Lesellier, An improved
classification of stationary phases for ultra-high performance supercritical
fluid chromatography, J. Chromatogr. A 1440 (2016) 212–228.
[28] US/SFC-Columns, (Accessed 6 March
2018).
[29] D.C. Warhurst, J.C. Craig, I.S. Adagu, D.J. Meyer, S.Y. Lee, The relationship of
physico-chemical properties and structure to the differential antiplasmodial
activity of Cinchona alkaloids, Malaria J. 2 (2003) 26.
[30] T. Bamba, Application of supercritical fluid chromatography to the analysis of
hydrophobic metabolites, J. Sep. Sci. 31 (2008) 1274–1278.
[31] A. Grand-Guillaume Perrenoud, J. Boccard, J.L. Veuthey, D. Guillarme, Analysis
of basic compounds by supercritical fluid chromatography: attempts to
improve peak shape and maintain mass spectrometry compatibility, J.
Chromatogr. A 1262 (2012) 205–213.
[32] E. Lesellier, C. West, The many faces of packed column supercritical fluid
chromatography – a critical review, J. Chromatogr. A 1382 (2015) 2–46.
[33] E. Lesellier, Retention mechanisms in super/subcritical fluid chromatography
on packed columns, J. Chromatogr. A 1216 (2009) 1881–1890.
[34] D. Aichner, M. Ganzera, Analysis of anthraquinones in rhubarb (Rheum
palmatum and Rheum officinale) by supercritical fluid chromatography,
Talanta 144 (2015) 1239–1244.
[35] A. Murauer, M. Ganzera, Quantitative determination of lactones in Piper
methysticum (Kava-Kava) by supercritical fluid chromatography, Planta Med.
83 (2017) 1053–1157.
[36] C. Desmortreux, M. Rothaupt, C. West, E. Lesellier, Improved separation of
furocoumarins in essential oils by supercritical fluid chromatography, J.
Chromatogr. A 1216 (2009) 7088–7095.