Three dimensional characterisation of chromatography bead internal structure using X-ray computed tomography and focused ion beam microscopy
Bạn đang xem bản rút gọn của tài liệu. Xem và tải ngay bản đầy đủ của tài liệu tại đây (2.66 MB, 10 trang )
Journal of Chromatography A, 1566 (2018) 79–88
Contents lists available at ScienceDirect
Journal of Chromatography A
journal homepage: www.elsevier.com/locate/chroma
Three dimensional characterisation of chromatography bead internal
structure using X-ray computed tomography and focused ion beam
microscopy
T.F. Johnson a , J.J. Bailey b , F. Iacoviello b , J.H. Welsh c , P.R. Levison c , P.R. Shearing b ,
D.G. Bracewell a,∗
a
Department of Biochemical Engineering, University College London, Bernard Katz, London, WC1E 6BT, United Kingdom
Electrochemical Innovation Lab, Department of Chemical Engineering, University College London, Torrington Place, London, WC1E 7JE, United Kingdom
c
Pall Biotech, 5 Harbourgate Business Park, Southampton Road, Portsmouth, PO6 4BQ United Kingdom
b
a r t i c l e
i n f o
Article history:
Received 6 March 2018
Received in revised form 20 June 2018
Accepted 21 June 2018
Available online 25 June 2018
Keywords:
Key words
Bead scale
X-ray computed tomography
Focused ion beam microscopy
Structure
Tortuosity
a b s t r a c t
X-ray computed tomography (CT) and focused ion beam (FIB) microscopy were used to generate three
dimensional representations of chromatography beads for quantitative analysis of important physical
characteristics including tortuosity factor. Critical-point dried agarose, cellulose and ceramic beads were
examined using both methods before digital reconstruction and geometry based analysis for comparison
between techniques and materials examined.
X-ray ‘nano’ CT attained a pixel size of 63 nm and 32 nm for respective large field of view and high
resolution modes. FIB improved upon this to a 15 nm pixel size for the more rigid ceramic beads but
required compromises for the softer agarose and cellulose materials, especially during physical sectioning
that was not required for X-ray CT. Digital processing of raw slices was performed using software to
produce 3D representations of bead geometry.
Porosity, tortuosity factor, surface area to volume ratio and pore diameter were evaluated for each
technique and material, with overall averaged simulated tortuosity factors of 1.36, 1.37 and 1.51 for
agarose, cellulose and ceramic volumes respectively. Results were compared to existing literature values acquired using established imaging and non-imaging techniques to demonstrate the capability of
tomographic approaches used here.
© 2018 The Authors. Published by Elsevier B.V. This is an open access article under the CC BY license
( />
1. Introduction
Liquid chromatography systems consist of porous, microspherical beads [1] that are packed into a cylindrical column [2],
with the three dimensional structure of both the packed beds and
individual beads being important to key performance metrics [3].
The surface area of a chromatography bead is maximised by having
an internal structure comprised of intricate pore networks [4–6],
with various materials of construction used as the backbone [1] for
size exclusion or chemical based separation processes [7].
Chromatography beads have previously been characterised for
several important aspects [8] such as porosity and tortuosity [9]
in addition to performance based metrics [10,11]. Both imaging
∗ Corresponding author.
E-mail address: (D.G. Bracewell).
and non-imaging approaches have been used [8,12], with Inverse
Size Exclusion Chromatography (ISEC) being commonly used to
determine internal pore sizes [13]. Another available method for
pore size investigations is mercury porosimetry [12] which is also
used for porosity calculations. Tortuosity has been relatively more
difficult to define for internal chromatography bead structures, particularly using imaging techniques, however methods such as using
Bruggeman relationships, dilution methods [14] and other equation based approaches have been the most common methods for
doing so.
Two main imaging approaches have been extensively used
for both visualisation and quantification of chromatography bead
structure: confocal laser scanning microscopy (CLSM) [14–16] and
electron microscopy [8]. CLSM has been demonstrated to be capable of imaging the internal structure of a chromatography bead
without the need for physical sectioning, however CLSM lacks the
resolution capabilities for defining internal bead pores [3,11,17,18],
/>0021-9673/© 2018 The Authors. Published by Elsevier B.V. This is an open access article under the CC BY license ( />
80
T.F. Johnson et al. / J. Chromatogr. A 1566 (2018) 79–88
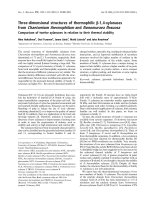
Fig. 1. Schematics for X-ray computed tomography and focused ion beam systems.
For X-ray computed tomography, emitted X-rays are directed towards the bead on
top of the pin before detection, with projections subsequently reconstructed into a
three dimensional volume. For focused ion beam microscopy, a sample is aligned
between milling and imaging beams (left) before sample preparation, where an
internal bead volume is isolated by milling a trench (right) over a platinum covered
bead. An exposed block face within the bead is imaged before sequential ‘slice and
view’ to produce a series of 2D electron micrographs.
whilst electron microscopy can display the detailed porous structure at the surface but has no natural sample penetration beyond
thin sliced samples [6,10,16].
This has made both visualisation and subsequent quantification
of the entire chromatography bead detailed microstructure difficult using existing imaging approaches as these techniques either
lack sufficient resolution or internal structure visualisation, requiring a method to physically cut through bead material for nano-scale
imaging. Microtomy has been demonstrated in other studies to be
capable of cutting through chromatography resins [8]. However
producing a series of thin nano-slices for the softer chromatography
materials resulted in microtomy being excluded from this study;
although use of approaches such as serial block face microtomy
[19] may be a more viable alternative for successfully applying
microtomy to beads.
While parameters such as porosity have been extensively characterised for a wide array of industrially relevant resins using
non-imaging techniques [4,8,9], tortuosity has been a point of contention in terms of the most representative method of evaluation
in addition to the actual range of tortuosity for chromatography
resins. From 1.3 to 6 [9,14,19] across various types, this presents
a vast difference in estimation of tortuosity that influences key
performance metrics such as transfer and diffusivity within a chromatography bead [9,20].
Therefore, imaging approaches for visualisation and quantification of internal chromatography bead structure are presented
here, achieving resolution superior to CLSM whilst enabling subsurface imaging not available when using conventional electron
microscopy [21]. The issue of penetrating material whilst attaining
a sufficient pixel size and quality was the main criteria for technique
selection and optimisation, with X-ray Computed Tomography (CT)
and Focused Ion Beam (FIB) microscopy selected to image agarose,
cellulose and ceramic beads. Tomographic imaging has been used
in other fields to provide a method for simulating tortuosity factor
[21–24] where, like in chromatography studies, the methods used
have typically relied on empirical or equation based derivations
[9,19,25].
In a previous study [26], X-ray CT was used to investigate packed
bed inter-bead structure of cellulose and ceramic based columns,
although the pixel size and field of view requirements were of
different scales [1]. X-ray ‘nano-CT’ [26–28] has been used to represent other porous structures and so was deemed appropriate to
image and reconstruct the 3D internal structure of conventional
chromatography beads, albeit of different materials to those investigated here.
Focused ion beam microscopy [29,30] was also used, a technique that relies on milling via a gallium ion beam and then
sample imaging using electron microscopy to generate a sequence
of two dimensional images; which can be reconstructed into a 3D
structure or to produce samples for TEM or X-ray CT [27,31,32].
Fig. 1 displays overall schematics for X-ray CT and FIB imaging
used to provide the basis for 3D bead structural representation.
Each technique has relative advantages and disadvantages
[21,27,32,33], but provide distinctly different methods of producing 3D structures at high resolutions; both in terms of pixel sizes
achievable as well as the approach required in order to obtain
tomographic data-sets of sufficient quality for visualisation and
quantification of structural geometry.
Using two different tomographic approaches for 3D bead visualisation and quantification enabled comparisons both between
results obtained for each bead type and overall technique suitability. Important considerations for determining the capability
for using tomographic approaches for visualisation and quantification of bead internal structure included accuracy of results when
compared to established literature techniques, in addition to general ease-of-use and feasibility for applying 3D imaging to relevant
chromatography beads of different materials.
Consideration included both the quantifiable results obtained
after imaging and processing in addition to requirements for imaging using X-ray CT and FIB. Porosity, tortuosity factor, surface area
to volume ratio and pore size of each sample are discussed in
relation to the technique used and material examined in addition to identifying relevant advantages and disadvantages of using
X-ray CT and FIB microscopy for bead visualisation and evaluation.
Comparisons to values obtained using established techniques
would enable determination of X-ray CT and FIB microscopy
suitability for visualising and characterising the 3D structure of
chromatography beads. Tortuosity evaluation of the internal pore
network in particular was of interest given the relative difficulty in
accurately measuring this aspect, despite its importance in relation
to mobile phase flow paths through internal bead structure.
2. Materials and methods
2.1. Chromatography bead source
Agarose beads used in this study were Capto Adhere resin from
GE Life Sciences (Uppsala, Sweden). Cellulose and ceramic materials were provided by Pall Biotech (Portsmouth, United Kingdom)
in the form of CM Ceramic HyperDTM F or MEP HyperCelTM 100 mL
sorbent containers in 20% ethanol storage buffers before drying
processes were performed in parallel. Investigations were performed in parallel for each bead type and so are referred to as
sample or beads collectively. Average bead diameters for agarose,
cellulose and ceramic beads were found to be 70 m, 86 m and
53 m respectively based on optical imaging of a small sample as
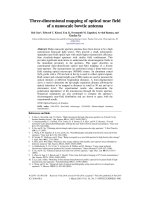
a reference on size, with whole bead X-ray slices available in Fig. 2.
T.F. Johnson et al. / J. Chromatogr. A 1566 (2018) 79–88
81
Table 1
Requirements and outputs for each tomography based technique used. Dimensions stated are total overall volumes analysed, with sub-volumes also generated in each case
for analysis purposes.
Technique
Preparation
Methods
Pixel size (nm)
X-ray computed tomography
Critical-point drying, pinhead adhesion
Focused ion beam microscopy
Drying, embedding, coating, milling
LFOV, Adjusted
High resolution
Slice and view
63
32
15 – 40
2.2. Sample preparation
Initial sample preparation was performed by dehydrating each
material type to a 100% ethanol concentration from the original
20% as a requirement for drying. Subsequent critical-point drying
[34] was performed using a Gatan critical-point dryer to displace
ethanol with carbon dioxide as performed by Nweke et al [35]. on
beads.
After critical-point drying, samples were sub-divided for X-ray
computed tomography and focused ion beam microscopy, which
required further preparation. For X-ray CT samples, an individual
bead was isolated and held in place on top of a sharp pin using
contact adhesive and stored in a sealed container for 24 h before
use to ensure that the bead had been correctly set in place before
scanning.
For FIB preparation, approximately 100 of each bead type were
inserted into a Struers (Westlake, Ohio, United States) 25 mm
mould, with a brass subdivide used in order to separate and isolate agarose, cellulose and ceramic samples. EpoFix (Struers) epoxy
and hardener mixture were added to fill the mould in 15:2 parts
respectively, before vacuum desiccation of the sample for 24 h to
remove trapped air from the sample.
The embedded puck was then removed from the desiccator
for smoothing of the sample surface to expose beads using silicon carbide sheets (Agar Scientific, Stansted, United Kingdom) of
increasing grit rating: 360, 600, 1,200, 2400 and finally 4000 before
diamond paste polishing; finishing with gold coating using an Agar
Scientific coater performed to increase sample conductivity and
reduce charging. Prepared samples were adhered to a 25 mm aluminium stub using conductive Leit C cement (Agar Scientific, United
Kingdom) with a silver bridge added in order to ensure conductivity
between the sample and stub.
2.3. X-ray computed tomography
A pin-mounted bead was placed in a Zeiss Xradia 810 Ultra
(Pleasanton, California, United States) at the Electrochemical Innovation Laboratory in UCL at an accelerating voltage of 35 kV used in
each case using a chromium target. The sample was rotated through
180◦ during imaging. Large Field Of View (LFOV) mode was used
to image the entire bead achieving a 63 nm pixel size. This was
improved to 32 nm using High Resolution (HRES) mode by applying binning mode 2 on a 16 nm original pixel size; however this
compromised the field of view to the top 16 m of the sample, of
which further cropping was often required.
2.4. Focused ion beam
Stub-mounted samples were inserted into a Zeiss XB1540
‘Crossbeam’, with an accelerating voltage of 1 kV used in secondary
electron detection mode for imaging with the stage tilted to 54◦
for crossbeam alignment. After selecting a suitable bead, 500 nm
thick platinum deposition was performed over the area of interest
in order to provide a smooth protective surface for precise milling
over the internal bead volume to be subsequently imaged.
A preparatory trench at a depth of approximately 30 m was
milled using the gallium ion beam at a current of 1 nA in order to
expose the protrusion capped by deposited platinum with block
face polishing performed at 200 pA. Subsequent ‘slice and view’
imaging and milling at 100 pA of the block face at set intervals
was used to generate a series of JPEG images for each sample. For
ceramic results, a cubic voxel size of 15 nm was used, whilst for
agarose and cellulose beads 20 nm width and height at a depth
of 40 nm was achieved in both cases. A Helios NanoLab 600 was
used instead for cellulose beads as a replacement system, however
the approach taken was in-line with settings used for the other
samples.
2.5. Image processing
As with image processing performed in a previous study [26],
either 2D images or 3D TXM files were loaded into Avizo® (FEI, Bordeaux, France). For FIB microscopy image sequences, the StackReg
plugin for ImageJ [36] was used to align all slices correctly before
insertion into Avizo for processing and analytical purposes [37–39].
The main objective of the processing stages was to produce an
accurate representation of internal bead structure by segmenting
material and void phases in addition to artefact removal.
For X-ray CT samples the same bead was used for LFOV and HRES
imaging, where extraction of a sub-volume at the relevant coordinates enabled generation of a LFOV volume in the same position
as the HRES counterpart for comparison purposes, with this new
volume referred to as ‘adjusted’ or ‘ADJ’ with Table 1 displaying
approaches used. Analysis of geometric porosity, geometric tortuosity, available surface area to volume ratio and average pore
diameter were calculated within Avizo, with tortuosity factor in
each case determined using the MATLAB® plugin TauFactor [23] by
using 3D TIFF files.
3. Results and discussion
3.1. X-ray computed tomography
To evaluate the porous structure in an individual chromatography bead using X-ray CT, two different modes were used
considering the trade-off between optimising pixel size and total
sample imaged. This was performed to determine the impact of
improving pixel size on both the capability for X-ray CT to accurately visualise the intricate structure of the bead in addition to
quantify parameters such as porosity and tortuosity. Fig. 2 displays
slices of cellulose and ceramic bead samples using LFOV and HRES
approaches using the best available cubic voxel size in each case
having respective dimensions of 63 nm and 32 nm.
It was observed that all 2D slices in Fig. 2 display an internal
porous structure for agarose, cellulose and ceramic beads, with
the characteristic shell visible around the ceramic sample. Large
voids were observed to occur for all materials within the internal
structure of the samples which was also visible in microtome slices
presented by Angelo et al. [8] for cellulose beads, which would have
been difficult to find without the use of 3D imaging techniques, with
penetration of the adherent epoxy also obscuring some structure.
The high resolution images were found to visualise a more intricate porous structure with smaller features relative to the large field
of view counterparts, which was particularly noticeable for cellu-
82
T.F. Johnson et al. / J. Chromatogr. A 1566 (2018) 79–88
Fig. 2. Chromatography bead imaging using X-ray computed tomography. A: Agarose bead imaged in large field of view mode. B: Agarose bead imaged in high resolution
mode. C: Cellulose bead imaged in large field of view mode. D: Cellulose bead imaged in high resolution mode. E: Ceramic bead imaged in large field of view mode. F: Ceramic
bead imaged in high resolution mode.
lose samples due to the larger pores that were visible at both scales,
but with high resolution images also displaying smaller surrounding pore networks.
This indicated that improving the pixel size from 63 nm to
32 nm enabled a greater degree of chromatography bead internal
structure identification and thus would be considered to be more
representative of the porous geometry within each bead, particularly for agarose and cellulose slices. However, using HRES mode
also limited the field of view to the top of the bead in each case, pre-
venting analysis of the entire sphere using this approach, requiring
a sub-volume LFOV imaging to be produced in order to provide
direct comparison between pixel sizes at the same coordinates for
each of the materials investigated.
X-ray CT was demonstrated to be capable of imaging the 3D
porous structure of various chromatography materials without
having to physically section the beads. This also enabled multiple
acquisitions of the same volume without destroying the sample
for optimisation purposes and comparisons between the resolu-
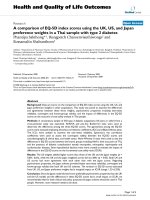
Fig. 3. Focused ion beam microscopy of chromatography beads. A: Coated sample puck with two bead types. B: ‘Overhead’ FIB view of a milled trench. C: Agarose block face.
D: Cellulose block face. E: Ceramic block face.
T.F. Johnson et al. / J. Chromatogr. A 1566 (2018) 79–88
83
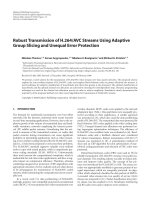
Fig. 4. Evaluation of cellulose bead 3D structure from a HRES scan. A: 2D slice overlaying a 3D render, blue and yellow – material, white – void. B: Porous distance map,
green <100 nm from material, yellow < 200 nm, red > 200 nm (For interpretation of the references to colour in this figure legend, the reader is referred to the web version of
this article).
tion and field of view. The main disadvantage of using X-ray CT
was the pixel size available because even when achieving 32 nm
in HRES mode, alternative techniques such as ISEC used on similar
materials [8] suggest that the finest structure may not have been
identified due the pore sizes being smaller than pixel dimensions
achieved by X-ray CT and FIB imaging, requiring a higher resolution
3D approach.
3.2. Focused ion beam microscopy
FIB has previously been used as a basis for analysing porous
materials, analogous to chromatography bead internal structure,
and so was selected to achieve an improved pixel size relative to Xray CT due to the differences observed between resolution and field
of view images. The difference in pixel size dimensions between Xray CT modes was approximately 2, therefore this approach was
kept constant for higher resolution FIB imaging by achieving pixel
size dimensions of 15 nm. Cubic voxels were preferred despite
potential further pixel size gains available using FIB, however this
would compromise the overall volume that could be imaged for
each sample and would present further imaging issues.
Whilst a 15 nm pixel size was achieved for ceramic imaging,
the softer agarose and cellulose displayed stability issues and so
required a reduction in both block face pixel size to 20 nm in addition to slice depth being increased to 40 nm. This was undesirable
in terms of both losing pixel size as well as preventing direct parity
across all FIB volumes in terms of voxel dimensions; however was
a necessary compromise for stable slice-and-view.
Important considerations involved with sample preparation
before imaging included ensuring that as much air was removed
from the sample during epoxy embedding as possible in order to
minimise disruptions to the continuous epoxy phase. Imaging difficulties at this stage would require artefact removal during digital
processing in addition to potentially compromising milling quality
in the local area by causing issues such as streaking effects [32].
Fig. 3 displays a sample puck containing 2 different bead types, an
overhead view of a bead after trench milling and block face slices
for the agarose, cellulose and ceramic beads.
It was observed in Fig. 3 that structure can be identified embedded within the epoxy for all materials, with again the characteristic
shell visible for the ceramic bead visible as was the case for X-ray
CT imaging. Platinum deposition that formed a smooth surface on
the top sample can be seen that was used to increase conductivity in addition to reducing streaking artefacts that distort the block
face in each slice, with the epoxy impregnation performed under
vacuum to minimise air pockets. Whilst artefact reduction before
reconstruction was successful, some instances still occurred and
required digital correction afterwards.
3.3. Comparison between X-ray CT and FIB
Both techniques have been demonstrated to be capable of producing visual representations of agarose, cellulose and ceramic
chromatography bead structure, although each technique had relative advantages and disadvantages. The main advantage of FIB
compared to X-ray CT was that the pixel size achievable was superior to either X-ray CT mode, potentially enabling smaller features
in the structure to be identified which would result in more accurate measurements of characteristics such as porosity and pore
sizes compared to ISEC etc.
However, a FIB approach did have several drawbacks, including
being a destructive technique, which meant that the sample could
only be imaged once unlike for X-ray CT where the same bead could
be examined multiple times, enabling comparative optimisation
[26]. The second disadvantage to using FIB was the increased sample preparation requirements, which could result in undesirable
changes to the sample itself [8], with the epoxy puck inherently
susceptible to air pockets and streaking artefacts that were minimised but not eliminated entirely. X-ray CT was also capable of
imaging the entire bead whilst using a FIB approach limited the
overall volume that could be prepared and then milled.
Overall, the superior pixel size achieved by FIB was countered
by various attributes that make X-ray CT relatively more convenient to use whilst still being able to resolve chromatography bead
internal structure. This highlights that suitable technique selection
relies on various factors that need to be considered in relation to
the sample itself and the final imaging requirements, of particular interest being the pixel size achievable in relation to expected
feature sizes. Both techniques performed considerably better for
ceramic beads compared to the softer agarose and cellulose samples, as stability issues were encountered using FIB and X-ray CT
imaging in particular for agarose and cellulose beads.
3.4. Tomographic analysis
The reconstructed volumes were processed in Avizo in order to
segment the bead and void phases, in addition to removing any
artefacts that had occurred due to sample preparation or imaging.
Digitally processed geometries were then analysed for porosity,
tortuosity factor, surface area to volume ratio and average pore
84
T.F. Johnson et al. / J. Chromatogr. A 1566 (2018) 79–88
Table 2
Results from tomography based analysis of bead volumes. Average values are presented in each case, with X-ray computed tomography – Adjusted being the same volume as
the reduced field of view results but taken from the large field of view data-set for comparison. Results are reported to three significant figures, with one standard deviation
displayed below the mean value. Surface area to volume ratio is normalised against the lowest average.
Edge
Agarose
Geometric porosity (%)
Geometric tortuosity
Surface area to volume ratio
Average pore diameter (m)
Cellulose
Geometric porosity (%)
Geometric tortuosity
Surface area to volume ratio
Average pore diameter (m)
Ceramic
Geometric porosity (%)
Geometric tortuosity
Surface area to volume ratio
Average pore diameter (m)
Centre
Top
Middle
Bottom
Top
Middle
Bottom
34.5
± 0.3
1.33
± 0.02
0.103
± 0.009
20.6
± 1.8
32.0
± 1.5
1.35
± 0.02
0.099
± 0.005
21.1
± 1.6
31.5
± 0.6
1.45
± 0.02
0.150
± 0.001
19.2
± 0.5
39.3
± 2.7
1.32
± 0.02
0.105
± 0.011
18.7
± 1.2
36.2
± 2.5
1.38
± 0.04
0.104
± 0.005
21.1
± 0.9
33.0
± 0.9
1.39
± 0.02
0.152
± 0.005
19.9
± 0.4
34.2
±0.4
1.81
±0.04
0.126
±0.003
10.0
±0.1
32.3
±2.0
1.77
±0.05
0.094
±0.007
10.2
±0.2
36.9
±0.7
1.59
±0.02
0.110
±0.001
9.4
±0.2
37.0
±3.3
1.79
±0.06
0.121
±0.002
10.0
±0.2
38.6
±0.4
1.79
±0.02
0.113
±0.001
11.1
±0.1
37.6
±0.7
1.62
±0.08
0.115
±0.008
9.0
±0.7
32.6
±0.8
1.47
±0.03
0.091
±0.002
10.7
±0.2
32.7
±0.8
1.40
±0.02
0.100
±0.003
10.6
±0.1
30.0
±0.6
1.42
±0.03
0.083
±0.002
11.0
±0.2
36.9
±1.5
1.39
±0.02
0.100
±0.004
11.7
±0.4
36.1
±0.9
1.34
±0.02
0.106
±0.001
10.9
±0.1
35.4
±1.0
1.36
±0.03
0.094
±0.003
12.1
±0.4
diameter. For X-ray CT LFOV samples, cubic volumes of 40 m
dimensions were analysed, whilst for HRES and FIB volumes dimensions of 10 m–15 m were obtained for structural quantification.
Using a 3D approach enabled visualisation of key aspects relating
to chromatographic structure, with Fig. 4 displaying outputs based
on cellulose HRES X-ray CT imaging.
Producing 3D representations of chromatography bead structure enabled visualisation of important geometric aspects such as
void-distance maps to aid understanding of chromatography bead
structure and pore geometry, with Fig. 5 showing results for porosity and pore size across the different materials and approaches used.
To provide direct comparison between LFOV and HRES X-ray CT
imaging for each bead, a sub-volume with identical co-ordinates
was produced with the difference being pixel size achieved in each
case. This was referred to as the ‘adjusted’ volume, or ‘ADJ.’
It was observed that X-ray CT porosity readings from Fig. 5 for
each material were similar between 63 nm and 32 nm pixel size
approaches used, with agarose and cellulose close to 70% in each
case and ceramic 65%. Ceramic beads of the same HyperD family
have previously been determined to have an average porosity of
61% using Maxwell derived equations based upon cross sectional
area available [14] suggesting that tomographic representation
was accurately determining porosity values for the overall ceramic
structure.
However, for agarose and cellulose beads porosity readings
are typically reported in the 80%–90% range using a variety of
established techniques such as ISEC on popular and commercially
available resins, although porosities down to below 70% have been
reported [1,4,40]. Therefore whilst the average porosities presented
here lie within these ranges, the tomographic approaches displayed
a considerably lower porosity to those values typically observed,
albeit dependent on variation between different types of agarose
and cellulose beads available. By using an improved average pixel
size via a focused ion beam slice and view approach between 15 nm
and 25 nm, increased porosities closer to 80% were observed that
were closer to expected values suggested by other methods such
as ISEC [14].
Whilst similarities in results were observed for overall bead
porosity between imaging techniques, clear disparities were apparent when evaluating average pore sizes. In all cases, the 63 nm X-ray
CT volumes were found to have a much larger average pore size
compared to the high resolution and FIB counterparts, despite the
similar overall porosities. This was attributed to the inferior pixel
size being unable to discern the finest chromatography bead structural features, supported by relative surface area to volume ratios
displayed in Table 2 being considerably higher for the improved
resolution approaches.
Average pore sizes suggested in literature using established
techniques cover a vast range for relevant bead materials, from
below 10 nm determined using ISEC [8] up to 100 nm [1], suggesting
the difficulty in accurately determining pore size. Whilst the large
field of view and adjusted counterparts displayed results above
130 nm in all cases, the higher resolution approaches suggested
values between 60 nm and 100 nm across each material which was
within the expected range and order of magnitude, albeit at the
higher values [1,4,8]. Angelo et al. [8] does discuss the potential
for SEM imaging for pore size determination of cellulose beads to
result in an approximate average of 50 nm on the surface.
Differences were expected between tomographic imaging
methods when determining average pore size due to the differing pixel dimensions, where the minimum theoretical pore size
would be 1 pixel. By obtaining an improved pixel size, finer porous
network could be resolved as can be seen in Fig. 2 when comparing LFOV and HRES X-ray CT visualisation of chromatography bead
structure. Whilst ceramic results displayed a decreasing average
pore size upon improving average voxel size, agarose and cellulose
counterparts have the smallest average pore size determine by Xray CT. This was attributed to despite having a superior average
T.F. Johnson et al. / J. Chromatogr. A 1566 (2018) 79–88
85
Fig. 5. Porosity readings for X-ray CT and FIB imaged volumes. A: Porosity. B: Average pore diameter.
voxel dimensions of 25 nm–32 nm, by compromising to a 40 nm
slice thickness the smallest pore structure obtainable was reduced
for softer bead materials.
Overall, tomographic quantification demonstrated that for
aspects such as average pore size evaluation, achieving the best
pixel size possible was favourable to obtain more representative
results by using either high resolution X-ray CT or FIB. However,
for overall porosity measurements there was no major difference
between X-ray CT imaging of the same bead even at different pixel
sizes. This suggested that the technique used for tomographic imaging should also be based upon the desired outcomes, as using higher
resolution methods can include required compromises such as field
of view loss.
Whilst aspects such as porosity are relatively straightforward to
characterise using existing non-imaging methods for chromatography beads, others such as tortuosity have been both ill-defined and
quantified despite the inherent importance to liquid flow paths and
thus transfer between phases [9,14]. Using a tomographic approach
in other fields has been found to be an effective way to evaluate
tortuosity, with continued efforts to standardise and better represent this factor [23]. Therefore two methods were selected for this
study: geometric tortuosity and tortuosity factor based upon the 3D
volumes produced from imaging. The geometric variant was determined by relating the average path length through a segmented
porous volume to the shortest distance possible being commonplace [24,41].
Tortuosity factor was evaluated using TauFactor software that
considers simulated steady state diffusion through the tomographic structure that is compatible with existing fundamental
relationships [23]. This enabled a more complex evaluation
of tortuosity compared to geometric tortuosity which relies
on slice-to-slice positional movement without consideration of
geometry-based flux constrictions. Results for both geometric tortuosity and tortuosity factor variants are displayed in Fig. 6.
Tortuosity results for both measurement approaches were
found to be below 2, which was at the lower end of the range
as reported by 6 other studies into tortuosity of chromatography
beads using other methods [9,14]. A highly porous structure reconstructed from tomographic imaging as was obtained in each case
here would result in low tortuosity readings, however the method
for determining tortuosity is a major factor to consider [24], particularly given the relatively lower porosities here compared to other
methods. As expected, tortuosity factor was found to be greater
than geometric counterparts for all materials and tomographic
methods, with an average difference of 0.22 for softer agarose and
cellulose volumes and 0.07 for ceramic counterparts.
This was attributed to tortuosity factor considering neighbouring pixels of the same phase, which allows for a greater appreciation
of an increased tortuosity in regions with finer pore sizes that are
less represented when evaluating geometric tortuosity that relies
upon a scalar flow through pores regardless of size and is solely
impacted by relative void position and slice-to-slice movement.
However, inconsistencies between Avizo and TauFactor results
have been documented by Cooper et al. [23] and so may be a contributing factor here.
A major advantage of using a tomographic approach for 3D
imaging and reconstruction for visualisation of chromatography
bead internal structure was that the digital volume could be quantitatively analysed for various important geometric characteristics.
This also enabled comparison of results to those obtained in literature using established techniques that have either relied on
alternative imaging techniques or non-imaging methods including
ISEC, BET and mercury porosimetry, which have been compared for
porosity, tortuosity and average pore sizes in Table 3.
This suggested that further improvements to pixel size would
endeavour in improving pore size determination accuracy for
tomographic techniques when considering conventional chromatography beads, however the soft materials commonly used for
resins provided issues that required compromises to aspects such
as resolution to obtain stable imaging.
Achieving an optimal or relevant pixel size relies on knowing
the smallest feature sizes in the structure [42] and is important for
producing truly accurate representations of 3D structure at sufficient resolution, particularly if aspects such as average pore size are
to be investigated that heavily rely on being able to resolve even
the smallest pores. However, these approaches have been found
to require several compromises in order to obtain high quality 3D
representations compared to large field of view X-ray CT scanning.
The first of these was field of view, where an entire bead could
be imaged when using X-ray CT at a 63 nm pixel size, but for the
high resolution counterpart, only the very top of the spherical sample could be imaged due to the field of view constraints. The most
credible way to image an entire bead of approximately 50 m in
diameter would be to perform mosaic scans, where many data-sets
are acquired using HRES mode and then digitally stitched together
to produce an overall volume that could cover the entire bead volume whilst maintaining a 32 nm voxel size.
However, this approach was deemed to be impractical as this
would require a vast amount of time to achieve this, particularly
problematic for the agarose and cellulose beads that displayed stability issues when exposed to the X-ray beam for any considerable
amount of time. Another problem with mosaic imaging at such high
quality is that in order to image the very centre of the sphere, a
considerable amount of surrounding material would obscure the
beam, detrimentally impacting the signal-to-noise ratio of imaging
and also presenting issues when accurately determining volume
boundaries.
FIB lift-outs [32] for X-ray CT could be attempted in order to alleviate this issue, however bead-epoxy definition would be required
and the overall process would be more intensive than imaging using
FIB itself. Simulating tortuosity factor in different orientations for
the volumes examined was not found to produce results of particular difference to each other and so pore structure was not observed
to have major directional disparities for tortuosity, with distance
86
T.F. Johnson et al. / J. Chromatogr. A 1566 (2018) 79–88
Fig. 6. Tortuosity readings of individual bead volumes. A: Geometric tortuosity. B: Tortuosity factor.
Table 3
Comparison of tomographic results of HRES X-ray CT to other methods. Tortuosity displayed for tomographic approaches is tortuosity factor. Overall bed porosity calculations
for tomographic approaches are based upon inter-bead volume determined in a previous study [26] combined with overall bead porosity of the remaining stationary phase
in each case, where column dimensions may not be identical in all cases. Different bead brands may have been joined under material groups [1,4,8,14,26].
Agarose
Tomography
Barrande et al.
Angelo et al.
DePhillips et al.
Tatárová et al.
Cellulose
Tomography
Barrande et al.
Angelo et al.
Tatárová et al.
Ceramic
Tomography
Barrande et al.
DePhillips et al.
Methods
Porosity (%)
Tortuosity
Average pore size (nm)
Overall bed porosity (%)
X-ray CT HRES
BET, Mercury porosimetry
ISEC
ISEC
ISEC
71
87
1.5
1.32
84
37
11.8 – 51.6
49.4 – 54.6
28.8 – 109.8
81
92
X-ray CT HRES
BET, Mercury porosimetry
ISEC, EM
ISEC
70
90
66 – 74
1.45
1.3
78
19
8.8-10 (∼50 for EM)
47.4
81
91
78 – 83
X-ray CT HRES
BET, Mercury porosimetry
ISEC
65
61
59 – 65
1.56
1.97
71
22
21 – 68
77
85
74 – 78
84
maps such as displayed in Fig. 4B useful for visualising chromatography bead structure. Tomographic approaches have also enabled
consideration of pore geometry and morphologies, although the
main value of interest here was average pore size for comparing to
results obtained using ISEC and other approaches.
Table 3 displays comparisons of porosity, tortuosity and average pore sizes to existing literature values based upon established
methods, where BET has also been commonly used to evaluate
available surface area of internal bead structure [14] that was investigated in relative terms between tomographic techniques here.
ISEC has been used for all 3 bead materials to quantify porosities
and pore sizes, where overall bed porosity that includes interbead voidage had been determined. This could be quantified using
3D imaging by combining porosities obtained here with values
obtained in a previous study [26].
Aforementioned lower porosities obtained using the various
tomographic approaches resulted in corresponding reduced overall
column porosities, although the exact bed geometry in each study
was not identical. Whilst pore sizes were typically higher compared to other methods such as ISEC and mercury porosimetry, the
same order of magnitude was achieved and results were in-line
with values reported when imaging bead surfaces using electron
microscopy [8,35].
Overall, these results suggested that the pixel sizes used were
suitable for imaging bead internal structure, however the higher
resolution approach of X-ray CT and FIB were more appropriate
for quantification of characteristics such as pore size due to their
inherent sensitivity to the smallest features that suggest results
closer to those suggested by orthogonal methods [8,9]. On the
contrary, aspects such as tortuosity did not show a definitive or reliable change when using higher resolution approaches, suggesting
that visually identifying major pore networks would be sufficient
90
to approximate a tortuosity factor for the material, without the
necessity of achieving a pixel size to accurately image the smallest features that may present other imaging considerations and
obstacles.
4. Conclusions
X-ray CT and FIB have been demonstrated to be effective methods for imaging the 3D internal structure of three chromatography
bead materials, yielding quantitative results that are relatable
to established approaches for measurement. Different pixel sizes
achieved were compared both between and within tomographic
techniques explored here that highlighted the benefits of using
nano-scale resolution approaches to both visualise and evaluate bead structure, in addition to requirements for representative
imaging. Limitations, particularly when considering the softer bead
types, resulted in constraints and thus compromises that would
result in a greater degree of the smallest porous structures being
obscured. These trade-offs may be possible to overcome upon technology advancement.
Future areas of interest include expanding the technique and
material portfolio, as well as investigating chromatography use
and application based impacts on bead structure. This would be
greatly enhanced by improvement in X-ray CT or FIB technology
by either further improving pixel sizes attainable whilst reducing constraints; as well as the availability of new techniques or
technologies that enable new approaches to obtaining high quality
tomographic representations of chromatography beads, including
the smallest feature sizes. This would provide greater insight of
how bead structure relates to important geometric factors such as
tortuosity.
T.F. Johnson et al. / J. Chromatogr. A 1566 (2018) 79–88
Acknowledgements
This research was supported by the UK Engineering and Physical
Sciences Research Council (EPSRC) grant EP/L01520X/1. Paul Shearing acknowledges support from the Royal Academy of Engineering.
We would like to thank Pall Biotech, Portsmouth, United Kingdom, for the supply and expertise concerning cellulose and ceramic
chromatography materials, with particular gratitude towards Dave
Hayden and Nigel Jackson. At the UCL Electrochemical Innovation
Lab, Leon Brown and Bernhard Tjaden are thanked for constructive guidance and useful conversations. Focused ion beam was
performed at the London Centre for Nanotechnology and Imperial
College London Department of Materials, with thanks to Suguo Huo
and Ecaterina Ware respectively.
[16]
[17]
[18]
[19]
[20]
[21]
Appendix A. Supplementary data
Supplementary material related to this article can be found, in
the online version, at doi: />06.054.
[22]
[23]
[24]
References
[1] I. Tatárová, M. Gramblicka, M. Antosová, M. Polakovic, Characterization of
pore structure of chromatographic adsorbents employed in separation of
monoclonal antibodies using size-exclusion techniques, J. Chromatogr. A
1193 (June (1–2)) (2008) 129–135.
[2] D.E. Cherrak, G. Guiochon, Phenomenological study of the bed–wall friction in
axially compressed packed chromatographic columns, J. Chromatogr. A 911
(March (2)) (2001) 147–166, />[3] S. Gerontas, M.S. Shapiro, D.G. Bracewell, Chromatography modelling to
describe protein adsorption at bead level, J. Chromatogr. A 1284 (April (52))
(2013) 44–52, />[4] P. DePhillips, A.M. Lenhoff, Pore size distributions of cation-exchange
adsorbents determined by inverse size-exclusion chromatography, J.
Chromatogr. A 883 (June (1–2)) (2000) 39–54, />S0021-9673(00)00420-9.
[5] K.-F. Du, M. Yan, Q.-Y. Wang, H. Song, Preparation and characterization of
novel macroporous cellulose beads regenerated from ionic liquid for fast
chromatography, J. Chromatogr. A 1217 (February (8)) (2010) 1298–1304,
/>[6] B.D. Bowes, H. Koku, K.J. Czymmek, A.M. Lenhoff, Protein adsorption and
transport in dextran-modified ion-exchange media. I: adsorption, J.
Chromatogr. A 1216 (November (45)) (2009) 7774–7784, />1016/j.chroma.2009.09.014.
[7] T. Müller-Späth, G. Ströhlein, L. Aumann, H. Kornmann, P. Valax, L. Delegrange,
E. Charbaut, G. Baer, a Lamproye, M. Jöhnck, M. Schulte, M. Morbidelli, Model
simulation and experimental verification of a cation-exchange IgG capture
step in batch and continuous chromatography, J. Chromatogr. A 1218 (August
(31)) (2011) 5195–5204, />[8] J.M. Angelo, A. Cvetkovic, R. Gantier, A.M. Lenhoff, Characterization of
cross-linked cellulosic ion-exchange adsorbents: 1. Structural properties, J.
Chromatogr. A 1319 (December) (2013) 46–56, />chroma.2013.10.003.
[9] V. Wernert, R. Bouchet, R. Denoyel, Impact of the solute exclusion on the bed
longitudinal diffusion coefficient and particle intra-tortuosity determined by
ISEC, J. Chromatogr. A 1325 (January) (2014) 179–185, />1016/j.chroma.2013.12.029.
[10] E.J. Close, J.R. Salm, T. Iskra, E. Sørensen, D.G. Bracewell, Fouling of an anion
exchange chromatography operation in a monoclonal antibody process:
visualization and kinetic studies, Biotechnol. Bioeng. 110 (September (9))
(2013) 2425–2435, />[11] S.C. Siu, R. Boushaba, V. Topoyassakul, A. Graham, S. Choudhury, G. Moss, N.J.
Titchener-Hooker, Visualising fouling of a chromatographic matrix using
confocal scanning laser microscopy, Biotechnol. Bioeng. 95 (November (4))
(2006) 714–723, />[12] Y. Yao, A.M. Lenhoff, Determination of pore size distributions of porous
chromatographic adsorbents by inverse size-exclusion chromatography, J.
Chromatogr. A 1037 (May (1–2)) (2004) 273–282, />chroma.2004.02.054.
[13] L. Hagel, M. Ostberg, T. Andersson, Apparent pore size distributions of
chromatography media, J. Chromatogr. A 743 (1996) 33–42, />10.1016/0021-9673(96)00130-6.
[14] M. Barrande, R. Bouchet, R. Denoyel, Tortuosity of porous particles, Anal.
Chem. 79 (23) (2007) 9115–9121, />[15] M.S. Shapiro, S.J. Haswell, G.J. Lye, D.G. Bracewell, Design and characterization
of a microfluidic packed bed system for protein breakthrough and dynamic
[25]
[26]
[27]
[28]
[29]
[30]
[31]
[32]
[33]
[34]
[35]
[36]
[37]
[38]
[39]
87
binding capacity determination, Biotechnol. Prog. (2009) 277–285, http://dx.
doi.org/10.1021/bp.99.
L.E. Blue, E.G. Franklin, J.M. Godinho, J.P. Grinias, K.M. Grinias, D.B. Lunn, S.M.
Moore, Recent advances in capillary ultrahigh pressure liquid
chromatography, J. Chromatogr. A 1523 (2017) 17–39, />1016/j.chroma.2017.05.039.
J. Jin, S. Chhatre, N.J. Titchener-Hooker, D.G. Bracewell, Evaluation of the
impact of lipid fouling during the chromatographic purification of virus-like
particles from saccharomyces cerevisiae, J. Chem. Technol. Biotechnol. 2009
(June 2009) (2009), />M. Pathak, A.S. Rathore, Mechanistic understanding of fouling of protein a
chromatography resin, J. Chromatogr. A 1459 (August) (2016) 78–88, http://
dx.doi.org/10.1016/j.chroma.2016.06.084.
W. Denk, H. Horstmann, Serial block-face scanning electron microscopy to
reconstruct three-dimensional tissue nanostructure, PLoS Biol. 2 (November
(11)) (2004), />A. Kim, H. Chen, Diffusive tortuosity factor of solid cake layers: a random walk
simulation approach, J. Membrane Science 279 (2006) 129–139, .
org/10.1016/j.memsci.2005.11.042.
A. Zankel, J. Wagner, P. Poelt, Serial sectioning methods for 3D investigations
in materials science, Micron 62 (July) (2014) 66–78.
D. Kehrwald, P.R. Shearing, N.P. Brandon, P.K. Sinha, S.J. Harris, Local tortuosity
inhomogeneities in a lithium Battery composite electrode, J. Electrochem. Soc.
158 (12) (2011) A1393, />S.J. Cooper, A. Bertei, P.R. Shearing, J.A. Kilner, N.P. Brandon, TauFactor : an
open-source application for calculating tortuosity factors from tomographic
data, SoftwareX 5 (2016) 203–210, />002.
B. Tjaden, S.J. Cooper, D.J. Brett, D. Kramer, P.R. Shearing, On the origin and
application of the Bruggeman correlation for analysing transport phenomena
in electrochemical systems, Curr. Opin. Chem. Eng. 12 (May) (2016) 44–51,
/>J.R. Izzo, A.S. Joshi, K.N. Grew, W.K.S. Chiu, A. Tkachuk, S.H. Wang, W. Yun,
Nondestructive reconstruction and analysis of SOFC anodes using X-ray
computed tomography at sub-50 nm Resolution, J. Electrochem. Soc. 155 (5)
(2008) B504, />T.F. Johnson, P.R. Levison, P.R. Shearing, D.G. Bracewell, X-ray computed
tomography of packed bed chromatography columns for three dimensional
imaging and analysis, J. Chromatogr. A 1487 (January) (2017) 108–115, http://
dx.doi.org/10.1016/j.chroma.2017.01.013.
P.J. Withers, X-ray nanotomography, Mater. Today 10 (December (12)) (2007)
26–34, />P.R. Shearing, J. Gelb, N.P. Brandon, X-ray nano computerised tomography of
SOFC electrodes using a focused ion beam sample-preparation technique, J.
Eur. Ceram. Soc. 30 (June (8)) (2010) 1809–1814, />jeurceramsoc.2010.02.004.
D. Attwood, Nanotomography comes of age, Nature 442 (August) (2006)
642–643, />S. Reyntjens, R. Puers, A review of focused ion beam applications in
microsystem technology, J. Micromechanics Microengineering 11 (July (4))
(2001) 287–300, />J.J. Bailey, T.M.M. Heenan, D.P. Finegan, X. Lu, S.R. Daemi, F. Iacoviello, N.R.
Backeberg, O.O. Taiwo, D.J.L. Brett, A. Atkinson, P.R. Shearing,
Laser-preparation of geometrically optimised samples for X-ray nano-CT, J.
Microsc. 267 (3) (2017) 384–396, />P.R. Shearing, J. Golbert, R.J. Chater, N.P. Brandon, 3D reconstruction of SOFC
anodes using a focused ion beam lift-out technique, Chem. Eng. Sci. 64
(September (17)) (2009) 3928–3933, />038.
J. Baek, A.R. Pineda, N.J. Pelc, To bin or not to bin? The effect of CT system
limiting resolution on noise and detectability, Phys. Med. Biol. 58 (March (5))
(2013) 1433–1446, />D. Bray, Critical Point drying of biological specimens for scanning electron
microscopy, Supercrit. Fluid. Methods Protoc. Methods Biotechnol. 13 (2000)
235–243, />M.C. Nweke, M. Turmaine, R.G. Mccartney, D.G. Bracewell, Drying techniques
for the visualisation of agarose-based chromatography media by scanning
electron microscopy Drying techniques for the visualization of agarose-based
chromatography media by scanning electron microscopy, Biotechnol. J.
(March) (2017), />M.D. Abràmoff, I. Hospitals, P.J. Magalhães, M. Abràmoff, Image processing
with ImageJ, Biophotonics Int. 11 (7) (2004) 36–42, ISSN 1081-8693.
F. Tariq, V. Yufit, M. Kishimoto, P.R. Shearing, S. Menkin, D. Golodnitsky, J.
Gelb, E. Peled, N.P. Brandon, Three-dimensional high resolution X-ray imaging
and quantification of lithium ion battery mesocarbon microbead anodes, J.
Power Sources 248 (February) (2014) 1014–1020, />jpowsour.2013.08.147.
L. Leu, S. Berg, F. Enzmann, R.T. Armstrong, M. Kersten, Fast X-ray
micro-tomography of multiphase flow in berea sandstone: a sensitivity study
on image processing, Transp. Porous Media 105 (September (2)) (2014)
451–469, />T.L. Burnett, S. a McDonald, a Gholinia, R. Geurts, M. Janus, T. Slater, S.J. Haigh,
C. Ornek, F. Almuaili, D.L. Engelberg, G.E. Thompson, P.J. Withers, Correlative
tomography, Sci. Rep. 4 (January) (2014) 4711, />srep04711.
88
T.F. Johnson et al. / J. Chromatogr. A 1566 (2018) 79–88
[40] J.M. Angelo, A. Cvetkovic, R. Gantier, A.M. Lenhoff, Characterization of
cross-linked cellulosic ion-exchange adsorbents: 2. Protein sorption and
transport, J. Chromatogr. A 1438 (2016) 100–112, />chroma.2016.02.019.
[41] B. Tjaden, J. Lane, T.P. Neville, L.D. Brown, T.J. Mason, C. Tan, M.M.
Lounasvuori, D.J.L. Brett, P.R. Shearing, Comparison of ionic and diffusive mass
transport resistance in porous structures, Electrochem. Soc. Trans. 75 (42)
(2017) 135–145, />[42] G.M. Somfai, E. Tátrai, L. Laurik, B.E. Varga, V. Ölvedy, W.E. Smiddy, R.
Tchitnga, A. Somogyi, D.C. Debuc, Fractal-based analysis of optical coherence
tomography data to quantify retinal tissue damage, BMC Bioinf. (2014) 1–10,
/>