Packing quality, protein binding capacity and separation efficiency of pre-packed columns ranging from 1 mL laboratory to 57 L industrial scale
Bạn đang xem bản rút gọn của tài liệu. Xem và tải ngay bản đầy đủ của tài liệu tại đây (1.79 MB, 8 trang )
Journal of Chromatography A, 1591 (2019) 79–86
Contents lists available at ScienceDirect
Journal of Chromatography A
journal homepage: www.elsevier.com/locate/chroma
Packing quality, protein binding capacity and separation efficiency of
pre-packed columns ranging from 1 mL laboratory to 57 L industrial
scale
Susanne Schweiger a , Eva Berger a , Alan Chan b , James Peyser b , Christine Gebski b ,
Alois Jungbauer a,c,∗
a
Austrian Centre of Industrial Biotechnology, Vienna, Austria
Repligen Corporation, Waltham, MA, United States
c
Department of Biotechnology, University of Natural Resources and Life Sciences, Vienna, Austria
b
a r t i c l e
i n f o
Article history:
Received 25 January 2018
Received in revised form
28 September 2018
Accepted 7 January 2019
Available online 8 January 2019
Keywords:
Scalability
Preparative chromatography
Breakthrough
Step gradient separation
Buffer mixing
Column performance
a b s t r a c t
Pre-packed chromatography columns are routinely used in downstream process development and scaledown studies. In recent years they have also been widely adopted for large scale, cGMP manufacturing of
biopharmaceuticals. Despite columns being qualified at their point of manufacture before release for sale,
the suitability of pre-packed chromatography columns for protein separations at different scales has not
yet been demonstrated. In this study, we demonstrated that the performance results obtained with small
scale columns (0.5 cm diameter × 5 cm length, 1 mL column volume) are scalable to production sized
columns (60 cm diameter × 20 cm length, 57 L column volume). The columns were characterized with
acetone and blue dextran pulses to determine the packing density and packed bed consistency. Chromatography performance was evaluated with breakthrough curves including capacity measurements and
with separation of a ternary protein mixture (lysozyme, cytochrome C and RNase A) with a step gradient.
The equilibrium binding capacity and dynamic binding capacity were equivalent for all columns. The
step gradient separation of the ternary protein mixture displayed similar peak profiles when normalized
in respect to column volume and the eluted protein pools had the same purities for all scales. Scalable
performance of pre-packed columns is demonstrated but as with conventionally packed columns the
influence of extra column volume and system configurations, especially buffer mixing, must be taken
into account when comparing separations at different scales.
© 2019 The Authors. Published by Elsevier B.V. This is an open access article under the CC BY license
( />
1. Introduction
Disposable technologies are getting increasingly popular for
production of biopharmaceuticals [1–5]. Pre-packed preparative
chromatography columns are commercially available in a range
of sizes, from 50 L to 85 L columns volumes, and are used for
purification process development, pre-clinical, clinical and commercial manufacturing in batch and integrated continuous modes.
Columns are individually qualified during manufacture, and are
shown to be functional in stand-alone unit operations, but the chromatographic performance of pre-packed columns across scales has
yet to be demonstrated. In the bioprocess industry, multiple the-
∗ Corresponding author at: University of Natural Resources and Life Sciences,
Vienna, Department of Biotechnology, Muthgasse 18, 1190, Wien, Austria.
E-mail address: (A. Jungbauer).
oretical and practical approaches have been described to ensure
the scalable performance of chromatography columns. The most
important parameter for scalability of packed beds from small to
large scale is the same packing quality at all scales [6]. In addition, extra column effects must be considered to derive reliable
scale-up predictions of performance [7]. Assessment of changes in
buffer transition curves can be used for the determination of correction factors to more effectively predict elution behavior at a larger
scale [8]. Chromatography column operation is scaled up by keeping residence time constant when mass transfer is the governing
band broadening mechanism. In a conservative approach, this is
achieved by maintaining a constant column bed height, increasing
the column diameter and maintaining superficial velocities and the
ratio of sample load volume to column volume across all scales.
It has previously been shown that small scale pre-packed
columns can be manufactured over a ten year period with
consistent packed bed quality [9]. The column-to-column pack-
/>0021-9673/© 2019 The Authors. Published by Elsevier B.V. This is an open access article under the CC BY license ( />
80
S. Schweiger et al. / J. Chromatogr. A 1591 (2019) 79–86
ing variation of small scale pre-packed columns was quantified
recently [10] and considered sufficiently low to perform process development and scale down studies. Moreover, pre-packed
columns from 0.2 to 20 mL column volumes, packed with different
media, are scalable [11] shown by qualification results obtained
with non-retained acetone pulses. From the column qualification
results, it can then be assumed that column performance with
proteins will also be scalable, since extra column effects and the
packing quality become less important for retained proteins. The
performance of large scale pre-packed columns has been shown to
be comparable to self-packed columns [12].
Pre-packed columns designed for operation by robotic liquid
handling systems were used to model separations of 1 mL laboratory scale columns [13,14] or even of larger self-packed columns
[15–17]. The scalability of pre-packed columns from benchtop to
production scale for protein separations has not been demonstrated
yet. For demonstration of scalability over a wide range of column
volumes the system contribution must be taken into account. In
particular this is the contribution of the mixer forming the step gradients. It is known that system contributions are a larger percentage
of total broadening at a small scale. A simple parameter for evaluating the system contribution is the time constant of the mixer. We
have described it by a logistic growth function. The change of the
mobile phase modifier concentration is fitted over time or volume
and a constant is obtained for each scale. These data can be further
correlated and used for scale-up predictions.
In this study, we investigate whether protein separations can
easily be scaled up using pre-packed chromatography columns
with volumes ranging from 1 mL to 57 L. Suitability of pre-packed
columns over the whole range is demonstrated by comparing
breakthrough curves and the resulting binding capacities. Additionally, a ternary protein mixture was separated at all column scales
using a step gradient method. Effectiveness of the protein separation was determined by analyzing the purity of the individual
protein fractions by RP-HPLC. Also, the relationship between relative peak positions and the slope of the gradients at each scale was
established.
2. Materials and methods
2.1. Chemicals and proteins
®
For all experiments with OPUS MiniChrom and ValiChrom
columns, Tris, sodium chloride, disodium hydrogen phosphate
dihydrate and trifluoroacetic acid were obtained from Merck
Millipore (Darmstadt, Germany), acetone was purchased from
VWR chemicals (Fontenay-sous-Bois, France) and acetonitrile
was obtained from Avantor Performance Materials (Deventer,
Netherlands).
®
For all experiments with OPUS large scale 10–60 cm diameter columns, Tris was purchased from AmericanBio (Natick, US),
sodium chloride was obtained from Amresco (Solon, US), sodium
phosphate dibasic anhydrous was obtained from Fisher Chemical
(Hampton, US) and acetonitrile, trifluoroacetic acid and acetone
were purchased from EMD (now Merck Millipore, Darmstadt,
Germany). For all columns, blue dextran was obtained from Sigma
(St. Louis, US).
Lysozyme was obtained from Henan Senyuan Biological Technology (Henan, China). The purity of the lysozyme was determined
to be 87% by size exclusion-HPLC (SEC-HPLC). Cytochrome c
and ribonuclease A were purchased from Xi’an Health Biochem
Technology Co. (Xi’an, China). The purities of cytochrome c and
ribonuclease A were determined to be 93% and 70%, respectively,
by size exclusion-HPLC.
Table 1
®
Properties of the OPUS pre-packed chromatography columns evaluated.
Type
Inner Diameter [cm]
Bed height [cm]
Volume [L]
MiniChrom
MiniChrom
MiniChrom
ValiChrom
ValiChrom
ValiChrom
ValiChrom
OPUS 10
OPUS 45
OPUS 60
0.5
0.8
1.13
0.8
1.13
1.6
2.5
10.0
45.7
60.0
5.0
10.0
10.0
20.0
20.0
20.0
20.0
20.0
20.2
20.0
0.001
0.005
0.01
0.01
0.02
0.04
0.1
1.57
33.1
56.5
2.2. Pre-packed columns and chromatography systems
®
®
We used pre-packed OPUS MiniChrom, OPUS ValiChrom and
®
OPUS 10–60 cm ID (Repligen Corp, Waltham, US and Ravensburg,
Germany) for the experiments. All were packed with the 65 m
cation exchange medium Toyopearl SP-650 M (Tosoh, Tokyo,
Japan). Information on the column lengths, diameters and volumes
are given in
Table 1.
MiniChrom and ValiChrom columns were operated with an
TM
ÄKTA pure 25 M2 chromatography system (GE Healthcare, Uppsala, Sweden), which was controlled with Unicorn Software 6.4.
The OPUS 10 cm column was run on an ÄKTA pilot chromatography system (GE Healthcare). All other OPUS columns were operated
with QuattroFlow 1200S pumps (PSG, Oakbrook Terrace, US) to
deliver the running buffer and the load material, and a peristaltic
pump 520SN/R2 (Watson Marlow, Wilmington, US) to inject the
pulses. The maximum achievable flow rate of the peristaltic pump
was 3.2 L/min, resulting in lower flow rates during injection for the
45.7 cm and 60 cm ID columns. A split flow path after the column
allowed for UV and conductivity detection on the ÄKTA pilot.
2.3. Acetone pulses
Pulse response experiments were performed with acetone (1%,
v/v) as a small non-binding solute. The injected pulse volumes were
10 l for all 0.5 cm ID MiniChrom and ValiChrom columns, 50 l for
all ValiChrom columns with 0.8 cm ID, and 500 l for all ValiChrom
columns with 1.13 cm ID. For all larger columns, 1% of the column
volume was injected. The running buffer was 50 mM Tris, 0.9% (w/v)
sodium chloride, pH 8.0 (pH adjusted with HCl). Pulse response
experiments were performed at superficial velocities of 60, 100,
150 and 250 cm/h. The chromatograms from the acetone pulses
were analyzed by direct numerical integration.
2.4. Breakthrough experiments
Lysozyme was loaded on all columns up to 45.7 cm ID until full
breakthrough. The formulation of the loading buffer was designed
to reduce the binding capacity of the media so as to minimize the
amount of lysozyme required for the analysis. The running buffer
was 25 mM Na2 PO4 , 170 mM NaCl, pH 7.5. Lysozyme at 6 mg/mL
in running buffer was loaded at an 8 min residence time onto
the column until 100% breakthrough was observed. After washing
with running buffer, the bound lysozyme was eluted with 25 mM
Na2 PO4 , 1 M NaCl, pH 7.5. Between each process step, the chromatography system tubing was primed from the buffer inlet to the
injection valve with the required solution, so as to minimize extra
column effects. One breakthrough curve was obtained for each column size. EBC (equilibrium binding capacity) and DBC (dynamic
binding capacity) were determined by direct numerical integration
of the breakthrough curves. The breakthrough curves were inte-
S. Schweiger et al. / J. Chromatogr. A 1591 (2019) 79–86
grated from 0 < c/cF < 1 for determination of the total EBC. The EBC of
the impurities was determined by integration of the breakthrough
curve to the height of the first plateau after early impurity breakthrough. The EBC of the lysozyme was calculated by subtracting
the impurity EBC from the total EBC. DBC was determined similarly by integration until c/cF = 0.1 after deduction of the height of
the impurity plateau. The same was done for determination of the
slopes at 50% of the lysozyme breakthrough, which is equivalent to
a total height of c/cF = 0.517. Values within 10% above and below
that point were used for linear fitting to calculate the slope.
81
2.7. Extra particle porosities
For determination of the extra particle porosity, a 5% CV pulse
of 2 mg/mL blue dextran dissolved in 1 M NaCl was injected into
the columns at a linear velocity of 250 cm/h. The mobile phase was
1 M NaCl. The pulses were corrected for the contributions of the
extra column volume for calculation of the extra particle porosity. Only the position of the peak maximum was considered for
determination of the extra particle porosity.
2.8. Isotherms
2.5. Step gradient experiments
The separation of lysozyme, ribonuclease A and cytochrome
c was investigated using a multi-step gradient. We used 25 mM
Na2 PO4 pH 6.5 as running buffer and 25 mM Na2 PO4 , 1 M NaCl
pH 6.5 as the elution buffer. A mixture of 5 mg/mL lysozyme,
7.13 mg/mL cytochrome c and 12.56 mg/mL ribonuclease A was formulated in running buffer. The columns were loaded with a 5% CV
injection at an 8 min residence time. After washing with at least 4
CVs of running buffer, the three proteins were eluted with three
separate steps of 4%, 12% and 26% buffer B. Each step was held
until the UV signal returned to the baseline level. The amount of
buffer required for each step varied with column size, but in each
instance at least 3.5 CV for each elution step was used. The residual protein bound following the third elution step was stripped
with 100% B buffer. One step gradient experiment was performed
on each column size. During each step of the gradient elutions, 0.5
CV fractions were collected. Fractions containing protein according to the 280 nm UV signal were pooled and analyzed by reversed
phase-HPLC. For peak analysis, the two peaks of each elution step
were fitted to two Gaussian peaks. The respective peak retention
times, widths, areas and the resolution was calculated from the
fitted Gaussian functions.
2.6. Reversed-phase HPLC analysis
The purity of the load material and fractions collected during
each elution step gradient was determined by RP-HPLC using a
Discovery BIO Wide Pore C5 column (Supelco, Bellefonte, US) with
5 m particles, 4.6 mm ID and 15 cm length. For the analytics of
the MiniChrom and ValiChrom columns, all runs were made on a
Waters Alliance HPLC system with an e2695 Separations Module
(Milford, US). The samples collected from the larger columns were
analyzed on an Agilent HPLC system 1100 series (Santa Clara, US).
The column was operated at a flow rate of 1 mL/min at a temperature of 25 ◦ C. Solvent A was 0.1% TFA in water and solvent B was
0.1% TFA in acetonitrile. The column was equilibrated for 2 min at
25% B and then 10 l of sample containing 0.1% TFA was injected.
A linear gradient from 25 to 75 % B was run for 15 min. Peaks were
detected at a wavelength of 214 nm. After 17 min the column was
regenerated followed by re-equilibration at 25% B for 13 min. Peaks
with a retention time between 5.35 and 12 min were integrated
using the respective software of the HPLC systems. Peak areas were
considered for the purity determinations.
The injection-to-injection reproducibility with regards to the
three target proteins (RNase, Cyt C and Lysozyme) was determined
to be in a range of 0.07-0.34% RSD for the Waters Alliance HPLC system used for the MiniChrom and ValiChrom columns and 0.21–1.89
% RSD for the Agilent HPLC system used for the OPUS columns. The
run-to-run reproducibility was quantified as 6.19–12.47 % for the
Waters Alliance HPLC system and 0.38–1.64 % for the Agilent HPLC
system.
Isotherms were prepared in a 96-well format on a MultiScreenHV 0.45 m filter plate (Merck Millipore, Burlington, US). Slurries
(5%) of the SP-650 M medium were prepared in three different
˜ mM NaCl, pH 7.5) which were adjusted
buffers (25 mM Na2 PO4 , 160
with 2 M sodium chloride to different final conductivities (20.61,
20.75 and 20.90 mS/cm). These conductivities represent the whole
range of measured conductivities for the lysozyme breakthrough
buffer. Despite only one formulation being used for obtaining the
breakthrough curves, some inaccuracies during buffer preparation,
especially at larger scale, resulted in slight variations in buffer conductivities. For isotherm determination, 200 l slurry was added
into each well and buffer was removed by applying vacuum.
The medium was then incubated with different concentrations of
lysozyme in the respective buffers. After 23 h of equilibration at
24 ◦ C and 300 rpm shaking on a ThermoMixer (Eppendorf, Hamburg, Germany), the liquid phase was transferred to a 96-well
UV-Star Microplate (Greiner Bio-One, Kremsmünster, Austria) and
the absorbance at 280 nm was measured with an Infinite M200
PRO plate reader (Tecan, Männedorf, Switzerland) to determine the
lysozyme concentration. Each isotherm was measured in triplicate.
3. Theory
The statistical moments of the acetone peaks were determined
by direct numerical integration. The first moment (M1 ) is the mean
retention volume of a peak. The second moment (M2 ) is the variance
of a peak and is a measure of peak width around its center of gravity.
The determined first moment was corrected by the contributions
of the extra column volume. The height equivalent to theoretical
plate (H) was calculated by
H=
M2 ∗ L
M12
(1)
where L is the column length.
The peak asymmetry is commonly calculated at 10% peak height
by
As =
b
a
(2)
where b is the width from peak maximum to the rear part of the
peak and a is the width from the front part of the peak of the peak
maximum. Alternatively, the peak skew can be used for description
of the peak shape, which is calculated by
Skew =
M3
M2 3/2
(3)
where M3 is the third moment. The peak skew is negative for
fronting peaks, zero for symmetrical peaks, and positive for tailing
peaks.
The logistic dose-response function describes a transition from
a base to a saturation level and is therefore excellently suited to
describe chromatography gradients [18]. The volume of the mixer
in relation to the chromatography system and column determines
the shape of the gradient. The deviation from the ideal gradient is
82
S. Schweiger et al. / J. Chromatogr. A 1591 (2019) 79–86
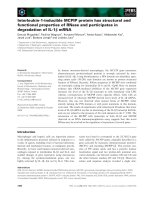
Fig. 1. Peak moments of acetone peaks from multiple columns performed at 4 different superficial velocities. The individual points of triplicate measurements are shown
for each velocity for columns from 1 to 100 mL and a single measurement point for each velocity is shown for columns from 1.57 to 56.5 L. (A) First peak moment corrected
for extra column volumes (B) Ratio of extra column volume to column volume (C) Second peak moment.
more dominant on small scale rather than on large scale. Mixers
in chromatography systems can be described with a continuous
stirred tank reactor (CSTR) model, which is modified to include
logistic growth with the following equation [19]:
CM =
0 ∗ C max ∗ exp( t )
CM
a
M
0 ∗ exp( t ) + C max − C 0
CM
a
M
M
(4)
where t is the retention time or volume – in our case the retention
volume in CV, a is the time constant of the mixer, CM 0 is the modifier concentration at the start of the step increase and CM max is the
modifier concentration at the end of the step increase. The shape
of step gradient increases can be described with the time constant
by fitting them to Eq. (4).
Table 2
HETP and asymmetries determined from acetone pulses at superficial velocities of
150 cm/h.
Type
Volume [L]
HETP [cm]
Asymmetry at
10 % peak
height
Extra particle
porosity ()
MiniChrom
MiniChrom
MiniChrom
ValiChrom
ValiChrom
ValiChrom
ValiChrom
OPUS 10
OPUS 45
OPUS 60
0.001
0.005
0.01
0.01
0.02
0.04
0.1
1.57
33.1
56.5
0.098
0.033
0.048
0.059
0.033
0.024
0.036
0.037
0.050
0.035
1.27
1.15
1.43
0.64
1.00
1.06
1.20
1.09
1.02
1.08
0.49
0.41
0.38
0.43
0.36
0.38
0.39
0.36
0.43
0.37
4. Results and discussion
4.1. Evaluation of the packed bed
The packing quality and consistency of all tested pre-packed
columns with volumes from 1 mL to 57 L was verified by acetone
pulses performed at different velocities. The first moments were
corrected by the extra column volumes before plotting versus scale.
The first moments increase linearly with the column volume indicating a similar packing quality and total porosity for all column
scales (Fig. 1A). The extra column volume is less than 5% of the CV
for all columns except for the 1 mL, where it is 20–25 % (Fig. 1B).
Consequently, the extra column effects will mainly affect the retention volume and peak width of the 1 mL column. The second peak
moment is related to the column volume [11]. This was corrobo-
rated for a larger range of columns (Fig. 1C). The variation in the
data is explained by extra column band broadening effects which
were not considered, since it was experimentally not possible to
determine extra column band broadening in the flow distributors. Acetone peaks of the 1 mL column tailed significantly more
than other column formats. This result is most probably due to the
relatively large extra column volume in the 1 mL format and therefore dominance of extra column effects. Acetone peaks on all other
columns were symmetric with asymmetries below 1.43 (Table 2).
The calculated HETP values varied in a range of 0.027 to 0.098 cm
across all scales. Moreover, the determined extra particle porosities
were in a range of 0.36 to 0.49. Previously, we hypothesized that
columns are scalable for protein separations when the first and
second moments of non-retained peaks with small solutes such
S. Schweiger et al. / J. Chromatogr. A 1591 (2019) 79–86
83
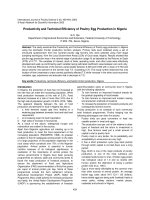
Fig. 2. Lysozyme breakthrough and calculated binding capacities at a residence time of 8 min. (A) Breakthrough profiles on all columns. Data for the smallest column were
corrected with the extra column volume. (B) Equilibrium binding capacities (EBC) and dynamic binding capacities (DBC) for lysozyme. The binding capacities of the impurities
were subtracted from the total binding capacity to get the binding capacity of pure lysozyme.
as acetone correlate with the column size, or when expressed in
respect to column volume they are identical over all scales, except
for the very small columns [11]. To prove this assumption, additional scale-up experiments with proteins in a binding mode were
carried out.
4.2. Binding capacity for lysozyme
Lysozyme breakthrough curves were performed on all columns
except for the 60 cm ID column. We operated all columns at a constant residence time of 8 min, so small columns have been run at
much lower superficial velocity than the larger ones. In order to
minimize the amount of lysozyme protein required for the analysis, we selected a loading buffer with elevated conductivity and
pH to reduce the chromatography media binding capacity. The
normalized breakthrough curves (c/cF ) have been superimposed
(Fig. 2A) and the profiles are very similar for all columns. A small
breakthrough of non-binding impurities can be observed after 1
CV. Due to the high influence of the extra column volume on
the 1 mL column, the breakthrough curve is shifted (dashed violet
line) resulting in an inaccurate, artificially higher binding capacity.
Therefore, the data of this column were corrected for the extra column volume (solid violet line). The slightly different shape of the
breakthrough curve for this column is also attributed to dominating
extra column band broadening effects. However, the slope at 50% of
breakthrough is very similar for all scales with a slope of 1.08 ± 0.13
CV−1 (Table 3). The EBC for lysozyme was the same for all columns
with an average EBC of 26.6 ± 0.9 mg/mL column. The DBC at 10%
breakthrough for lysozyme was 21.3 ± 0.9 mg/mL across the range
of columns tested indicating similar column performance for all
scales.
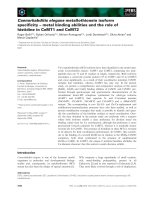
We explain the minimal differences in the EBC and DBC by
slight variations in the salt concentration of the buffer during loading. A slight variation of 0.3 mS/cm resulted in a difference in EBC
of 2 mg/mL (Fig. 3A). The capacity is extremely sensitive to salt
and protein concentration as shown by the isotherms (Fig. 3B).
Isotherms were measured at three different conductivities covering the whole experimental range. The isotherms were linear due
to the less favorable binding condition and confirmed that even
Table 3
Calculated slopes at 50% lysozyme breakthrough for different column scales.
Type
Volume [L]
Slope at 50 % Lysozyme
breakthrough
MiniChrom
MiniChrom
MiniChrom
ValiChrom
ValiChrom
ValiChrom
ValiChrom
OPUS 10
OPUS 45
0.001
0.005
0.01
0.01
0.02
0.04
0.1
1.57
33.1
0.89
1.17
0.97
1.14
1.18
1.29
1.13
0.98
1.00
slight variations in the salt concentration lead to large differences
in binding capacity.
4.3. Separation performance of a protein mixture using a step
gradient
For all columns in the study, a ternary mixture of proteins
(lysozyme, cytochrome C and ribonuclease A) was separated by a
stepwise gradient. After loading the protein mixture, columns were
washed with the loading buffer. The proteins were then eluted in
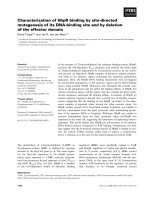
three subsequent steps, each at a different salt concentration followed by regeneration with high salt. Fig. 4A shows an overlay of
the chromatograms of all scales with the retention volume provided in column volumes for normalization. The chromatograms
were aligned with respect to the onset of step gradient at the column outlet indicated by rise of conductivity. They were also aligned
to the largest column which had the shortest duration of the individual steps. The curves of the small columns were cut off in the
figure, despite being longer in duration in the real runs. A large
peak eluted in the wash step which contained unbound impurities. This wash peak eluted at a similar column volume for each
of the different scale columns, only the peak of the 1 mL column
eluted later due to the large influence of the extra column effects.
The developed gradient was capable of separating the three proteins. However, in each elution step, two protein isoforms could
be resolved, because we did not use completely pure model pro-
84
S. Schweiger et al. / J. Chromatogr. A 1591 (2019) 79–86
Fig. 3. Influence of buffer conductivity on binding capacity (A) Equilibrium binding capacity (EBC) depends on the conductivity during the loading step. Data for the 1 mL
column were omitted due to dominating extra column effects. (B) Isotherms at three different conductivities, which were in the range of the experimentally measured
conductivities during breakthrough. 95% confidence intervals of the linear fits are shown by shaded areas in the respective colors.
Fig. 4. Step gradient separation of a mixture of lysozyme, cytochrome c and ribonuclease A with a residence time of 8 min. (A) Chromatogram of all columns, solid lines
show the UV signal and dashed lines the conductivity. Ribonuclease A eluted in the first, cytochrome C in the second and lysozyme in the third step of the gradient. Each step
was held until the baseline UV was reached, which lasted longer for smaller columns. For the overlay, the UV signals were aligned to the start of the rises in the conductivity
signals for the largest column. Therefore, the runs with the smaller columns are cut off, despite they lasted longer in reality. (B–D) Peaks of the three individual elution steps
were fitted to Gaussian functions. When two peaks eluted in one step, two Gaussian functions were fitted (step 1 and step 2). Retention volume and peak width of the larger
peak, resolution (if applicable) and the relative area of larger of the two fitted peaks were calculated from the fits.
S. Schweiger et al. / J. Chromatogr. A 1591 (2019) 79–86
teins. When the individual fractions for each peak were analyzed
by reversed phase HPLC, the co-eluting peak only had a slightly
shifted retention time compared to the main peak (data shown in
supplementary material), indicating degraded or modified protein
forms. The relative area of the two protein isoforms at each elution step stayed the same indicating a constant ratio between the
two isoforms. With increasing column size the normalized retention volumes decreased and normalized peaks became narrower
(Fig. 4B-D), which can be explained by the shape of the gradient.
With larger scale columns, the transition from low to high salt is
steeper than with small scale columns. The same gradient shape
cannot be maintained over all scales due to different influences
of the extra column volume especially the mixer on the gradient
profiles. The resolution between the two peaks eluting in step 1
and step 2 varied for the different scales but no clear trend was
observed. The resolution is likely dependent on the exact salt concentration within the different steps. By comparison of the peak
profiles at the different scales, we found that only slight changes
in the conductivity can lead to different elution patterns confirming that step gradients are very sensitive to variations in buffer
composition.
The conductivity rises of the three elution buffer step increases
were fitted to Eq. (4) to quantify the mixer time constant a for the
different column volumes. The mixer time constant decreases with
increasing column volume and levels off between 0.03 and 0.04
CV−1 for columns larger than 100 mL (Fig. 5). Considering only one
column, the determined time constant is almost the same for the
three step increases. An empirical relationship between the mixer
time constant and the column volume was determined by fitting
of the data points. The empirical values of the function depend on
the chromatography columns and workstations especially for very
small column volumes. This function reveals the importance of also
considering column volume and the shape of the conductivity curve
for scale-up predictions and can be used for predicting the perfor-
85
Fig. 5. Mixer time constants for different column volumes, which were determined
by fitting the conductivity increases of the individual steps to Eq. (4). Each color
represents one step increase.
mance of unknown systems by obtaining the mixer time constant
from their step gradient response.
The purity of the loaded material and of the pools of the three
steps were analyzed by reversed phase-HPLC. Despite some fluctuations in the concentration of the loaded material (Fig. 6A), the
purities of the elution pools from each of the different column volumes were comparable for all three steps (Fig. 6B-D). RNase purity
in the first elution step was 97.9 ± 1.3%, cytochrome C purity was
89.3 ± 2.2% in the second elution step and lysozyme purity was
100 ± 0% in the last elution step. This indicates that the observed
shifts in retention times, peak widths and impurities, do not influence the elution behavior and ultimately the protein purity of each
elution pool. There are still some non-target protein contaminants
within the pools of the first and second step, but the aim of this
Fig. 6. Quantification of the purity of the loads and the three step gradient elution pools from the separation of lysozyme, cytochrome c and ribonuclease A by RP-HPLC for
all pre-packed columns assessed.
86
S. Schweiger et al. / J. Chromatogr. A 1591 (2019) 79–86
study was not to achieve perfection in purity but to show comparability of chromatographic performance across column scales.
The data set confirms chromatographic performance of pre-packed
chromatography columns packed with Toyopearl SP-650 M from
1 mL (0.5 × 5 cm) to at least 57 L (60 × 20 cm) for high loadings
of lysozyme and for separation of a protein mixture consisting of
lysozyme, ribonuclease A and cytochrome C. Both, packed bed consistency and packing quality across this range of column sizes are
comparable.
5. Conclusions
The successful scale-up of industrial protein chromatography
with pre-packed chromatography columns from laboratory scale
for process development up to large scale for cGMP manufacturing
was demonstrated. The uniformity of the column packing across the
range of column sizes was confirmed with acetone pulses, which
are very susceptible to changes in the packing structure. The acetone pulse injections provided conformation that all columns for
each scale were packed to the same quality attributes measured by
HETP and asymmetry. To prove that columns were acceptable for
practical protein separation processes, we performed breakthrough
curves as well as protein separation experiments using a stepwise
gradient approach. Equilibrium and dynamic binding capacities for
a model protein showed only slight variations with scale. These
variations are explained by small changes in the salt concentration
of the loading buffer. A mixture of three proteins was separated by
step gradient method utilizing the same conditions at each column
scale. The purity of the elution pool, from each of the three gradient steps, was equivalent across all column scales despite retention
time and peak width differences. These differences were due to
variance in the sharpness of the conductivity change attributed to
mixing and extra column effects more prominent with small scale
columns. In conclusion, the evaluated pre-packed preparative chromatography columns are packed consistently and reproducibly
across all scales, from 0.5 cm × 5 cm (1 mL) to 60 cm × 20 cm (57 L)
packed bed volume. They can be used to develop and scale protein
separation process from lab to production scale.
Acknowledgements
This work has been supported by the Federal Ministry of Science, Research and Economy (BMWFW), the Federal Ministry of
Traffic, Innovation and Technology (bmvit), the Styrian Business
Promotion Agency SFG, the Standortagentur Tirol, the Government
of Lower Austria and ZIT - Technology Agency of the City of Vienna
through the COMET-Funding Program managed by the Austrian
Research Promotion Agency FFG.
Appendix A. Supplementary data
Supplementary material related to this article can be found, in
the online version, at doi: />01.014.
References
[1] D. Low, R.O. Leary, N.S. Pujar, Future of antibody purification, J. Chromatogr. B
848 (2007) 48–63, />[2] P. Rogge, D. Müller, S.R. Schmidt, The single-use or stainless steel decision
process, Bioprocess. Int. 13 (2015) 10–15.
[3] R. Jacquemart, M. Vandersluis, M. Zhao, K. Sukhija, N. Sidhu, J. Stout, A
single-use strategy to enable manufacturing of affordable biologics, Comput.
Struct. Biotechnol. J. 14 (2016) 309–318, />2016.06.007.
[4] C. Scott, The latest single-use solutions for downstream processing, BioPharm.
Int. 15 (2017) 1–5.
[5] E. Langer, Innovation in Pre-packed Disposable Chromatography Columns,
2014 />[6] F.G. Lode, A. Rosenfeld, Q.S. Yuan, T.W. Root, E.N. Lightfoot, Refining the
scale-up of chromatographic separations, J. Chromatogr. A 796 (1998) 3–14,
/>[7] O. Kaltenbrunner, A. Jungbauer, S. Yamamoto, Prediction of the preparative
chromatography performance with a very small column, J. Chromatogr. A 760
(1997) 41–53, />[8] N. Hutchinson, S. Chhatre, H. Baldascini, T. Place, B. Road, D.G. Bracewell, M.
Hoare, Ultra scale-down approach to correct dispersive and retentive effects
in small-scale columns when predicting larger scale elution profiles,
Biotechnol. Progr. 25 (2009) 1103–1110, />[9] T. Scharl, C. Jungreuthmayer, A. Dürauer, S. Schweiger, T. Schröder, A.
Jungbauer, Trend analysis of performance parameters of pre-packed columns
for protein chromatography over a time span of ten years, J. Chromatogr. A
1465 (2016) 63–70, />[10] S. Schweiger, S. Hinterberger, A. Jungbauer, Column-to-column packing
variation of disposable pre-packed columns for protein chromatography, J.
Chromatogr. A (2017), />[11] S. Schweiger, A. Jungbauer, Scalability of pre-packed preparative
chromatography columns with different diameters and lengths taking into
account extra column effects, J. Chromatogr. A (2018), />1016/j.chroma.2018.01.022.
[12] S. Grier, S. Yakabu, Prepacked chromatography columns: evaluation for use in
pilot and large-scale bioprocessing, Bioprocess Int. 14 (2016).
[13] K. Treier, S. Hansen, C. Richter, P. Diederich, J. Hubbuch, P. Lester,
High-throughput methods for miniaturization and automation of monoclonal
antibody purification processes, Biotechnol. Progr. 28 (2012) 723–732, http://
dx.doi.org/10.1002/btpr.1533.
[14] A. Osberghaus, K. Drechsel, S. Hansen, S.K. Hepbildikler, S. Nath, M. Haindl, E.
Von Lieres, J. Hubbuch, Model-integrated process development demonstrated
on the optimization of a robotic cation exchange step, Chem. Eng. Sci. 76
(2012) 129–139, />[15] S.T. Evans, K.D. Stewart, C. Afdahl, R. Patel, K.J. Newell, Optimization of a
micro-scale, high throughput process development tool and the
demonstration of comparable process performance and product quality with
biopharmaceutical manufacturing processes, J. Chromatogr. A 1506 (2017)
73–81, />[16] A. Susanto, E. Knieps-Grünhagen, E. von Lieres, J. Hubbuch, High throughput
screening for the design and optimization of chromatographic processes :
assessment of model parameter determination from high throughput
compatible data, Chem. Eng. Technol. 31 (2008) 1846–1855, />10.1002/ceat.200800457.
[17] S. Gerontas, M. Asplund, R. Hjorth, D.G. Bracewell, Integration of scale-down
experimentation and general rate modelling to predict manufacturing scale
chromatographic separations, J. Chromatogr. A 1217 (2010) 6917–6926,
/>[18] A. Jungbauer, K. Graumann, The logistic dose-response function: a robust
fitting function for transition phenomena in life sciences, J. Clin. Ligand Assay.
24 (2001) 270–274.
[19] O. Kaltenbrunner, A. Jungbauer, Simple model for blending aqueous salt
buffers Application to preparative chromatography, J. Chromatogr. A 769
(1997) 37–48.