STOCK ASSESSMENT AND FISHERY EVALUATION REPORT FOR THE GROUNDFISH FISHERIES OF THE GULF OF ALASKA AND BERING SEA/ALEUTIAN ISLANDS AREA: ECONOMIC STATUS OF THE GROUNDFISH FISHERIES OFF ALASKA, 2008 potx
Bạn đang xem bản rút gọn của tài liệu. Xem và tải ngay bản đầy đủ của tài liệu tại đây (19.51 MB, 276 trang )
STOCK ASSESSMENT AND FISHERY EVALUATION REPORT
FOR THE GROUNDFISH FISHERIES OF THE GULF OF ALASKA AND BERING
SEA/ALEUTIAN ISLANDS AREA:
ECONOMIC STATUS OF THE GROUNDFISH FISHERIES OFF ALASKA, 2008
by
Terry Hiatt, Michael Dalton, Ron Felthoven, Brian Garber-Yonts, Alan Haynie, Stephen
Kasperski, Dan Lew, Christina Package, Lisa Pfeiffer, Jennifer Sepez, Chang Seung and the staff
of Northern Economics, Inc.
Economic and Social Sciences Research Program
Resource Ecology and Fisheries Management Division
Alaska Fisheries Science Center
National Marine Fisheries Service
National Oceanic and Atmospheric Administration
7600 Sand Point Way N.E.
Seattle, Washington 98115-6349
December 9, 2009
December 2009 Economic Status
NPFMC Economic SAFE
This report will be available at:
For additional information concerning this report contact:
Terry Hiatt
Resource Ecology and Fisheries Management Division
Alaska Fisheries Science Center
7600 Sand Point Way N.E.
Seattle, Washington 98115-6349
(206) 526-6414
ii
December 2009Economic Status
NPFMC Economic SAFE
ABSTRACT
The domestic groundfish fishery off Alaska is the largest fishery by volume in the U.S. This
report contains detailed information about economic aspects of the fishery, including figures and
tables, market profiles for the most commercially valuable species, a summary of the relevant
research being undertaken by the Economic and Social Sciences Research Program (ESSRP) at
the Alaska Fisheries Science Center (AFSC) and a list of recent publications by ESSRP analysts.
More specifically, the figures and tables in the report provide estimates of total groundfish catch,
groundfish discards and discard rates, prohibited species bycatch and bycatch rates, the ex-vessel
value of the groundfish catch, the ex-vessel value of the catch in other Alaska fisheries, the gross
product value (F.O.B. Alaska) of the resulting groundfish seafood products, the number and sizes
of vessels that participated in the groundfish fisheries off Alaska, vessel activity, and
employment on at-sea processors. Generally, the data presented in this report cover the years
2004 through 2008 but limited catch and ex-vessel value data are reported for earlier years in
order to illustrate the rapid development of the domestic groundfish fishery in the 1980s and to
provide a more complete historical perspective on catch
1
.
In addition, this report contains data on some of the external factors which, in part, determine the
economic status of the fisheries. Such factors include foreign exchange rates, the prices and
price indexes of products that compete with products from these fisheries, domestic per capita
consumption of seafood products, and fishery imports.
This report also updates the set of market profiles for pollock, Pacific cod, sablefish, and flatfish
published here in the last two years’ reports. These analyses discuss the current state of the
markets for these species in terms of pricing, volume, supply and demand. We also discuss trade
patterns and market share. Forecasts of the prices and volume of future exports are not included
in this year’s report.
We also provide project descriptions and updates for ongoing groundfish-related research
activities of the ESSRP at the AFSC. Contact information is included for each of the ongoing
projects so that readers may contact us for more detail or an update on the project status. Finally,
we have also included a list of publications that have arisen out of our work since 2002.
1
Pacific halibut (Hippoglossus stenolepis) is not included in data for the groundfish fishery in this report because for
management purposes halibut is not part of the groundfish complex.
iii
December 2009 Economic Status
NPFMC Economic SAFE
CONTENTS
Page
Abstract iii
List of Figures vii
List of Tables vii
Introduction 1
Overview of Federally Managed Fisheries off Alaska, 2007 4
Citations 12
Annual Fishery Statistics:
Figures 13
Tables 19
Market Profiles:
Market Profiles Title Page 107
Market Profiles Table of Contents 109
Market Profiles Preface 113
Alaska Pollock Fillets Market Profile 115
Alaska Pollock Surimi Market Profile 131
Alaska Pollock Roe Market Profile 143
Pacific Cod Market Profile 151
Sablefish Market Profile 169
Yellowfin and Rock Sole Market Profile 177
Arrowtooth Flounder Market Profile 191
iv
December 2009Economic Status
NPFMC Economic SAFE
Research Updates and Publications:
Ongoing AFSC Socioeconomic Project Summaries and Updates 199
AFSC Socioeconomic Research Publications List 231
v
December 2009 Economic Status
NPFMC Economic SAFE
vi
INTENTIONALLY LEFT BLANK
December 2009Economic Status
NPFMC Economic SAFE
List of Figures
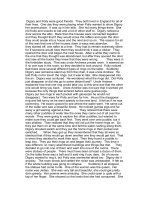
1. Groundfish catch in the commercial fisheries off Alaska by species, 1984-2008.
2. Groundfish catch in the domestic commercial fisheries off Alaska by species, 1984-2008.
3. Real ex-vessel value of the groundfish catch in the domestic commercial fisheries off
Alaska by species, 1984-2008 (base year = 2008).
4. Real ex-vessel value of the domestic fish and shellfish catch off Alaska, 1984-2008 (base
year = 2008).
5. Real gross product value of the groundfish catch off Alaska, 1993-2008 (base year =
2008).
6. Number of vessels in the domestic groundfish fishery off Alaska by gear type, 1994-
2008.
List of Tables
Catch Data
1. Groundfish catch in the commercial fisheries off Alaska by area and species, 1997-2008.
1A. Catch of species other than groundfish in the domestic commercial fisheries off Alaska
by species group, 1994-2008.
2. Groundfish catch off Alaska by area, vessel type, gear and species, 2004-08.
3. Gulf of Alaska groundfish catch by species, gear, and target fishery, 2007-08.
4. Bering Sea and Aleutian Islands groundfish catch by species, gear, and target fishery,
2007-08.
5. Groundfish catch off Alaska by area, residency, and species, 2004-08.
Groundfish Discards and Discard Rates
6. Discards and discard rates for groundfish catch off Alaska by area, gear, and species,
2004-08.
7. Gulf of Alaska groundfish discards by species, gear, and target fishery, 2007-08.
vii
December 2009 Economic Status
NPFMC Economic SAFE
8. Bering Sea and Aleutian Islands groundfish discards by species, gear, and target fishery,
2007-08.
9. Gulf of Alaska groundfish discard rates by species, gear, and target fishery, 2007-08.
10. Bering Sea and Aleutian Islands groundfish discard rates by species, gear, and target
fishery, 2007-08.
Prohibited-Species Bycatch
11. Prohibited species bycatch by species, area and gear, 2005-08.
12. Prohibited species bycatch in the Gulf of Alaska by species, gear, and groundfish target
fishery, 2007-08.
13. Prohibited species bycatch in the Bering Sea and Aleutian Islands by species, gear, and
groundfish target fishery, 2007-08.
14. Prohibited species bycatch rates in the Gulf of Alaska by species, gear, and groundfish
target fishery, 2007-08.
15. Prohibited species bycatch rates in the Bering Sea and Aleutian Islands by species, gear,
and groundfish target fishery, 2007-08.
Ex-Vessel Prices and Value
16. Real ex-vessel value of the catch in the domestic commercial fisheries off Alaska by
species group, 1984-2008 (base year = 2008).
17. Percentage distribution of ex-vessel value of the catch in the domestic commercial
fisheries off Alaska by species group, 1984-2008.
18. Ex-vessel prices in the groundfish fisheries off Alaska by area, gear, and species, 2004-
08.
19. Ex-vessel value of the groundfish catch off Alaska by area, vessel category, gear, and
species, 2004-08.
20. Ex-vessel value of Alaska groundfish delivered to shoreside processors by area, gear and
catcher vessel length, 1998-2008.
21. Ex-vessel value per catcher vessel for Alaska groundfish delivered to shoreside
processors by area, gear, and catcher-vessel length, 1998-2008.
22. Ex-vessel value of the groundfish catch off Alaska by area, residency, and species, 2004-
08.
viii
December 2009Economic Status
NPFMC Economic SAFE
23. Ex-vessel value of groundfish delivered to shoreside processors by processor group,
2002-08.
24. Ex-vessel value of groundfish as a percentage of the ex-vessel value of all species
delivered to shoreside processors by processor group, 2002-08.
First Wholesale Production, Prices and Value
25. Production and gross value of groundfish products in the fisheries off Alaska by species
and product type, 2004-08.
26. Price per pound of groundfish products in the fisheries off Alaska by species and
processing mode, 2004-08.
27. Total product value per round metric ton of retained catch in the groundfish fisheries off
Alaska by processor type, species, area and year, 2004-08.
28. Production of groundfish products in the fisheries off Alaska by species, product and
area, 2004-08.
29. Production of groundfish products in the fisheries off Alaska by species, product and
processing mode, 2004-08.
30. Production and gross value of non-groundfish products in the commercial fisheries of
Alaska by species group and area of processing, 2004-08.
31. Gross product value of Alaska groundfish by area and processing mode, 2001-08.
32. Gross product value of Alaska groundfish by catcher/processor category, vessel length,
and area, 2002-08.
33. Gross product value per vessel of Alaska groundfish by catcher/processor category,
vessel length, and area 2002-08.
34. Gross product value of groundfish processed by shoreside processors by processor group,
2002-08.
35. Groundfish gross product value as a percentage of all-species gross product value by
shoreside processor group, 2002-08.
Counts and Average Revenue of Vessels That Meet a Revenue Threshold
36. Number of groundfish vessels that caught or caught and processed more than $4.0 million
ex-vessel value or product value of groundfish and other species, by area, vessel type and
gear, 2004-08.
ix
December 2009 Economic Status
NPFMC Economic SAFE
37. Number of groundfish vessels that caught or caught and processed less than $4.0 million
ex-vessel value or product value of groundfish and other species by area, vessel type and
gear, 2004-08.
38. Average revenue of groundfish vessels that caught or caught and processed more than
$4.0 million ex-vessel value or product value of groundfish and other species, by area,
vessel type and gear, 2004-08.
39. Average revenue of groundfish vessels that caught or caught and processed less than $4.0
million ex-vessel value or product value of groundfish and other species, by area, vessel
type and gear, 2004-08.
Effort (Fleet Size, Weeks of Fishing, Crew Weeks)
40. Number and total registered net tons of vessels that caught groundfish off Alaska by area
and gear, 2002-08.
41. Number of vessels that caught groundfish off Alaska by area, vessel category, gear and
target, 2004-08.
42. Number of vessels, mean length and mean net tonnage for vessels that caught groundfish
off Alaska by area, vessel-length class, and gear, 2004-08 (excluding catcher/processors).
43. Number of smaller hook-and-line vessels that caught groundfish off Alaska, by area and
vessel-length class, 2004-08 (excluding catcher-processors).
44. Number of vessels, mean length and mean net tonnage for vessels that caught and
processed groundfish off Alaska by area, vessel-length class, and gear, 2004-08.
45. Number of vessels that caught groundfish off Alaska by area, tonnage caught, and gear,
2002-08.
46. Number of vessels that caught groundfish off Alaska by area, residency, target, and gear,
2004-08.
47. Number of vessels that caught groundfish off Alaska by month, area, vessel type, and
gear, 2004-08.
48. Catcher vessel (excluding catcher/processors) weeks of fishing groundfish off Alaska by
area, vessel-length class, gear, and target, 2004-08.
49. Catcher/processor vessel weeks of fishing groundfish off Alaska by area, vessel-length
class, gear, and target, 2004-08.
x
December 2009Economic Status
NPFMC Economic SAFE
50. Total at-sea processor vessel crew weeks in the groundfish fisheries off Alaska by month
and area, 2003-08.
Observer Coverage and Costs
51. Numbers of vessels and plants with observers, observer-deployment days, and estimated
observer costs by year and type of operation, 2007-08.
External Factors
52. Monthly Japanese landing market price of selected groundfish by species, 1994-2008
53. Monthly Tokyo wholesale prices of selected products, 1994-2006.
54. U.S. imports of groundfish fillets, steaks, and blocks, 1976-2008.
55. U.S. population and per capita consumption of fish and shellfish, 1977-2008.
56. U.S. consumption of all fillets and steaks, and fish sticks and portions, 1980-2008.
57. Annual U.S. economic indicators: Selected producer and consumer price indexes and
gross domestic product implicit price deflator, 1977-2008.
58. Monthly U.S. economic indicators: Selected producer and consumer price indexes, 2006-
08.
59. Annual foreign exchange rates for selected countries, 1976-2008.
60. Monthly foreign exchange rates for selected countries, 2006-08.
xi
December 2009 Economic Status
NPFMC Economic SAFE
xii
INTENTIONALLY LEFT BLANK
December 2009Economic Status
NPFMC Economic SAFE
INTRODUCTION
The domestic groundfish fishery off Alaska is an important segment of the U.S. fishing
industry. With a total catch of 1.74 million metric tons (t), a retained catch of 1.65 million
t, and an ex-vessel value of $880 million in 2008, it accounted for 46% of the weight and
20% of the ex-vessel value of total U.S. domestic landings as reported in Fisheries of the
United States, 2008. The value of the 2008 groundfish catch after primary processing was
$2.3 billion (F.O.B. Alaska).
All but a small part of the commercial groundfish catch off Alaska occurs in the
groundfish fisheries managed by the National Marine Fisheries Service (NMFS) under
the Fishery Management Plans (FMP) for the Gulf of Alaska (GOA) and the Bering
Sea/Aleutian Islands area (BSAI) groundfish fisheries. In 2008, other fisheries accounted
for only about 20,400 t of the catch reported above. The footnotes for each table indicate
if the estimates provided in that table are only for the fisheries with catch that is counted
against a federal Total Allowable Catch (TAC) quota (i.e., managed under a federal
FMP) or if they also include other Alaska groundfish fisheries. The reader should keep in
mind that the distinction between catch managed under a federal FMP and catch managed
by the state of Alaska is not merely a geographical distinction between catch occurring
outside the 3-mile limit (in the U.S. Exclusive Economic Zone, or EEZ) and catch
occurring inside the 3-mile limit (Alaska state waters); federal FMPs often manage catch
from inside state waters in addition to catch from the EEZ, and the state of Alaska
maintains authority over some rockfish fisheries in the EEZ of the GOA. The reader
should also be aware that it is not always possible, depending on the data source(s) from
which a particular estimate is derived, to definitively identify a unit of catch (or the
prices, revenue, or other measures associated with a unit of catch) as being part of a
federal FMP or otherwise. For Catch-Accounting System data from the NMFS Alaska
Regional Office (AKR), for example, distinguishing between the two categories is
relatively easy, but the distinction is at best approximate for Alaska Department of Fish
& Game (ADF&G) fish ticket and Commercial Operator’s Annual Report (COAR) data.
Finally, even for catch that can be positively identified as being part of a federal TAC,
it’s not possible to identify what portion of that catch might have come from inside
Alaska state waters and what portion came from the federal EEZ. Because of these
multiple layers of ambiguity, therefore, the reader should not construe phrases such as
“groundfish fisheries off Alaska” or “Alaska groundfish”, as used in this report, to
precisely include or exclude any category of state or federally managed fishery or to refer
to any specific geographic area; these and similar phrases could be taken to mean
groundfish from both Alaska state waters and the federal EEZ off Alaska, or groundfish
managed only under NMFS FMPs or managed by both NMFS and the state of Alaska.
Again, refer to the notes for each table for a description of what is meant to be included
in the estimates provided in that table.
The fishery management and development policies for the BSAI and GOA groundfish
fisheries have resulted in high levels of catch, ex-vessel value (i.e., revenue), processed
product value (i.e., revenue), exports, employment, and other measures of economic
- 1 -
December 2009 Economic Status
NPFMC Economic SAFE
activity. However, the cost data required to estimate the success of these policies with
respect to net benefits to either the participants in these fisheries or the Nation are not
available for a majority of the fisheries. The use of the race for fish as a principal
mechanism for allocating many of the groundfish quotas and prohibited species catch
(PSC) limits among competing fishing operations has adversely affected at least some
aspects of the economic performance of the fisheries. The individual fishing quota (IFQ)
program for the fixed gear sablefish fishery, the Western Alaska Community
Development Quota (CDQ) program for BSAI groundfish, and the American Fisheries
Act (AFA) cooperatives for the BSAI pollock fishery have demonstrated that eliminating
the race for fish as the allocation mechanism and replacing it with an historic catch-
share-based allocation mechanism can decrease harvesting and processing costs, increase
the value of the groundfish catch, and, in some cases, decrease the cost of providing more
protection for target species, non-target species, marine mammals, and seabirds. It is
anticipated that the recent rationalization programs instituted in the BSAI crab fisheries
and the factory trawler head and gut fleet will generate many of the same benefits.
This report presents the economic status of groundfish fisheries off Alaska in terms of
economic activity and outputs using estimates of catch, bycatch, ex-vessel prices and
value (i.e., revenue), the size and level of activity of the groundfish fleet, and the weight
and gross value of (i.e., F.O.B. Alaska revenue from) processed products. The catch,
ex-vessel value, and fleet size and activity data are for the fishing industry activities that
are reflected in Weekly Production Reports, Observer Reports, fish tickets, and the
Commercial Operators’ Annual Reports. All catch data reported for 1991-2002 are based
on the blend estimates of total catch, which were used by NMFS to monitor groundfish
and PSC quotas in those years. Catch data for 2003-08 come from NMFS’s catch-
accounting system, which replaces the blend as the primary tool for monitoring
groundfish and PSC quotas.
A variety of external factors influence the economic status of the fisheries. Therefore,
information concerning the following external factors is included in this report: foreign
exchange rates, the prices and price indexes of products that compete with products from
these fisheries, gross domestic product implicit price deflators, and fishery imports. This
report updates last year's report (Hiatt et al. 2008) and is intended to serve as a reference
document for those involved in making decisions with respect to conservation,
management, and use of GOA and BSAI fishery resources.
Another component of this report is a set of market profiles for pollock, Pacific cod,
sablefish, and flatfish (yellowfin and rock sole, and arrowtooth flounder). The goal of
these profiles is to discuss and, where possible, explain the market trends observed in
pricing, volume, supply, and demand for each of these groundfish species.
Specifically, the market reports provide information on the trends in the prices and
product choices for first-wholesale production of a given species, and the volumes and
prices of exports, as well as changes in the volume of exports to different trading
partners. For example, some groundfish caught off Alaska have a large share of the world
market and observed changes may be tied to changes in the Alaskan supply (TAC), while
- 2 -
December 2009Economic Status
NPFMC Economic SAFE
in other cases the Alaskan share for that product may be relatively low and changes in the
market could be driven by other countries’ actions. Changes in consumer demand or the
emergence of substitute products can also drive the market for a product or species. Thus,
these reports discuss the way in which the particular species or product fits into the world
market and how this fit is changing over time (e.g., the market share for the Alaska
product may be growing or declining).
One fact that becomes evident when reading these profiles is that the type of information
available for explaining the historical trends in a market varies greatly by species.
Generally speaking, the amount of information available for each species is related to its
value or market share, and as a result, some species have been more adequately assessed
in this report. Furthermore, the industry input on market trends was obtained in 2008
(and earlier) and will need to be updated for next year’s SAFE report.
We would like to point out that the data descriptions, qualifications, and limitations noted
in the overview of the fisheries, market reports and the footnotes to the tables are
absolutely critical to understanding the information contained in this report. The
estimates in this report are intended both to provide information that can be used to
describe the Alaska groundfish fisheries and to provide the industry and others an
opportunity to comment on the validity of these estimates. It is hoped that the industry
and others will identify any data or estimates in this report that can be improved and
provide the information and methods necessary to improve them for both past and future
years. There are two reasons why it is important that such improvements be made. First,
with better estimates, the report will be more successful in monitoring the economic
performance of the fisheries and in identifying changes in economic performance that
should be addressed through regulatory actions. Second, the estimates in this report often
will be used as the basis for estimating the effects of proposed fishery management
actions. Therefore, improved estimates in this report will allow more informed decisions
by those involved in managing and conducting the Alaska groundfish fisheries. The
industry and other stakeholders in these fisheries can further improve the usefulness of
this report by suggesting other measures of economic performance that should be
included in the report, or other ways of summarizing the data that are the basis for this
report, and participating in voluntary survey efforts NMFS may undertake in the future to
improve existing data shortages.
There is considerable uncertainty concerning the future conditions of stocks, the resulting
quotas, and future changes to the fishery management regimes for the BSAI and GOA
groundfish fisheries. The management tools used to allocate the catch between various
user groups can significantly affect the economic health of either the domestic fishery as
a whole or segments of the fishery. Changes in fishery management measures are
expected as the result of continued concerns with: 1) the bycatch of prohibited species;
2) the discard and utilization of groundfish catch; 3) the effects of the groundfish fisheries
on marine mammals and sea birds; 4) other effects of the groundfish fisheries on the
ecosystem and habitat; 5) excess harvesting and processing capacity; and 6) the
allocations of groundfish quotas among user groups.
- 3 -
December 2009 Economic Status
NPFMC Economic SAFE
OVERVIEW OF FEDERALLY MANAGED FISHERIES OFF ALASKA, 2008
The commercial groundfish catch off Alaska totaled 1.74 million t in 2008, down almost
15% from the 2007 catch (Fig. 1 and Table 1), but more than four times the catch off
Alaska of all other commercial species combined (Table 1A). The real ex-vessel value of
the catch, including the imputed value of fish caught almost exclusively by
catcher/processors, increased from $821 million in 2007 to $880 million in 2008 (Fig. 3
and Table 16). The gross value of the 2008 catch after primary processing was
approximately $2.3 billion (F.O.B. Alaska) (Table 25), an increase of 12% from 2007.
The groundfish fisheries accounted for the largest share (51%) of the ex-vessel value of
all commercial fisheries off Alaska in 2008 (Fig. 4, Tables 16 and 17), while the Pacific
salmon (Oncorhynchus spp.) fishery was second with $368 million or 21% of the total
Alaska ex-vessel value. The value of the shellfish fishery amounted to $252 million or
15% of the total for Alaska and exceeded the value of Pacific halibut (Hippoglossus
stenolepis) by about $43 million.
Catch Data
During the last 11 years, estimated total catch in the commercial groundfish fisheries off
Alaska varied between 1.7 and 2.2 million t (Fig. 1 and Table 1). The rapid displacement
of the foreign and joint-venture fisheries by the domestic fishery between 1984 and 1991
can be seen by comparing Figures 1 and 2. By 1991, the domestic fishery accounted for
all of the commercial groundfish catch off Alaska. The peak catch occurred in 1991, in
part because blend estimates of catch and bycatch were not yet used to monitor most
quotas within the season. If the estimates had been used, several fisheries would have
been closed earlier in the year. Fortunately, this information was utilized in following
years and allowed for more precision in realizing desired catch levels. Since this time,
catch levels have varied annually, reflecting changes in the total allowable catch (TAC),
area closures or restrictions, and bycatch restrictions.
As a note of caution, readers should be aware that the catch estimates have increasing
levels of downward bias for the years 1984 through 1990. Prior to 1991, discards were
not included in the reported estimates of domestic catch (only the foreign and joint
venture totals were included)
2
. However, the catch (and thus discards) of the domestic
fishery increased rapidly over this period and accounted for over one-third of total catch
in 1988. In addition, when compared side-by-side, the industry catch reports (on which
catch records were based for the domestic fishery prior to 1991) tend to be smaller than
the blend data estimates for equivalent years, implying that the domestic component of
catch was further biased downward relative to post-1991 periods.
Walleye (Alaska) pollock (Theragra chalcogramma) has been the dominant species in
the commercial groundfish catch off Alaska. The 2008 pollock catch of 1.04 million t
2
Based on estimates of the discard rates for 1992 through 1995, discards would have been about 16% of
total catch.
- 4 -
December 2009Economic Status
NPFMC Economic SAFE
accounted for 60% of the total groundfish catch of 1.7 million t (Table 1). The pollock
catch decreased by about 26% from 2007 as a result of reductions in the TAC. The 2008
catch of flatfish, which includes yellowfin sole (Pleuronectes asper), rock sole
(Pleuronectes bilineatus), and arrowtooth flounder (Atheresthes stomias), was 315,900 t
or 18.1% of the total 2008 groundfish catch, an increase of about 23% from 2007. The
Pacific cod (Gadus macrocephalus) catch in 2008 accounted for 229,400 t or 13.2% of
the total 2008 groundfish catch, down less than 2% from a year earlier. Pollock, Pacific
cod, and flatfish comprised just over 91% of the total 2008 catch. Other important
species are sablefish (Anoplopoma fimbria), rockfish (Sebastes and Sebastolobus spp.),
and Atka mackerel (Pleurogrammus monopterygius). The contributions of the major
groundfish species or species groups to the total catch in the domestic groundfish
fisheries off Alaska are depicted in Figure 2.
Trawl, hook and line (including longline and jigs), and pot gear account for virtually all
the catch in the BSAI and GOA groundfish fisheries. There are catcher vessels and
catcher/processor vessels within each of these three gear groups. Table 2 presents catch
data by area, gear, vessel type, and species. The catch data in Table 2 and the catch,
ex-vessel value, and vessel information in the tables of the rest of this report are for the
BSAI and GOA FMP fisheries, unless otherwise indicated.
In the last five years, the trawl catch averaged about 91% of the total catch, while the
catch with hook and line gear accounted for 7.5%. Most species are harvested
predominately by one type of gear, which typically accounts for 90% or more of the
catch. The one exception is Pacific cod, where in 2008, 35.1% (73,000 t) was taken by
trawls, 50.4% (105,000 t) by hook-and-line gear, and 14.4% (30,000 t) by pots. In each
of the years since 2004, catcher vessels took 43-47% of the total catch and
catcher/processors took the remainder. That increase from years prior to 1999 (not
shown in Table 2) is explained in part by the AFA, which among other things increased
the share of the BSAI pollock TAC allocated to catcher vessels delivering to shoreside
processors. The distribution of catch between catcher vessels and catcher/processor
vessels differed substantially by species and area.
Target fisheries are defined by area, gear and target species. The target designations are
used to estimate prohibited species catch (PSC), apportion PSC allowances by fishery,
and monitor those allowances. The target fishery designations can also be used to
provide estimates of catch and bycatch data by fishery. The blend catch data are assigned
to a target fishery by processor, week, area, and gear. The new catch-accounting system,
which replaced the blend as the primary source of catch data in 2003, assigns the target at
the trip level rather than weekly, except for the small fraction of total catch
(approximately 4% in 2003-06 and 2% in 2007) that comes from NMFS Weekly
Production Reports (WPR) (none of the 2008 catch estimates come from WPR). CDQ
fishing activity is targeted separately from non-CDQ fishing. Generally, the species or
species group that accounts for the largest proportion of the retained catch of the TAC
species is considered the target species. One exception to the dominant retained-catch
rule is that the target for the pelagic pollock fishery is assigned if 95 percent or more of
the total catch is pollock. Tables 3 and 4 provide estimates of total catch by species, area,
- 5 -
December 2009 Economic Status
NPFMC Economic SAFE
gear, and target fishery for the GOA and the BSAI, respectively.
Residents of Alaska and of other states, particularly Washington and Oregon, are active
participants in the BSAI and GOA groundfish fisheries. Catch data by residency of
vessel owners are presented in Table 5. These data were extracted from the NMFS blend
and catch accounting system catch databases and from the State of Alaska groundfish fish
ticket database and vessel-registration file which includes the stated residency of each
vessel owner. For the domestic groundfish fishery as a whole, 95% of the 2008 catch
volume was made by vessels with owners who indicated that they were not residents of
Alaska. The catches of the two vessel-residence groups were much closer to being equal
in the Gulf where Alaskan vessels accounted for the majority of the Pacific cod catch.
Groundfish Discards and Discard Rates
The discards of groundfish in the groundfish fishery have received increased attention in
recent years by NMFS, the Council, Congress, and the public at large. Table 6 presents
the catch-accounting system estimates of discarded groundfish catch and discard rates by
gear, area, and species for years 2004-08. The discard rate is the percent of total catch
that is discarded.
Although these are the best available estimates of discards and are used for several
management purposes, these estimates are not necessarily accurate. The groundfish
TACs are established and monitored in terms of total catch, not retained catch; this means
that both retained catch and discarded catch are counted against the TACs. Therefore, the
catch-composition sampling methods used by at-sea observers provide the basis for
NMFS to make good estimates of total catch by species, not the disposition of that catch.
Observers on vessels sample randomly chosen catches for species composition. For each
sampled haul, they also make a rough visual approximation of the weight of the
non-prohibited species in their samples that are being retained by the vessel. This is
expressed as the percent of that species that is retained. Approximating this percentage is
difficult because discards occur in a variety of places on fishing vessels. Discards
include fish falling off of processing conveyor belts, dumping of large portions of nets
before bringing them on-board the vessel, dumping fish from the decks, size sorting by
crewmen, quality-control discard, etc. Because observers can only be in one place at a
time, they can provide only this rough approximation based on their visual observations
rather than data from direct sampling. The discard estimate derived by expanding these
approximations from sampled hauls to the remainder of the catch may be inaccurate
because the approximation may be inaccurate. The numbers derived from the observer
discard approximation can provide users with some information as to the disposition of
the catch, but the discard numbers should not be treated as sound estimates. At best, they
should be considered a rough gauge of the quantity of discard occurring.
For the BSAI and GOA fisheries as a whole, the annual discard rate for groundfish
decreased from about 8% in 2004 to 5% in both 2005 and 2006, increased in 2007 to
about 6%, and then decreased again to about 5% in 2008. The overall discard rate in
- 6 -
December 2009Economic Status
NPFMC Economic SAFE
2004 represents a 47% reduction from the 1997 rate of 15% (not shown in Table 6), a
result of prohibiting pollock and Pacific cod discards in all BSAI and GOA groundfish
fisheries beginning in 1998. Total discards decreased by about 44% from 1997 to 2004
due to the reduction in the discard rate, while the total catch increased by about 6%. The
prohibition on pollock and Pacific cod discards was so effective in decreasing the overall
discard rate because the discards of these two species had accounted for 43% of the
overall discards in 1997. The benefits and costs of the reduction in discards since 1997
have not been determined. In 2008, the overall discard rates were about 12% and 5%,
respectively, for the GOA and the BSAI compared to 16% and 14% in 1997.
Although the fixed gear fisheries accounted for a small part of both total catch or total
discards in 1998 and later years, the overall discard rates were substantially higher for
fixed gear (12% in 2008) than for trawl gear (5% in 2008). Prior to 1998, the overall
discard rates had been similar for these two gear groups. This change occurred because
the prohibition on pollock and Pacific cod discards had a much larger effect on trawl
discards than on fixed gear discards. In the BSAI, the 2008 discard rates were 13% and
4% for fixed and trawl gear, respectively. In the GOA, however, the corresponding
discard rates were 8% and 15%. One explanation for the relatively low discard rates for
the BSAI trawl fishery is the dominance of the pollock fishery with very low discard
rates. The mortality rates of groundfish that are discarded are thought to differ by gear or
species; however, estimates of groundfish discard mortality are not available.
Tables 7 and 8, and 9 and 10, respectively, provide estimates of discarded catch and
discard rates by species, area, gear, and target fishery. Within each area or gear type,
there are substantial differences in discard rates among target fisheries. Similarly, within
a target fishery, there are often substantial differences in discard rates by species.
Typically, in each target fishery the discard rates are very high except for the target
species. The regulatory exceptions to the prohibition on pollock and Pacific cod discards
explain, in part, why there are still high discard rates for these two species in some
fisheries.
Prohibited-Species Bycatch
The bycatch of Pacific halibut, king and tanner crab (Chionoecetes, Lithodes and
Paralithodes spp.), Pacific salmon (Oncorhynchus spp.), and Pacific herring (Clupea
pallasi) has been an important management issue for more than twenty years. The
retention of these species was prohibited first in the foreign groundfish fisheries. This
was done to ensure that groundfish fishermen had no incentive to target these species.
Estimates of the bycatch of these “prohibited species” for 2005-08 are summarized by
area and gear in Table 11. More detailed estimates of prohibited species bycatch and of
bycatch rates for 2007 and 2008 are in Tables 12 - 15. The estimates for halibut are in
terms of bycatch mortality because the bycatch limits for halibut are set and monitored
using estimated discard mortality rates. The estimates for the other prohibited species are
of total bycatch; this is in part due to the lack of well-established discard mortality rates
for these species. The discard mortality rates probably approach 100% for salmon and
- 7 -
December 2009 Economic Status
NPFMC Economic SAFE
herring in the groundfish fishery as a whole; the discard mortality rates for crab, however,
may be substantially lower.
Notice that Tables 11 – 15 show a very large increase in bycatch of other king crab in
2007, mostly in the BSAI Pacific cod and sablefish pot fisheries. The “other king crab”
category includes blue king crab (Paralithodes platypus) and golden king crab (Lithodes
aequispina). The total other-king-crab bycatch in 2007 was about 10 times the average
annual bycatch for the years 1994-2006; other-king-crab bycatch declined in 2008, but
still remained at roughly 4.5 times the long-term average. The increase in blue king crab
bycatch in 2007 is partly explained by the expansion of effort in the Pacific cod pot
fishery northward to reporting area 524 in the vicinity of St. Matthew Island, where a
floating processor was stationed to accept deliveries of Pacific cod (the processor was not
present in either 2006 or 2008). The rest of the explanation for the 2007 increase is most
likely the lack of observer coverage in the sablefish and Pacific cod pot fisheries (pot
vessels over 60 feet in length are required to have observer coverage for only 30% of
their fishing days), so that a few observed hauls with large crab bycatch resulted in high
calculated bycatch rates that were then applied to the rest of the fisheries. The decline of
other-king-crab bycatch in 2008 is explained in part by the reduction of effort in area 524
(no Pacific cod pot harvest occurred in area 524 in 2008, compared with over 2,000 t in
2007), but also possibly due to a change in fishing patterns after managers informed the
industry that high bycatch was occurring in certain areas. In 2008 there were no observed
pot vessels in areas where bycatch had been high the previous year.
The at-sea observer program was developed for the foreign fleets and then extended to
the domestic fishery once it had all but replaced participation by foreign fishing and
processing vessels. The observer program, now managed by the Fisheries Monitoring
and Analysis Division (FMA) of the Alaska Fisheries Science Center, resulted in
fundamental changes in the nature of the bycatch problem. First, by providing good
estimates of total groundfish catch and non-groundfish bycatch by species, it eliminated
much of the concern that total fishing mortality was being underestimated due to fish that
were discarded at sea. Second, it made it possible to establish, monitor, and enforce the
groundfish quotas in terms of total catch as opposed to only retained catch. Third, it
made it possible to implement and enforce bycatch quotas for the non-groundfish species
that by regulation had to be discarded at sea. Finally, it provided extensive information
that managers and the industry could use to assess methods to reduce bycatch and
bycatch mortality. In summary, the observer program provided fishery managers with
the information and tools necessary to prevent bycatch from adversely affecting the
stocks of the bycatch species. Therefore, the bycatch in the groundfish fishery is
principally not a conservation problem but it can be an allocation problem. Although this
does not make it less controversial, it does help identify the types of information and
management measures that are required to reduce bycatch to the extent practicable, as is
required by the Magnuson-Stevens Fishery Conservation and Management Act (MSA).
- 8 -
December 2009Economic Status
NPFMC Economic SAFE
Ex-Vessel Prices and Value
Table 18 contains the estimated ex-vessel prices that were used with estimates of retained
catch to calculate ex-vessel values. The estimates of ex-vessel value by area, gear, type
of vessel, and species are in Table 19. The ex-vessel value of the domestic landings in
the FMP fisheries, excluding the value added by at-sea processing, increased from $628
million in 2004 to $745 million in 2005, increased to $818 million in 2006 and then
decreased to $799 million in 2007 before increasing again to $874 million in 2008. The
distribution of ex-vessel value by type of vessel differed by area, gear and species. In
2008, catcher vessels accounted for 50% of the ex-vessel value of the groundfish landings
compared to 43% of the total catch because catcher vessels take larger percentages of
higher-priced species such as sablefish, which was $3.16 per pound in 2008. Similarly,
trawl gear accounted for only 68% of the total ex-vessel value compared to 89% of the
catch because much of the trawl catch is of low-priced species such as pollock, which
was about $0.21 per pound in 2008.
Tables 20 and 21 summarize the ex-vessel value of catch delivered to shoreside
processors by vessel-size class, gear, and area. Table 20 gives the total ex-vessel value in
each category and Table 21 gives the ex-vessel value per vessel. The relative dominance
of each of the three vessel size classes differs by area and by gear.
Table 22 provides estimates of ex-vessel value by residency of vessel owners, area, and
species. For the BSAI and GOA combined, 87% of the 2008 ex-vessel value was
accounted for by vessels with owners who indicated that they were not residents of
Alaska. Vessels with owners who indicated that they were residents of Alaska accounted
for 13% of the total. The vessels owned by residents of Alaska accounted for a much
larger share of the ex-vessel value than of catch (13% compared to 5%) because these
vessels accounted for relatively large shares of the higher-priced species such as
sablefish.
Table 23 presents estimates of ex-vessel value of catch delivered to shoreside processors,
and Table 24 gives the ex-vessel value of groundfish as a percentage of the ex-vessel
value of all species delivered to shoreside processors. The data in both tables, which
include both state and federally managed groundfish, are reported by processor group,
which is a classification of shoreside processors based primarily on their geographical
locations. The processor groups are described in the footnote to the tables.
First Wholesale Production, Prices and Value
Estimates of weight and value of the processed products made with BSAI and GOA
groundfish catch are presented by species, product form, area, and type of processor in
Tables 25, 28 and 29. Product price-per-pound estimates are presented in Table 26, and
estimates of total product value per round metric ton of retained catch (first wholesale
prices) are reported in Table 27.
- 9 -
December 2009 Economic Status
NPFMC Economic SAFE
Gross product value (F.O.B. Alaska) data, through primary processing, are summarized
by category of processor and by area in Table 31, and by catcher/processor category, size
class and area in Table 32. Table 33 reports gross product value per vessel, categorized
in the same way as Table 32. Tables 34 and 35 present gross product value of groundfish
processed by shoreside processors and the groundfish gross product value as a percentage
of all-species gross product value, with both tables broken down by processor group. The
processor groups are the same as in Tables 23 and 24 and no distinction is made between
groundfish catch from the state and federally managed groundfish fisheries.
Beginning in 2002, all processors (including previously-exempted groundfish
catcher/processors that operate exclusively in the EEZ and process only their own catch)
have been required to submit COAR data to the ADF&G. Even though complete at-sea
production data are now available from the COAR, the estimates of groundfish gross
product value (i.e., revenue) for at-sea processors in 2002 through 2008 are calculated the
same as in previous years in order to provide a comparison of the estimates from year to
year. These estimates are based on COAR product price data (submitted by shoreside
processors in all years and, voluntarily, by at-sea processors for activity through 2001)
and on product quantity data in the WPR. Beginning with the 2001 Economic SAFE
report (Hiatt et al. 2001), the estimates of gross product value for shoreside processors are
based on COAR product price and quantity data. Prior to that, the estimates for all
processors were based on COAR price data and WPR product quantity data.
Table 30 reports estimates of the weight and first-wholesale value of processed products
from catch in the non-groundfish commercial fisheries of Alaska, which enables
comparison with the groundfish first-wholesale value estimates reported in Table 25. In
all years reported here, the total first-wholesale value of just the pollock and Pacific cod
groundfish fisheries easily exceeds that of all non-groundfish fisheries combined. We
present Table 30 to provide a further means, besides the ex-vessel value estimates
reported in Table 16, of comparing the groundfish and non-groundfish fisheries.
Counts and Average Revenue of Vessels That Meet a Revenue Threshold
For the purposes of Regulatory Flexibility Act analyses, a business involved in fish
harvesting is defined by the Small Business Administration as a small business if it is
independently owned and operated, not dominant in its field of operation (including its
affiliates), and has combined annual receipts no greater than $4.0 million for all its
affiliated operations worldwide. The information necessary to determine if a vessel is
independently owned and operated and had gross earnings no greater than $4.0 million is
not available. For example, vessel earnings can include tendering income, which is not
tracked, and revenue from fishing activities outside of Alaska, which is data we lack
access to. By using estimates of vessels’ revenue from the catch or processing of Alaska
groundfish and other species, however, it is possible to identify vessels that clearly are
not small entities.
Estimates of both the numbers of fishing vessels that clearly are not small entities and the
- 10 -
December 2009Economic Status
NPFMC Economic SAFE
numbers of fishing vessels that could be small entities are presented in Tables 36 and 37,
respectively. With more complete revenue, ownership and affiliation information, some
of the vessels included in Table 37 would be determined to be large entities. Estimates of
the average revenue per vessel for the vessels in Tables 36 and 37, respectively, are
presented in Tables 38 and 39. As data become available, we hope in the future to
improve revenue estimates by including revenue from participation in fisheries in the
lower 48 states and by incorporating information about the vessels’ cooperative
affiliations. In addition, a proposed change may raise the small-business revenue
threshold (for catcher/processors only) from $4.0 million to $20.0 million.
Effort (Fleet Size, Weeks of Fishing, Crew Weeks)
Estimates of the numbers and net registered tonnage of vessels in the groundfish fisheries
are presented by area and gear in Table 40, and estimates of the numbers of vessels that
landed groundfish are depicted in Fig. 6 by gear type. More detailed information on the
BSAI and GOA groundfish vessels by type of vessel, vessel size class, catch amount
classes, and residency of vessel owners is in Tables 41 - 46. In particular, Table 43 gives
detailed estimates of the numbers of smaller (less than 60 feet) hook-and-line catcher
vessels. Notice that Table 40, Table 45, and Figure 6 show an increase in the number of
hook-and-line vessels (and, consequently, all vessels) in 2003 compared to the numbers
reported in 2002. This increase is the result of improved source data, namely the
availability in NMFS catch-accounting system data of the federal permit numbers of
catcher vessels making deliveries in all processing sectors. This allows us to include
vessels that were uncounted in earlier years. Notice also that the number of vessels
participating in GOA hook-and-line fisheries decreased compared to the numbers
reported last year; this decrease is the result of the availability of data maintained by the
NMFS Alaska Region that allows us to positively identify catch from Alaska state-water
fisheries, thus enabling us to exclude vessels that fished only in such fisheries.
Estimates of the number of vessels by month, gear, and area are in Table 47. Table 48
provides estimates of the number of catcher vessel weeks by size class, area, gear, and
target fishery. Table 49 contains similar information for catcher/processor vessels.
The Weekly Production Reports include employment data for at-sea processors but not
inshore processors. Those data are summarized in Table 50 by month and area. The data
indicate that in 2008, the crew weeks (defined as the number of crew aboard each vessel
in a week summed over the entire year) totaled 97,036 with the majority of them (92,725)
occurring in the BSAI groundfish fishery. In 2008, the maximum monthly employment
(15,152) occurred in February. Much of this was accounted for by the BSAI pollock
fishery.
Observer Coverage and Costs
The information provided by the FMA of the AFSC has had a key role in the success of
- 11 -
December 2009 Economic Status
NPFMC Economic SAFE
- 12 -
the groundfish management regime. For example, it would not be possible to monitor
total allowable catches (TACs) in terms of total catch without observer data from the
FMA. Similarly, the PSC limits, which have been a key factor in controlling the bycatch
of prohibited species, could not be used without such data. In recent years, the reliance
on observer data for individual vessel accounting is of particular importance in the
management of the CDQ program, AFA pollock, BSAI crab, and Amendment 80
fisheries. In addition, much of the information that is used to assess the status of
groundfish stocks, to monitor the interactions between the groundfish fishery and marine
mammals and sea birds, and to analyze fishery management actions is provided by the
FMA. Estimates of the numbers of vessels and plants with observers,
observer-deployment days, and estimated observer costs by year and type of operation for
2007-08 are presented in Table 51.
External Factors
There are a variety of at least partially external factors that affect the economic
performance of the BSAI and GOA groundfish fisheries. They include landing market
prices in Japan, wholesale prices in Japan, U.S. imports of groundfish products, U.S. per
capita consumption of seafood, U.S. consumer and producer price indexes, and foreign
exchange rates. Such data are included in Tables 52 - 60. Notice that the Japanese
Ministry of Agriculture, Forestry & Fisheries has discontinued reporting of landing
market prices for all but one of the species in Table 52 and no longer reports wholesale
prices for any of the species in Table 53. U.S. cold-storage holdings data, which were
published in this report in previous years, have not been collected by NMFS since the end
of 2002. The availability of cold-storage holdings data depends on the cooperation of
industry in the form of voluntary reporting, which has declined to the extent that reports
compiled from the data were deemed by NMFS management to lack sufficient accuracy.
Consequently, the affected tables have been omitted from this report, but the pre-2003
levels may be found in Tables 48 and 49 of earlier reports.
Exchange rates and world supplies of fishery products play a major role in international
trade. Exchange rates change rapidly and can significantly affect the economic status of
the groundfish fisheries.
CITATIONS
Terry Hiatt, Ron Felthoven, Michael Dalton, Brian Garber-Yonts, Alan Haynie, Dan
Lew, Jennifer Sepez, Chang Seung and the staff of Northern Economics, Inc. Stock
Assessment and Fishery Evaluation Report for the Groundfish Fisheries of the Gulf of
Alaska and Bering Sea/Aleutian Island Area: Economic Status of the Groundfish
Fisheries off Alaska, NPFMC, November, 2008.
National Marine Fisheries Service, 2008. Fisheries of the United States, 2008.
/>
December 2009Economic Status
NPFMC Economic SAFE
0.0
0.5
1.0
1.5
2.0
2.5
1984 1986 1988 1990 1992 1994 1996 1998 2000 2002 2004 2006 2008
Millions of metric tons
Pollock Pacific cod Sablefish Flatfish Other
Figure 1. Groundfish catch in the commercial fisheries off Alaska by
species, 1984-2008.
Note: These estimates include catch from both federal and state of
Alaska fisheries.
- 13 -
December 2009 Economic Status
NPFMC Economic SAFE