Economic Update: Countries’ Evolving Vulnerability from a Child’s Perspective ppt
Bạn đang xem bản rút gọn của tài liệu. Xem và tải ngay bản đầy đủ của tài liệu tại đây (301.53 KB, 7 trang )
Economic Update: Countries’ Evolving
Vulnerability from a Child’s Perspective
INTRODUCTION
On the heels of the unprecedented food and fuel price increases in 2007-08, global
economic activity is expected to contract for the rst time since the WWII
1
. In
combination, these events are likely to have a serious impact on the well-being of
children in lower-income households around the world.
2
An important step towards
identifying appropriate policy responses is the frequent assessment of how and
to what extent a country is being adversely aected. While it is dicult to rapidly
measure the direct impact of the crisis on children, child vulnerabilities can be
indirectly assessed by monitoring developments in areas that are closely related to
child well-being and for which timely data is available.
Children are particularly aected by changes in local food prices, not only as there
are a greater number of children living in poorer households, but under-nutrition
- even for short periods - can have long term consequences for children.
3
As such,
changes in local food prices give important insights into how household budgets
and, in turn, provisions for children’s nutrition and health are being squeezed.
Furthermore, as poorer households generally have fewer assets and limited access
to credit, their coping capacity depends crucially on their earning prospects, which
may be approximated by measuring the overall growth prospect of a given country.
By examining the recent developments in local food prices and the latest economic
projections, this note identies the main sources of vulnerabilities at the country level,
taking into account existing child nutrition, health, and survival conditions.
Local food prices and •
household earning
prospects are among the
key factors aecting the
well-being of children
A sizable number of low-•
income countries continue
to face high and rising food
prices at local levels
Combined with weakening •
growth and job prospects,
high and rising food prices
are severely eroding
households’ purchasing
power in these countries,
especially among the poor
Existing child nutrition, •
health, and survival
conditions are weak in most
of these countries, implying
that a large share of their
populations are entering
this crisis with limited
coping capacity
JUNE 2009
UNICEF POLICY AND PRACTICE
SOCIAL AND ECONOMIC
POLICY WORKING BRIEFS
2
UNICEF
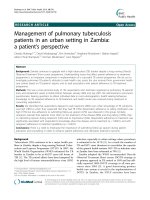
prices, measured as part of the consumer price
index basket, have instead risen more than
ten percent over the same period (2008Q1-
2009Q1) in 34 countries (out of 100 countries
where food CPI data is available for 2009 - Figure
1). In ten countries, seven of which are low-
income African countries, local food prices have
increased more than 20 percent, reaching over
35 percent in Seychelles, Ethiopia, and Kenya.
In addition, while a handful of countries’ food
prices have come down from their peaks in 2008,
27 countries continue to see their food prices
rising, although the rate of increase has generally
moderated.
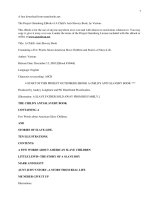
Moreover, the eects of the cumulative price
increases on households’ purchasing power
are shown to have been considerable in some
countries over the past two years. Figure 2
compares the increases in local food prices with
those in nominal per-capita GDP (a crude proxy
for change in per capita income).
5
It shows that,
over the past two years, in 24 countries with
relatively high food ination, economic growth
has fallen short of generating sucient income
to cover the rising food cost for the population
as a whole, implying reduction in household real
income (or purchasing power) by 20 percent
or more in Seychelles, Kenya, Nicaragua, Togo,
and Fiji. In particular, poorer households in
these countries are likely faring even worse,
considering that they spend a greater proportion
of their earnings on food and at the same time
tend to earn less than those skilled and/or in
formal sectors.
6
In countries where per capita GDP growth has
exceeded food price increases, some households’
gross income may have increased enough to
oset the food price increases. However, there
is still a risk that the purchasing power of the
poorer households is being eroded by the food
price increases, as earnings tend to be accrued
by higher income segments of the population.
As such, the cumulative eects of rising food
-20
-10
0
10
20
30
40
50
60
70
Seychelles
Ethiopia
Kenya
Uganda
Iceland
Rwanda
Niger
Costa Rica
Viet Nam
Pakistan
Ghana
Nicaragua
Zambia
Nigeria
Nepal
South Africa
Benin
Namibia
Honduras
Côte d'Ivoire
Burkina Faso
Togo
Lesotho
India
Oman
Indonesia
Panama
Philippines
Belize
Fiji
UK
Korea
St. Vincent Gren.
Serbia
2008Q1-2009Q1
2008Q4-2009Q1
Percentage increase in food CPI
Sources: ILO Laborsta database (May 2009) and UNICEF staff calculations.
Countries with an annual increase in food CPI exceeding 10 percent as of 2009Q1
Figure 1. Local food prices remain high and continue to rise in many
countries
HIGH AND, IN SOME CASES, RISING
FOOD PRICES REMAIN A THREAT TO
CHILD SURVIVAL IN LOWINCOME
COUNTRIES
The economic recession has dampened the
inationary pressures from the large food and
fuel price increases in 2007-08 in most developed
countries. World ination in 2009 is expected to
moderate to a low single digit level, while the
international wholesale raw food price index has
for the moment fallen back to its 2006 level since
its decline in the second half of 2008. However,
reports emerging from many low-income
countries continue to highlight food insecurity
among poor households, with rural areas being
hardest hit in some countries and poor urban
areas in others.
4
Using data regularly published by
the ILO for over 100 countries, analysis conrms
what is being witnessed in many developing
countries in terms of the severity of the impact
of continued rising food prices on households’
purchasing power.
While the world raw food index had dropped
20 percent in one year by early 2009, local food
3
Economic Update: Countries’ Evolving Vulnerability from the Lens of Children
(i.e. balance of payments) diculty is severe, causing
local currency devaluations.
The latest IMF projections show that, although the
crisis has emanated from the advanced markets,
nearly half of all developing countries are expected
prices is particularly worrying for the nutrition
security of children in poorer households, whose
coping capacity had been weakened by the
previous hikes in food and fuel prices.
7
ECONOMIC SLOWDOWN IS HAVING
A VISIBLE IMPACT ON HOUSEHOLD
INCOME
The global economic crisis is not only making
things signicantly worse in countries facing
continued high and rising food prices (mostly
low income and some middle income countries),
but is also quickly creating economic diculty in
others.
These diculties are being felt through four
main channels. First, a sharp contraction in
world trade volume and commodity prices—
projected by IMF to be 12 percent and 27-46
percent respectively—is leading to growth
deceleration and in turn increased un- and
under-employment. Secondly, remittances have
decreased or stopped as a result of job losses
or fewer working hours among international
labour migrants, with the impact being felt
much more strongly among the poor families
left behind.
8
Thirdly, disruption in international
capital markets has caused a sharp contraction
in net private capital inows to developing
countries—a reduction of 70 percent from the
2007 peak level according to the World Bank—
with decline in foreign direct investments having
particularly adverse impact on employment.
Finally, the prolonged weak economic
conditions in advanced market countries are
putting Ocial Development Assistance (ODA)
under threat, limiting the scope for households
to cope through public resource transfers.
While these channels are aecting countries
and their populations in dierent ways, they are
invariably slowing countries’ economic growth,
weakening their current account balance, and,
where combined current and capital account
0
20
40
60
80
100
120
Seychelles
Kenya
Nicaragua
Togo
Fiji
Niger
Burkina Faso
Costa Rica
Ethiopia
Côte d'Ivoire
Uganda
Lesotho
Pakistan
Benin
Iceland
Honduras
Namibia
South Africa
Viet Nam
Nigeria
St. Vincent Gren.
Nepal
Bolivia
Guatemala
Turkey
Zambia
Panama
Bangladesh
Sri Lanka
Oman
Madagascar
Guinea
India
Jordan
Lithuania
Serbia
Ghana
Latvia
China
Indonesia
Rwanda
Food CPI, 2007Q1-2009Q1
Nominal per-capita GDP, 2006-08
(Percentage change)
Sources: ILO laborsta database (May 09), IMF WEO database (Apr. 09), and UNICEF staff calculations.
Ave. price
increase: 40%
Ave. price
increase: 27%
↓
↓
Countries with an accumulative increase in food CPI exceeding 20 percent as of 2009Q1
Figure 2. Households’ purchasing power is severly eroded in some
countries
0
5
10
15
20
25
Latvia
Azerbaijan
Estonia
Angola
Armenia
Lithuania
Seychelles
Cambodia
Singapore
Ireland
Iceland
Ukraine
Turkey
Venezuela
Georgia
Russia
Myanmar
Botswana
Hong Kong SAR
Sudan
Equatorial Guinea
Antigua Barbuda
Dominican Rep.
Belarus
Slovak Republic
Bahamas, The
Finland
Trinidad Tobago
Moldova
Thailand
Japan
Croatia
Colombia
Costa Rica
Slovenia
St. Vincent Gren.
Sources: IMF WEO database (April 2009) and UNICEF staff calculations.
Per-capita Real Growth Deceleration
(Annual percentage change, ave. 2008-09 over ave. 2004-07)
Countries with growth deceleration exceeding 5 percent.
Figure 3: Growth in countries heavily dependent on commodity/
tourism exports and capital inows is expected to slow sharply
4
UNICEF
economic slowdown is likely to lead to
substantial losses of jobs and incomes.
In addition, the two waves of food and
economic crisis have caused signicant current
and capital account deterioration, notably in
several low income and import-dependent
countries, and this has led to sharp depreciation
of the local currency, fueling the increases in
local consumer and food prices through higher
import costs. Since 2007, 20 countries have lost
over 20 percent of value in their currencies,
of which Seychelles, Namibia, Sierra Leone,
Senegal, and South Africa experienced dramatic
depreciations exceeding 40 percent (Figure 4).
In these countries, while the rate of depreciation
has slowed, the full pass-through eects of such
large losses in local currency values on local
prices are likely to be felt at a later time.
The latest unemployment data from ILO,
available for 36 countries, allow a preliminary
assessment of countries that have shown signs
of labour market distress as of the rst quarter
of 2009 (Figure 5). Not surprisingly, the U.S.
and advanced market countries have seen a
sharp increase in the unemployment rate over
the past year. Several developing countries
are also suering rising unemployment,
although little can be said for most developing
countries where up-to-date unemployment
data is not available. Relatively high female
unemployment rates also suggest that
women are being harder-hit than men in
some developing countries (i.e. Jordan, Turkey,
Philippines, and Romania). The emerging signs
of labour market distress is particularly worrying
for poorer people, as unemployment will likely
intensify the downward pressure on informal
sector earnings and many of the poor are in
‘vulnerable’ employment and/or are considered
as ‘working poor’ to begin with.
0
1
2
3
4
5
6
Puerto Rico
USA
Turkey
Canada
Slovakia
Singapore
Taiwan,China
Ecuador
HongKong,China
Sweden
Czech Republic
Chile
UK
Australia
New Zealand
Finland
Austria
Luxembourg
Macau,China
Norway
Romania
Slovenia
Switzerland
Japan
Denmark
Korea, Rep.
Philippines
Brazil
Jordan
total unemployment rate
Unemployment rate, women
Annual change in percentage points
(2008Q1-2009Q1)
Sources: ILO Laborsta database (May 2009) and UNICEF staff calculations.
Countries with an increase in total unemployment rate
Figure 5: Unemployment rate has risen in some countries and territories
0
20
40
60
80
100
120
140
160
180
200
Seychelles
Namibia
Sierra Leone
Senegal
Iceland
Ukraine
Korea
South Africa
Lesotho
Swaziland
UK
Pakistan
New Zealand
Mexico
Belarus
Russia
Indonesia
Botswana
Romania
Zambia
Sweden
Australia
Kiribati
Serbia
Burundi
Turkey
Hungary
Poland
Percentage change in national currency per US$
(2007Q1-2009Q1)
Countries with more than 15 percent decline in local currency value
Sources: IMF IFS database (June 2009) and UNICEF staff calculations.
Figure 4: Balance of payment diculties have led to sharp deterioration
in some countries
to experience signicant growth deceleration
and current account deterioration (Figure 3). In
particular, countries that have relied heavily on
capital inows (such as Latvia, Estonia, Lithuania),
energy-exporting countries (such as Angola,
Armenia, and Azerbaijan), and countries heavily
dependent on tourism (such as Seychelles and
the small-Caribbean island states) appear to
be hardest hit. In these countries, the sharp
5
Economic Update: Countries’ Evolving Vulnerability from the Lens of Children
COUNTRIES ARE VULNERABLE IN
DIFFERENT WAYS
The recent developments above highlight the
increasing vulnerabilities in many low-income
countries and some middle-income countries,
where households continue to battle with the
eects of high and rising food prices, while
sharply slowing domestic growth is limiting
their coping capacities through earnings. For
other countries, notably many middle- and
high- income countries, ination pressures have
largely subsided, but households are grappling
with the challenge of rapidly worsening
employment prospects as a result of signicant
growth deceleration and current account
deteriorations. Regardless of the sources of risk,
the level of existing child outcomes are a vital
indicator to consider, as weak existing child
nutrition, health, and survival conditions leave
children particularly vulnerable to any further
shocks.
Country vulnerabilities can be grouped
according to the main sources of risk that
each country faces (although clearly these
vulnerability groupings will change as the crisis
evolves and the full eects are manifested
throughout the year). Figure 6 identies
countries that have high levels of existing child
vulnerability (Group I)
9
and those being heavily
impacted by the crisis through negative income
shocks and with sharply decelerating per-capita
growth and current account deterioration in
2008-09 (Group II)
10
. Countries in which children
are at particularly high risk are those that fall into
both categories (Group III). Countries that are
underlined face continued high and rising local
food prices, and in these children’s vulnerabilities
are likely to further increase as households’
purchase power continues to decline.
11
India
Madagascar
Mozambique
Ethiopia
Liberia
Lesotho
Pakistan
Congo Dem. Rep.
Sierra Leone
Nigeria
Chad
Bangladesh
Burkina Faso
Central Afr. Rep.
Togo
Zambia
Mali
Uganda
Ghana
Cameroon
Benin
Niger
Guinea-Bissau
Mauritius
Rwanda
Burundi
Djibouti
Guinea
Nepal
Côte d’lvoire
Eritrea
Yemen
Malawi
Congo
Timor-Leste
Somalia
Angola
Myanmar
Sudan
Equatorial Guinea
Afghanistan
Mauritania
Latvia
Azerbaijan
Estonia
Armenia
Lithuania
Seychelles
Cambodia
Singapore
Ireland
Iceland
Ukraine
Turkey
Venezuela
Georgia
Russia
Botswana
Hong Kong, SAR
Antigua Barbuda
Dominican Rep.
Belarus
Slovak Rep.
Bahamas, The
Finland
Trinidad Tobago
Moldova
Thailand
Japan
Croatia
Colombia
Costa Rica
Slovenia
St. Vincent Gren.
Barbados
Romania
Serbia
Cape Verde
Hungary
Spain
Grenada
Germany
Bulgaria
Netherlands
Bhutan
Bosnia Herz.
South Africa
Italy
Belgium
Namibia
Libya
Vietnam
Kenya
Malta
St. Kitts Nevis
Jamaica
Poland
Honduras
United States
Portugal
New Zealand
Qatar
Chile
Macedonia
Mongolia
Bahrain
St. Lucia
Jordan
Group I
Group III
Group II
Figure 6: An Example of Country Vulnerabilty Groupings
Sources: State of World Children (UNICEF 2009) and World Economic Outlook database
(IMF 2009).
Group I: countries that have high levels of existing child vulnerability.
Group II: countries heavily impacted by the crisis through negative income shocks.
Group III: countries falling into both Groups I and II.
Underlined countries face continued high and rising local food prices.
6
UNICEF
aect resource allocations, and to make children
a priority in national programmes addressing the
poverty of families raising children.
According to the 2009 UNICEF report on “A Matter 4.
of Magnitude: The Impact of the Economic Crisis
on Women and Children in South Asia,” the
number of people suering from chronic hunger
in South Asia has increased by about 100 million
in the space of the past two years.
Given that the poor receives a smaller share of 5.
the national income, the gaps between the two
columns may be seen as a low bound estimate on
what the average change of poor households’ real
income or purchasing power has been since the
end of 2006 in these countries.
The majority of farmers in developing countries 6.
are small- and medium-hold farmers, who are net
food buyers on an annual basis. See discussions
in The Hunger Series: Hunger and Markets, WFP
2009.
Recent reports on the impact of the Global 7.
Financial Crisis on Vulnerable Households in
Ghana, Bangladesh, and Nicaragua (WFP 2009)
found that the poor coped with the eects of
the 2007-08 food and fuel crisis by cutting down
non-food expenses, reducing food intake, and
selling belongings, especially in rural areas.
Recent report on the Impact of the Economic 8.
Downturn on International Labor Migrants
and Their Families in Vietnam (UNICEF 2009)
revealed that the majority of international labor
migrants of Vietnam experienced sharp reduction
in income or stopped sending remittances to
their families. They also borrowed to look for
new work, putting them in a vicious cycle of
indebtedness.
These are countries which have high 9.
measurements in at least two of the four
social indicators (under-ve mortality>100,
wasting>10%, stunting>30%, and HIV
prevalence>1%). Countries in each group are
sorted vertically by per-capita GDP growth
deceleration in a descending order.
These are countries with GDP per capita growth 10.
deceleration > 3% of GDP (or GDP per capita
CONCLUSION
This update nds growing vulnerabilities in an
large number of countries. A sobering picture
and one that may yet get worse. While this
update focuses on prices and earning prospects,
social spending and services also play a role
in helping households cope, and a worrying
development in this regard is the considerable
scal deterioration experienced in many
countries.
12
As developing country governments
have gradually depleted scal reserves and are
facing tighter cash constraints—at a time that
external credit and aid access is also becoming
more dicult and uncertain—social spending
cuts have already been announced in some
countries and will likely be seen more widely as
the year progresses. There is the additional risk of
the global economic crisis becoming protracted
as a result of delayed or ill-designed policy
responses. For both reasons, the full eects of
the crisis may yet to have been fully felt, with the
situation likely to worsen throughout the year
and into 2010. Accordingly, in-depth surveys,
rapid assessments, and poverty and situation
analyses at the country and regional levels are
going to be crucial to monitor the price of food
and other vital commodities as well as other
economic and social developments.
REFERENCES
See example for World Economic Outlook (IMF 1.
2009) and Global Development Finance (World
Bank 2009).
The adverse impact of the food and fuel crisis 2.
in 2007-08 on nutrition and health is well
documented in Thematic Report 2008 on Policy
Advocacy and Partnerships for Children’s Rights
(UNICEF 2009). See also “The impact of the
increase in food prices on child poverty and the
policy response in Mali” (Innocenti Working Paper
2009-02).
UNICEF launched a Global Study on Child Poverty 3.
and Disparities in September 2007, which aims to
inuence the economic and social policies that
7
Economic Update: Countries’ Evolving Vulnerability from the Lens of Children
growth <-3%) and current account deterioration
>3% of GDP (or current account decit/ GDP
< -3%). Countries in each group are sorted
vertically by per-capita GDP growth deceleration
in a descending order. Data for Zimbabwe is not
available.
These are countries with greater than 30 percent 11.
increase in food CPI over 2007Q1-2009Q1, or if
food CPI is not available, over 30 percent increase
in year-end CPI over 2006-2008.
The latest IMF projection in World Economic 12.
Outlook (2009) expects 5 percent of GDP
deterioration in scal balance in emerging and
developing countries, and 7 percent of GDP
decline in advanced countries, which likely leads
to further cuts in foreign aid.
About the Working Brief Series
This Working Brief was submitted by Jingqing Chai of the Economic and Social Policy Unit of UNICEF’s
Division of Policy and Practice (DPP). For more information on this issue, or to share comments, please
contact Working Briefs are prepared to facilitate greater exchange of knowledge and
stimulate analytical discussion on social policy issues. Their ndings, interpretations and conclusions do
not necessarily reect the policies or view of UNICEF. The designations in this publication do not imply
an opinion on legal status of any country or territory, or of its authorities, or the delimitation of frontiers.
The editors of the series are Gaspar Fajth and David Stewart of the Policy, Advocacy and Knowledge
Management Section. For more information on the series, or to submit a working brief, please contact
or