Economic Costs and Benefits of Allocating Forest Land for Industrial Tree Plantation Development in Indonesia pdf
Bạn đang xem bản rút gọn của tài liệu. Xem và tải ngay bản đầy đủ của tài liệu tại đây (1.35 MB, 39 trang )
Julia Maturana
CIFOR Working Paper No.30
Economic Costs and Benefi ts of
Allocating Forest Land for Industrial
Tree Plantation Development
in Indonesia
Economic Costs and Benefi ts of Allocating
Forest Land for Industrial Tree Plantation
Development in Indonesia
Julia Maturana
Center for International Forestry Research (CIFOR)
Jalan CIFOR Situ Gede, Sindang Barang, Bogor Barat 16680, Indonesia
E-mail:
2005 by CIFOR
All rights reserved. Published in 2005
Printed by Subur Printing, Jakarta
Cover photos by Julia Maturana
Published by
Center for International Forestry Research
Jl. CIFOR, Situ Gede, Sindang Barang,
Bogor Barat 16680, Indonesia
Tel.: +62 (251) 622622; Fax: +62 (251) 622100
E-mail:
Web site:
Contents
Abbreviations and acronyms iv
Glossary v
Acknowledgements vi
Abstract vii
Introduction 1
Proposed Approach 1
Conceptual framework 2
Economic Assessment 2
Reasons for Using Economic Assessment 2
Type of Impacts Included and Their Effects on Welfare 3
Study cases 4
Determining the Economic Impacts at the Aggregated Scenario 4
Estimation of Economic Benefi ts and Costs 6
Economic Benefi ts 6
Economic Costs 7
Estimations Case by Case 8
Inti Indo Rayon in North Sumatra 10
Arara Abadi in Riau 11
Riau Andalan Pulp and Paper in Riau 12
Wira Karya Sakti in Jambi 13
Musi Hutan Persada in South Sumatra 14
Aggregated Economic Benefi ts and Costs for the Country 14
Discusion 16
Economic Benefi ts 16
Economic Costs 17
Comparing the Five Plantation Projects 18
Data and Assumptions 19
Scenarios 19
Conclusions 21
References 23
Annexes 25
iv
Abbreviations and acronyms
AA Arara Abadi—Plantation Company associated with IKPP pulp mill and
APP Group
APP Asia Pulp and Paper
APRIL Asia Pacifi c Resources International Holdings
DR Dana Reiboisasi (Reforestation payment)
EB economic benefi t(s)
EC economic cost(s)
GOI Government of Indonesia
HTI Hutan Tanaman Industri (Industrial Timber Plantation)
IIR Inti Indo Rayon—Plantation Company associated with TPL pulp mill
and RAPP Group until 2002
IKPP Indah Kiat Pulp and Paper mill
MAI mean annual increment
MHP Musi Hutan Persada—Plantation Company associated with TEL mill and
Barito Pacifi c Group
MHW mixed hard wood
MWP mean wood production
NGO non-governmental organization
NTFP non-timber forest product
PSDH Provisi Sumber Daya Hutan (Government tax for logged/harvested
wood)
RAPP Riau Andalan Pulp and Paper Group
SMG Sinar Mas Group
SPK Sumbangan Pihak Ketiga (Payment to third parties)
TEL Tanjung Enim Lestari mill
TEV total economic value
t tonne (metric ton)
TPL Toba Pulp Lestari mill
WKS Wira Karya Sakti—Plantation Company associated with Lontar Papyrus
pulp mill and APP Group
v
Glossary
belukar Indonesian term to refer to old fallow or degraded secondary
forests
existence value the value attached to maintaining the inherent value of nature
for future generations
externality benefi ts or costs generated as the result of an economic activity
that do not accrue directly to the parties involved in the activity;
for example, environmental externalities are benefi ts or costs
that manifest themselves through changes in the physical or
biological environment regardless of the relationship of the
parties to the environmental regime impacted
harvest extraction of products from plantations
jungle rubber rubber trees (Hevea brasiliensis) planted as enrichment in
fallow
logged-over forest forested areas from which the timber with commercial value has
already been extracted
marginal costs the change in total cost associated with producing each extra
unit of output; calculated by dividing the change in total cost
by the change in output
marginal utility the added utility or satisfaction derived from the consumption
of an additional unit of a good
mean annual increment (MAI) the total increase of volume growth of trees per unit area (ha)
up to the end of the rotation period, divided by the number of
years in the rotation
monopsony a structure for an input (pulpwood) market for which there is
only one buyer—the (pulpwood) supply curve has a positive slope;
‘monopsony power’ is in the hands of the buyer that can force
prices down by restricting purchases
opportunity cost the cost of a resource X calculated at the best alternative use
of it. It actually represents the minimum amount of money that
a given agent will be willing to accept for the resource, and is
therefore a measure of the value of such resource
optimal allocation resources are optimally allocated if they are in the ‘optimal
situation’ and any change in such allocation diminishes the
welfare of at least one of the agents involved in the decision;
thus, the allocation of resources is such that all agents are in
their best possible option
option value value attached to maintaining the natural landscape and its
resources so that future generations have the social option to
select the species best suited to their needs
shadow price adjusted price that takes into account market price distortions
and government objectives; also known as ‘accounting price’;
represents the opportunity cost of producing or consuming the
resource
social costs those costs met by society when goods are produced, e.g.
pollution
vi
Acknowledgements
The author wishes to thank the following people for their valuable comments and support during
the fi eldwork and preparation of this report.
At CIFOR:
Christian Cossalter; Philippe Guizol; Rosita Go; Ani Nawir; David Kaimowitz; Glen Mulcahy; Luluk
Suhada; Yemi Katerere.
As well as the people at the Ministry of Forestry, Local Government, Badan Pusat Statistik (BPS)
and NGO local offi ces at District and Sub-District levels of North Sumatra, Riau, Jambi and South
Sumatra.
I am especially thankful to the Dutch Government and its Associate Professional Offi cers Programme,
for supporting my stay at CIFOR during the time of this research.
vii
Abstract
In the late 1980s, large amounts of money and areas of Indonesia’s forestland were allocated
for the development of fast-growing pulp plantations. The “fi nancial” costs and benefi ts of this
action—representing only a portion of the actual totals can be easily accounted, while the full
“economic” benefi ts and costs remain hidden. Knowing the net economic benefi ts can provide
useful inputs for the Government of Indonesia and other interest groups to revise current policies
or regulations and setting new directions for future plantation projects that benefi t the national
economy in the long term.
This paper examines the total economic costs and benefi ts of fi ve large pulp plantation projects
in Sumatra, Indonesia. Four of the fi ve plantation projects generate economic costs above their
economic benefi ts. The estimated economic costs represent over 30 times the actual fi nancial
payments the Government receives from each company.
The allocation of over 1.4 million hectares of forestland for conversion into tree plantations
generates net loses of over US$3 billion for the country. This analysis clearly demonstrates that
the Government of Indonesia should not allocate any more forestland for conversion into HTI pulp
plantations.
1
Economic Costs and Benefi ts of Allocating Forest Land for Industrial Tree Plantation Development in Indonesia
INTRODUCTION
Pulp industries developed rapidly in Indonesia
after large investments in this sector in the
late 1980s. The total pulp production in the
country rose from 3 million tonnes per year in
1997 (Barr 2001) to 5.6 million tonnes per year
by 2002 (FAO 2003).
Large areas of State-owned forestlands were
allocated through Industrial Timber Plantation
(HTI) permits and nearly US$100 million
of State-owned capital was allocated to
promote the development of industrial timber
plantations in the country (Barr 2001). The
total area allocated for the development of
such plantations up to 2002 was 5.38 million ha
(DEPHUT 2003), with approximately 41% of this
concentrated on the island of Sumatra.
The large areas of forest land given in
concessions comprise dryland logged-over
forests and jungle rubber; swamp forests; some
smallholders’ rubber and oil-palm plantations;
grasslands, and areas of agricultural fields
and village settlements. The forest plantation
companies were expected to produce the raw
material required by the national pulp industries
producing pulp for paper for both export and
internal consumption. Pulp and paper exports
generated US$2 billion in export earnings for
the country in 1997 (FWI and GFW 2002).
While the Government of Indonesia (GOI)
can easily account the fi nancial gains and losses
that its investments in the pulp mills and related
plantation companies have achieved, the
economic benefi ts and costs remain hidden. The
fi nancial costs represent only a small portion of
the actual total costs, leading to the perception
of greater net benefi ts than is actually the
case. The real costs include the direct fi nancial
costs of the investments and running the pulp
mills and pulp plantation companies plus the
costs—borne by the local people, Indonesia
and the world—of the large areas of forest land
allocated for the HTI projects.
Although several studies have looked at
the fi nancial and economic aspects of the pulp
and paper industry and analysed HTI plantations
in Indonesia (Davis 1989; MoF 1994; Potter and
Lee 1998; Kartodihardjo and Supriono 2000;
Barr 2001; van Dijk 2003), there has been no
study of the economic impacts of these HTI
plantations on the country.
In this paper, I aim to calculate the total
economic costs and benefi ts of fi ve large HTI
projects in Sumatra, Indonesia, taking into
account the differences in the types of forest
and landscape of the areas given in concession
and the production capacity of their associated
pulp mills. Specifi cally, I determine the main
economic effects and impacts generated by the
projects; analyse and compare the economic
performance of five forest plantation case
studies, and highlight the main elements
determining their performance. The results
provide useful inputs for the GOI and other
interested parties to assess the net economic
performance of the HTI projects for the country
and revise current policies or regulations that
guide new plantation projects targeting higher
economic (not only fi nancial) benefi ts for the
country.
Proposed Approach
A graphical analysis is used to show the impacts
of the HTI projects and the related goods and
services affected. Market or shadow prices
1
are used to quantify such impacts when a
market exists, otherwise a value is assigned
using existent estimations of the value for the
non-market products or services related to the
areas under assessment.
Positive and negative impacts related
to the HTI timber plantation companies are
identifi ed and measured in their respective
markets in terms of goods produced and cost
incurred, to allow comparisons among the
cases.
1
For defi nition see Glossary.
2
Julia Maturana
CONCEPTUAL FRAMEWORK
Economic Assessment
Economics, optimisation and scarcity are three
interrelated concepts. Human needs increase
over time and the way to satisfy such needs is
to consume resources. Social development has
been based on the consumption of resources. For
various reasons (e.g. biophysical differences,
natural extinction processes, high rates of
consumption, social accumulation), some
resources have become scarce—sometimes
generally scarce, sometimes scarce in specifi c
areas, and sometimes scarce for certain groups.
Economic science has developed as a response
to the need to optimally allocate scarce
resources to satisfy the increasing needs of
society. Optimal allocation is observed when
there is no option to improve the situation for
the agent or group of agents analysed given
a specific amount of resources at a given
moment
2
.
When an investment project or a policy to
guide investments is established, the decision-
maker is targeting specific objectives—for
example, a family makes investments to
assure its present and future welfare, a fi rm
intends to maximise benefi ts, and governments
invest public money to achieve specifi c socio-
economic objectives to improve the welfare
of society. Any policy or programme, or any
economic decision must be assessed in terms of
the impact pursued. Economic assessment is the
tool that analysts have to guide national-level
decision processes and to analyse economic
policies. It evaluates the contributions of a
given policy, project or decision to the welfare
of society. The value of any good, factor or
resource to be used or produced by the project
is valued in terms of its contribution to national
welfare.
Reasons for Using Economic
Assessment
Such economic and society welfare improvements
are diffi cult to measure. Any action implies gains
and losses, a given policy or investment decision
can lead to opposite effects and impacts on
different groups. A given action can improve
the welfare of some, but reduce that of others;
or it could increase the level of consumption
of all the inhabitants (welfare improvements),
but increase pollution in the country (welfare
losses). If a given policy has no negative effects
on any group, that policy is undoubtedly good
for the people; however, such cases are rarely,
if ever, observed in the real world. What we
usually observe are some positive and some
negative impacts. The important thing then is
to know if the result of the combined impacts
is leading society (as a whole) to a better-off
or a worse-off situation.
Economic theory suggests that we add up
the gains of all the agents who would be in a
better situation, and all the losses of the agents
who would be in a worse situation. If the result
is a net gain, the policy or action should be
applied, otherwise it should not. This economic
assessment is conceptually based on ‘welfare
theory’
3
and its defi nitions of welfare, utility
and social behaviour.
Consequently, we analyse the total
economic benefi ts (EB) caused by the production
of the project (EB of the production) and the
economic cost (EC) of inputs and factors used
(EB and EC are usually analysed separately on
their respective markets). The analysis focuses
on consumption changes for different goods and
services, and on the use of resources, inputs
and productive factors. Instead of focusing on
the effects on different consumers, it focuses
on the effects on aggregated consumption
and production. This analysis is also known as
2
For defi nition see Glossary.
3
For a broad study of welfare theory, refer to Just et al. (1982) and Mishan (1988).
3
Economic Costs and Benefi ts of Allocating Forest Land for Industrial Tree Plantation Development in Indonesia
benefi t-cost analysis using ‘effi ciency or shadow
prices’.
The use of observed prices can lead to
wrong (over- or under-valued) estimations
4
of
benefi ts and costs when we are working in a
‘distorted’ economy, characterised by market
failures such as subsidies, taxes, monopolies,
and externalities
5
. Nevertheless, the problem
can be ‘corrected’ by analysing each market
failure, and the effects on prices and traded
quantities for a given good in a given market.
Types of Impact Included and
Their Effects on Welfare
To value (put a price on) the benefi ts or costs of
a given investment or action, taking into account
all economic benefits, the theory suggests
measurement of the changes in consumption
(present and future) for all goods and services
(market and non-market). Positive impacts on
these goods and services are considered social
benefi ts and negative impacts are considered
social costs. Positive impacts on consumption
are the result of a project generating goods or
services, while negative impacts would result
from a project requiring a scarce input or factor.
The latter is accounted as a cost, because the
consumption of such elements is only possible
if other agents in the society release them,
thereby losing in economic terms.
Other positive and negative impacts are
linked to the use of resources (indirect impacts
on consumption) such as release or consumption
of resources through substitution, savings, use
or compromise of productive factors and inputs.
These resources are valued in terms of the
opportunity cost
6
of using such resources.
Positive and negative impacts to identify
correspond to (Castro and Mokate 1998):
• Increase/reduction in the consumption
of market and non-market goods and
services;
• Increase/reduction in exports (foreign
exchange earnings increased or
reduced);
• Reduction/increase in imports (foreign
exchange savings or expenditure);
• Release/compromise of productive
resources.
4
When perfect competency is observed, price refl ects the marginal costs (for the producers) and the marginal
utility (for the consumers). The existence of market failures results in observed prices not refl ecting either
marginal costs or marginal utility. In such cases, the price does not represent a true refl ection of economic costs
or benefi ts.
5
For defi nition see Glossary.
6
For defi nition see Glossary.
4
Julia Maturana
STUDY CASES
Determining the Economic Impacts
at the Aggregated Scenario
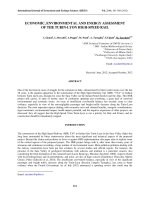
Between 1984 and 1996, the GOI allocated a total
area of nearly 1.4 million ha of forest land to
fi ve plantation companies in Sumatra (Fig. 1), to
harvest (clear cut) the areas for the production
of pulp wood and establish tree plantations.
These concessions were granted to groups that
were developing or expanding pulp or pulp and
paper mills with the purpose of sustaining their
production
7
. From 1984 onwards, the related
pulp mills initiated operations and increased
their installed capacity to make use of the large
sources of raw material made available for their
pulp production.
Supply and demand are integrated as a
result of the fact that the same groups own
both the mills and the companies holding the
HTI concessions. Consequently, the volume of
pulpwood produced depends on the amount
required by the pulp mills; so, supply volume
is matched to the level of the demand. This
implies that the price is not determined by
market forces, but by the profi t maximisation
of the group managing the integrated chain
of production. Since the system works as a
monopsony, the pulpwood is undervalued (there
is no other market), resulting in a transaction
price (at the pulpwood market) below the
optimal price.
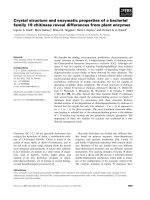
The aggregated effect, observed at
the pulpwood market, can be represented
graphically (Fig. 2). The projects cause an
increase in the supply of pulpwood, represented
by a movement of the original supply curve from
S to S’. The demand is also increased through
Figure 1. Location of the fi ve pulp-plantation companies included in the study
TPL : Toba Pulp Lestari
IK : Indah Kiat
RAPP : Riau Andalan P&P
LP : Lontar Papyrus
TEL : Tanjung Enim Lestari
SUMATRA
KALIMANTAN
JAVA
TPL
IK
LP
TEL
Inti Indo Rayon
Arara Abadi
RAPP
Wira Karya Sakti
Musi Hutan Persada
7
Three pulp and paper mills, one pulp and rayon mill, and one pulp mill.
5
Economic Costs and Benefi ts of Allocating Forest Land for Industrial Tree Plantation Development in Indonesia
Log-yard of one of the HTI plantation companies in Sumatra (Photo by Julia Maturana)
the creation of the pulp mills and increases
in installed capacity, represented with the
movement of the demand curve from D to D’.
The price of pulpwood remains unchanged,
because the increase in supply is not observed—
the fi ve pulpwood producers sell their product
to their own mills.
The supply curve is inelastic with respect
to the price because of the integrated nature
of the market (i.e. producers and buyers are
S’
S
D’
2003
q
1
Q
q
0
D
Before 1984
P
p
Figure 2. Pulpwood market
Key: D = original demand (in this case before 1984, before concessions); D’ = later demand (in this case in 2003);
P = price axis; p = transaction price (assumed static over time); Q = quantity (of pulpwood) axis;
q
0
= quantity (of pulpwood) produced (pre-1984); q
1
= quantity (of pulpwood) produced (in 2003);
S = supply curve (pre-1984); S’ = supply curve (2003).
6
Julia Maturana
S
D
,
after HTI concessions
P
p
D
q
0
q
1
Q
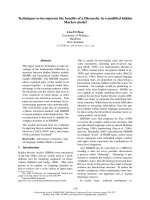
Figure 3. State forest land (hypothetical market)
Key: D = original demand (in this case before 1984, before concessions); D’ = later demand (in this case in 2003);
P = price (of forest land) axis; p = transaction price; Q = quantity (of forest land) axis;
q
0
= quantity (of forest land) demanded (pre-1984); q
1
= quantity (of forest land) demanded (in 2003); S = supply
(of forest land) curve.
linked). The fi nal portion of the curve should be
vertical once the maximum production allowed
by the ecosystem (including plantations) has
been reached. The demand curve is also drawn
as a very inelastic line with respect to price
and it is mainly determined by the installed
capacity of the mills. The price elasticity of the
demand for the pulpwood market in Indonesia
calculated by FAO (1996) with large series of
data is –0.09 (scale: 0 = totally inelastic; 1 =
totally elastic).
Economic costs are related to the large
amount (over 1.4 million ha) of forest land
used. The effects can be observed in the
forest land’s (hypothetical) market. The price
for the resource (concession-related costs) is
established by the GOI taking into account non-
market considerations given the non-existence
of a market for the State forest land. The
allocated HTI licenses (concessions) for these
projects result in an increase in the demand for
State forest land from q
0
to q
1
(shown in Fig. 3)
by a movement of the demand curve from D to
D’. The supply is represented as a horizontal
curve capturing the fact that the area of State
land offered does not depend on its demand
but on the existing (available) area. The fi nal
vertical portion represents the limit for the
supply of State forest land. The aggregated
impacts of the HTI allocated area in concession
would be the result of summing positive
(economic benefi ts) and negative (economic
costs) impacts, for which it is necessary to
express them in numerical terms.
Estimation of Economic Benefi ts
and Costs
All the plantation companies in the analysis
obtained rights over approximately 300 000 ha
of State forest land for similar periods of time
(>40 years). Three of the concession areas
were mainly covered by logged-over forests
of mixed hard wood (MHW); one by pines and
logged-over forests of MHW, and one mainly by
grasslands (Imperata cylindrica) and degraded
forests (belukar).
Economic benefi ts and costs are calculated
for the period from 1984 to 2038. Three discount
rates (4%, 8% and 12%) are used to show the
values at year 0 (1984) to allow comparisons.
All costs and prices are quoted in US dollars
(2003). Three scenarios were created to test the
sensitivity of the analysis: an initial scenario of
stability; an optimistic scenario with increasing
prices of the pulpwood and area planted; and
a pessimistic scenario with decreasing prices
and area planted.
Economic Benefi ts
The increase in the supply of pulpwood observed
after the allocation of the State forest areas is
matched by the demand from the mills (actually
7
Economic Costs and Benefi ts of Allocating Forest Land for Industrial Tree Plantation Development in Indonesia
8
The monopsony sets the price for the inputs on the basis of its profi t-maximisation framework, thereby forcing
the price down.
the demand is determining the supply). The
related benefi ts may be accounted as the area
coloured in Figure 4 or by approximation:
EB
T
=
m
t
T
t
t
pqq ×−
∑
=1
01
)(
The price to be used corresponds to the
observed transaction (market) price (p
m
) of the
pulpwood each year (t). As mentioned before,
the pulpwood market for these plantation
companies is not a ‘perfect competence’
situation; on the contrary, the supplier faces
a monopsony in the demand, which reduces
the perceived price (p
p
) to a level below
the ‘competence’ price
8
(p
p
< p
m
). Using the
actually perceived price would lead to an
underestimation of the benefi ts of the projects.
In fact, the transaction price paid to Arara Abadi
plantation company by its related pulp and
paper mill, Indah Kiat, in 1998 and 1999, was
about US$8/m
3
compared with the US$42/m
3
paid for external logs at the mill gate (Ometraco
2000), and wood costs in 2002 quoted by APP
for both of its pulp and paper mills ranged
between US$34 and US$36 per m
3
(APP 2002).
Using this information as reference, the price
used in the analysis was US$40/m
3
for the fi ve
plantation companies.
The quantities (q
1
– q
0
)
t
correspond to the
total volume of pulpwood trended each year by
the fi ve plantation companies. These volumes
were calculated from the production capacities
of the related pulp mills.
Economic Costs
The related costs are accounted in terms of the
resources required to sustain the increase in
the supply of wood: the 1.4 million ha of MHW,
pine forests, degraded forests and grasslands
allocated to the projects, valued in their
respective markets. By approximation:
EC
T
=
s
t
T
t
t
pqq ×−
∑
=1
01
)(
The price actually paid for the use of these
forests (logging/harvesting permits, concession
payments, fees and taxes, etc.) represents
the current fi nancial costs for the plantation
companies and it is represented as p
c
(current
price) in Figure 5, determining the current costs
(dark grey area) of using these resources. These
p
p
S
p
m
S
,
D
,
2003
q
1
Q
q
0
D
Before 1984
P
Figure 4. Pulpwood market
Key: see Figure 2; p
m
= market price; p
p
= perceived price.
Notes: q
1
= q
0
+ 27 million m
3
/year.
The dark grey area represents the fi nancial infl ux for the plantation companies, determined by the perceived (actual)
price and the quantities traded. The light grey area represents the non-perceived benefi ts and is determined by
the undistorted price (US$40) that represents the market value of the pulpwood. The economic benefi t resulting
from the increase in annual consumption (demand) of nearly 27 million m
3
of pulpwood is obtained by summing
the two areas.
8
Julia Maturana
9
For defi nitions see Glossary.
Figure 5. State forest land (hypothetical market)
Key: see Figure 3; p
c
= current price; p
s
= social price; S
P
= supply curve (private); S
s
= supply curve (social); MSC
= marginal social cost; TEV = total economic value.
Notes: q
1
= (q
0
+ 1.4 million ha)
The dark grey area represents the fi nancial outfl ow of the plantation companies (current costs), determined by
the p
c
and the area in concession. The light grey area represents the non-perceived costs and is determined by the
difference between the TEV and the p
c
. The economic cost resulting from the compromise of over 1.4 million ha of
State forests are obtained by summing the two areas.
costs range from US$15 000 to US$99 million
per year per company, estimated from the
payments per volume established by the GOI
(PSDH, SPK and DR).
Given the non-existence of a market for
the State forests, no market price can be
observed. If a market existed, its price would
refl ect the value of such areas. Nevertheless,
this market price would also fail to value the
range of positive social benefi ts associated
with the positive externalities of these forests,
such as wilderness and biodiversity protection,
recreation, pollination, biological control,
habitat functions, historical information.
Such values are recognised through the total
economic value (TEV ≈ p
s
) estimation. The TEV
for Indonesian logged-over forests determined
by Simangunsong (2003) using a series of
estimations from different authors correspond
to US$1283/ha per year.
The quantities (q
1
– q
0
)
t
correspond to the
total area of State forests given in concession
to the plantation companies.
Estimations Case by Case
To calculate the aggregated economic costs
and benefi ts of these projects, the individual
quantities of pulpwood produced and areas of
forests used by each company are determined.
In doing this, the following assumptions were
made.
The area to measure the economic cost EC
(q
1
– q
0
) has been determined as a function of
the logged volumes of wood:
Economic Cost
t
= Area Logged
t
× TEV
t
The TEV was obtained from Simangungsong
(2003) who determines the TEV for logged-over
forests in Indonesia. The categories included
are: direct use value (timber, fuelwood,
non-timber forest products [NTFP] and water
consumption); indirect use value (soil and water
conservation, carbon sink, fl ood protection
and water transportation); and non-use value
(option and existence values
9
).
9
Economic Costs and Benefi ts of Allocating Forest Land for Industrial Tree Plantation Development in Indonesia
Economic Benefi t
t
= Volume of Production
t
×
Price
t
The price corresponds to a fi xed market
price for the pulpwood estimated at US$40/
m
3
. This price changes for the optimistic and
pessimistic scenarios.
The volume of production includes the
total volume of wood logged from the natural
areas, harvested from the plantations, and
obtained from other sources:
Volume of production
t
= Logged volume
t
+
Harvested volume
t
+ Other sources
t
Plantation companies match mill
requirements with natural wood before their
tree plantations are ready to harvest, and
it is assumed that they prefer to use logged
wood even if their plantations are ready. This
assumption is made taking into account that
costs of logging from natural forests are almost
half of those of harvesting from plantations (van
Dijk 2003), so:
Logged volume
t
= Mill requirement
t
(if Available Natural Forest
t-1
≥ Mill
requirement
t
)
Logged volume
t
= Available Natural Forest
t-1
(if Available Natural Forest
t-1
< Mill
requirement
t
)
Where:
(
)
or
()
Where, Area corresponds to the number
of hectares given in concession; the term
Feasibility captures changes in the amount of
area that can be actually logged and it depends
on the size of the area kept as conservation and
people’s settlements and crops; the mean wood
production (MWP) value represents the wood
productivity of the area and corresponds to the
volume of wood that can be logged from each
hectare of natural forest (average). This value
was obtained from the plantation companies
information and cross-checked with data
available for each of the areas when possible.
Mill requirement
t
= Production capacity
t
×
Quota
t
× Running
t
The production capacity was obtained from
actual data up to 2003 and then adjusted by
the expected increases with the information
from each company or maintained at current
levels. The Quota captures whether there are
one or more plantation companies supplying
raw material to the related pulpwood mill. The
Running value shows whether or not the mill
was running at full capacity in each year.
The harvested volume will depend on
the planted area and the remaining mill
requirements:
Harvested volume
t
= Harvestable volume
t
(if Mill requirement
t
– Logged volume
t
– Other
sources
t
> Harvestable volume
t
)
or
Harvested volume
t
= Mill requirement
t
– Logged
volume
t
– Other sources
t
(if Mill requirement
t
– Logged volume
t
– Other
sources
t
≤ Harvestable volume
t
)
Where:
The Planted Area was obtained directly
from each plantation company and represents
the area quoted by them as planted each year
from the fi rst year of operations up to 2003.
The values after 2003 represent the maximum
average value obtained from the period
previously quoted and are restricted by the
total area of land that it is feasible for each
company to plant. The mean of increment (MI)
was derived from the mean annual increment
(MAI)
10
of each plantation company for each of
the planted species and landscape units (peat or
dryland areas)—it changes over time according
10
For defi nition see Glossary.
10
Julia Maturana
to the information of each company. The Survival
Factor was also obtained from each of the
plantation companies for each planted species
and each of the landscape units. The Conversion
Rate is the calculated factor to convert 1 m
3
of
wood into 1 tonne of pulp—it changes depending
on the type of raw material (planted or logged
wood) and for each of the planted species. The
term ‘t-7’ captures the rotation period of the
planted species in analysis—for most of the cases
it is seven years except for one case where the
rotation period varies.
Inti Indo Rayon in North Sumatra
A total area of 284 060 ha was conceded in
1984, 1992 and 1994 to the plantation company
Inti Indo Rayon in North Sumatra through HTI
permits allowing clear cutting and settlement
of industrial tree plantations.
The concession areas are distributed
among fi ve districts, with about 50% of the area
concentrated in the district of Tapanuli Utara.
The areas were covered by pines (30%), MHW
(68%) and nearly 6000 ha of grassland (2%).
The plantation company initiated operations
in 1988 to supply the related pulp mill company
Indorayon (now Toba Pulp Lestari). The mill’s
demand was about 800 000 m
3
of pulpwood per
year until 1993, when it increased its demand
through expansion to nearly 1 million m
3
.
Around 70% of the allocated area
corresponds to cropland and settlements, and a
conservation zone, leaving only about 86 000 ha
feasible for logging and conversion.
The average area planted up to 2003 was
near 5000 ha/year with a total area planted of
about 53 000 ha.
The mill faced social diffi culties in 1998
during the economic and political crisis, and it
was closed down from 1999 until the beginning
of 2003, when it resumed operations.
The economic benefit (EB) of the TPL
concession project for the Indonesian society
for a total period of 48 years (1988-2035) was
calculated for each year (see Annex I.1) and
then brought to the year-0 (1984) value (in US
dollars):
Inti Indo Rayon Eucalyptus sp. plantation in North Sumatra (Photo by Julia Maturana)
11
Economic Costs and Benefi ts of Allocating Forest Land for Industrial Tree Plantation Development in Indonesia
IIR trucks carrying logs in North Sumatra (Photo by Julia Maturana)
= US$511,588,592
= US$241,626,464
= US$138,027,774
The economic costs (EC) at the three discount
rates are:
= US$1,398,888,431
= US$557,121,027
= US$263,921,323
The estimated benefi t-cost ratios for this
project are 0.37, 0.43 and 0.52 for the three
different discount rates (4%, 8% and 12%,
respectively).
Arara Abadi in Riau
A total area of 299 975 ha was conceded in 1996
to the plantation company Arara Abadi (AA)
in the province of Riau, though the Forestry
Division of the related pulp and paper mill
Indah Kiat made the fi rst plantations in 1984
with provisional permits from the GOI.
The concession areas are distributed
among seven districts, with about 72% of the
area allocated in the districts of Siak and
Pelalawan. The areas were covered by MHW
species with about 60% being swamp forests
with an average wood production of > 150 m
3
/
ha (AA personal communication).
The plantation company supplies the
related pulp mill’s demand, which has risen
from near 540 000 m
3
of pulpwood/year in 1984
to near 9 million m
3
/year in 2003.
From the total allocated area, some 28%
comprises crops, settlements and a conservation
zone, leaving about 216 000 ha feasible for
logging and conversion.
The maximum average area planted up
to 2003 was near 18 000 ha/year, with a total
area planted of about 228 000 ha (including
replanted areas).
The economic benefi t of the AA concession
project for the society for a total period of 55
years (1984-2038) at the year-0 (1984) value in
US dollars, corresponds to (see also Annex I.2):
12
Julia Maturana
= US$1,935,837,869
= US$793,918,705
= US$398,513,520
The economic costs at the three discount rates
are:
= US$3,169,867,526
= US$1,169,452,455
= US$533,947,366
The estimated benefi t-cost ratios for this
project are 0.61, 0.68 and 0.75, respectively.
Riau Andalan Pulp and Paper in Riau
A total area of 330 000 ha was allocated
in concession to the plantation company
associated with the Riau Andalan Pulp and Paper
Group (RAPP) pulp and paper mill in Riau.
The allocated areas are distributed among
five districts, with about 70% of the area
concentrated in the districts of Pelalawan and
Kuantan Singingi. The areas were covered by
MHW logged-over forests with about 70% of
those in swamp areas.
The company initiated its plantations in 1993
and began supplying pulpwood to the related pulp
and paper mill in 1995. The mill’s yearly demand
was about 3 million m
3
of pulp wood in 1995
increasing to 9 million m
3
in 2003.
A total area of about 251 000 ha could be
converted into raw material for the mill, while
nearly 79 000 ha (24% of the concession area)
comprises crops, settlements and conservation
area.
The maximum average area planted up to
2002 was near 14 000 ha/year, with a total area
planted of about 110 000 ha.
The economic benefits of the RAPP
concession project for the Indonesian society
(in US dollars), for a total period of 44 years
(1995-2038) calculated at the year 1984 value
(Annex I.3) are:
= US$ 1,336,119,511
= US$$ 556,385,589
= US$$ 269,709,028
The economic costs at the three discount rates
are:
The MHW logged-over forests allocated for HTI development were still rich in forest products. Here some villagers
are extracting logs for selling to the sawmills in Riau (Photo by Nicholas Hosgood)
13
Economic Costs and Benefi ts of Allocating Forest Land for Industrial Tree Plantation Development in Indonesia
= US$3,547,376,172
= US$1,222,022,515
= US$495,253,977
The estimated benefit-cost ratios for this
project are 0.38, 0.46 and 0.54, respectively.
Wira Karya Sakti in Jambi
The plantation company Wira Karya Sakti in
Jambi initiated its logging operations in 1989
through special permits for conversion of small
areas until 1996 when a formal concession
permit was obtained.
The fi nal land allocation was 203 449 ha
distributed among four districts, with over 60%
of the total area concentrated in the district of
Tanjung Jabung Barat. The areas were covered
by MHW logged-over forests with about 70% of
these being swamp forests.
Lontar Papyrus pulp and paper mill’s initial
demand was about 2 million m
3
of pulpwood
per year in 1994 and has increased to over
3 million m
3
in 2003.
A total area of nearly 161 000 ha is available
for conversion, while nearly 43 000 ha (21% of
the concession area) comprises settlements and
crops, and conservation areas.
The maximum average area planted from
1992 to 2003 was near 13 000 ha/year, with a
total area planted of about 96 000 ha.
The economic benefits of the WKS
concession project for the society for a total
period of 45 years (1994-2038) calculated at
the year 1984 value (in US$), correspond to
(Annex I.4):
= US$1,106,100,135
= US$426,455,511
= US$196,769,551
The economic costs at the three discount rates
are:
= US$2,257,196,475
= US$780,475,981
= US$319,480,269
Mixed hard wood logs extracted from swamp forests in Jambi (Photo by Julia Maturana)
14
Julia Maturana
The estimated benefi t-cost ratios for this
project are 0.49, 0.55 and 0.62, respectively.
Musi Hutan Persada in South Sumatra
The plantation company Musi Hutan Persada, in
South Sumatra, initiated its plantations in 1991
and obtained concession rights over a total area
of 296 400 ha in 1996.
The areas are distributed over fi ve districts,
with over 50% of the area concentrated in the
district of Muara Enim. The areas were covered
by nearly 50% of highly degraded forests
(belukar) and 50% grassland.
In 1999, the plantation company started to
supply the associated Tanjung Enim Lestari pulp
mill, which had a yearly requirement of near
2 million m
3
of pulp wood. Mill requirements
increased to reach 4.5 million m
3
of pulp wood/
year in 2003.
Nearly 32% of the concession comprises
crops, settlements and conservation areas.
From the remaining 68%, and taking in to
consideration the area of grassland, some
100 000 ha are considered feasible for logging
and conversion with a very low wood production
rate of 20.3 m
3
/ha. (This production rate was
calculated using the average standing volume
increment for Indonesian forests quoted by
Simangungsong (2003) and a period of 10
years.)
The average area planted is near 24 000 ha/
year, with a total area planted of 193 500 ha
from 1991 to 1998 (including replanted
areas).
The economic benefits of the MHP
concession project for the society (in US
dollars), for a total period of 41 years (1998-
2038) calculated at the year 1984 value
correspond to (Annex I.5):
= US$1,789,920,969
= US$594,828,448
= US$232,016,988
The economic costs at the three discount rates
are:
= US$770,295,134
= US$271,596,775
= US$112,471,049
The estimated benefi t-cost ratios for this
project correspond to 2.32, 2.19 and 2.06,
respectively.
Aggregated Economic Benefi ts and
Costs for the Country
The aggregated impacts for Indonesia for the
allocation of over 1.4 million ha of State land
to these fi ve plantation companies for the
production of pulpwood are negative (Table 1
and Fig. 6). The economic costs are much higher
than the related economic benefi ts.
The economic benefi ts of these projects,
related to the production of nearly 554 million m
3
of wood, valued at 1984 prices with the three
different discount rates (12%, 8% and 4% per year)
represent from US$1.2 billion to US$6.7 billion.
The economic costs associated with the
conversion of nearly 815 000 ha of logged-over
forests, pine and highly degraded forests, range
from US$1.7 billion to US$11.1 billion.
Table 1. Economic costs and benefi ts (US$ million) for each plantation company and aggregated
(stable scenario)
Disc. TPL AA RAPP WKS MHP Aggregated
EB EC EB EC EB EC EB EC EB EC EB EC EB/EC
12% 138 264 399 534 270 495 197 319 232 112 1,235.036 861 1,725.073 984 0.72
8% 242 557 794 1,169 556 1,222 426 780 595 272 2,613.214 717 4,000.668 752 0.65
4% 512 1,399 1,936 3,170 1,336 3,547 1,106 2,257 1,790 770 6,679.567 076 11,143.623 738 0.60
15
Economic Costs and Benefi ts of Allocating Forest Land for Industrial Tree Plantation Development in Indonesia
Natural forest area recently logged and planted with Acacia sp. in Sumatra (Photo by Julia Maturana)
Figure 6. (A) Pulpwood market, and (B) State forest land (hypothetical) market
Key: see Figures 2, 3, 4 and 5.
Notes: Pulpwood q
1
= q
0
+ 554 million m
3
.
State forest q
1
= q
0
+ 815 000 ha logged-over forest.
US$≈22
billion
US$40/m
3
US$8/m
3
US$≈39
billion
US$973/ha
US$500/ha
16
Julia Maturana
DISCUSSION
Economic Benefi ts
The economic benefi ts were calculated using
the volume of pulp wood (m
3
) produced per year
for the length of each of the concession periods.
This volume was calculated by adding the logged
(from the available resources) and harvested
(from the plantations) amounts of wood
available each year, taking into consideration
(for each specifi c area) the standing volume of
logged-over forests, the percentage of forested
area, the percentage of previously occupied
area, the mean annual increment (MAI), tree
mortality rates, conversion factors and mill
requirements.
The price used to value the pulpwood
corresponds to the market price for this
product when sold on the open market. It
was obtained from information of purchased
pulpwood in Sumatra from external sources (not
the integrated plantation companies). Rather
than making assumptions on the behaviour of
pulpwood prices in the future, a fi xed price of
US$40/m
3
was used to determine the economic
benefi ts for each year and each plantation
company. Depending on whether the real price
each year is higher or lower than the price used
here, it would increase or reduce the total
economic benefi ts of these projects for the
country. Maintaining a fi xed price is over- or
under-estimating the actual economic benefi ts,
but this has no relevance for the purpose of
comparing among the plantation companies.
Using the real market price, instead of
the price actually paid by the pulp mills to the
related plantation companies, captures the
economic value of this product for Indonesian
society and, therefore, it is the right price
to use for the economic valuation of these
resources. Using the ‘paid’ price would seriously
underestimate the benefi ts of these projects
for the country.
Discount rates of 4%, 8% and 12% were
used to calculate the year-0 values of the total
economic benefi ts of the projects. These rates
cover a range of rates used in former studies
(Shyamsundar and Kramer 1996; Kremen et
al. 2000; Ferraro 2002; Beukering et al. 2003;
Simangungsong 2003) looking at the valuation
of forest resources or areas in Indonesia and
other low-income nations
11
. Increments in the
discount rate (from 4% to 8% and 12%) reduce
the base-year value of the economic benefi ts
calculated.
Decreases in the MAI of the tree plantations
and tree survival factor (the percentage of
planted trees that survive to harvest) were
not considered for successive rotations; on the
contrary, the MAI used (companies’ information)
increases with the time to reach a maximum
expected MAI that remains constant until the
end of the total period in consideration. Given
the fact that it is very improbable that yields
will not decline during successive rotation
periods (SAM 2004), the economic benefi ts
calculated here may well be at the higher limit
or overestimated.
Additional benefits of these projects
related to the protection of conservation areas
within their concessions are not accounted
here. None of the fi ve plantation companies
acknowledged having taken any action to protect
the conservation areas from illegal logging or
other objective incursions; furthermore, some
of these plantation companies are accused by
NGOs and other observers of encouraging illegal
logging in these areas for their own benefi t.
The possible benefi ts of planting trees are
not accounted either. Most of the companies’
areas for developing tree plantations are
converted from natural forests, resulting
in associated economic benefits below the
economic costs of deforestation. On the other
hand, the conversion of grasslands into tree
plantations is not necessarily economically
benefi cial; grassland areas act as carbon sinks
and are also important for soil conservation—
both functions lost and damaged during the
process of plantation (WRM 2000, 2003; Cossalter
and Pye-Smith 2003). The rotation period of the
tree plantations under consideration is also too
short (7–8 years) to allow the capture of any of
the benefi ts related to tree establishment: no
fuel wood or NTFPs are available from these
plantations; the soil and water might be more
11
Discount rates used in the cited studies were: 3%, 5%, 6%, 7%, 8%, 10%, 15% and 20%.