Molecular identification of mango malformation pathogens in Egypt pot
Bạn đang xem bản rút gọn của tài liệu. Xem và tải ngay bản đầy đủ của tài liệu tại đây (484.89 KB, 7 trang )
Advances in Bioscience and Biotechnology, 2011, 2, 226-232
doi:10.4236/abb.2011.24033 Published Online August 2011 ( />ABB
).
Published Online August 2011 in SciRes. />Molecular identification of mango malformation pathogens in
Egypt
Wafaa Mohamed Haggag
1*
, Mahmoud Hazza
2
, Mahmoud Saker
3
, Mohamed Abd El-Wahab
1
1
Department of Plant Pathology National Research Center, Cairo, Egypt;
2
Science Faculty, Botany Department, Banha University, Banha, Egypt;
3
Department of Plant Biotechnology, National Research Center, Cairo, Egypt.
Email:
*
Received 16 February 2011; revised 21 May 2011; accepted 7 June 2011.
ABSTRACT
Diagnostic tests by molecular biology is made for
studying the relations among Fusarium species for
linking production of proteins, degree of relationship
and occurrence of malformation. Determination of
proteins for isolates causing-disease by SDS-PAGE
explained there’s specific band for each fungus and
there are common bands among some isolates of
fungi. Since, band with MW 30 KDa represented only
in F. proliferatum and F. oxysporum and F. subgluti-
nans respectively. This band considered as specific
band for these isolates, which released high patho-
genisity effect. RAPD-PCR markers were used to
discriminate variations between Fusarium isolates
and causing disease. There is specific band for each
fungus which act as molecular marker for each fun-
gus and there are some bands common among some
isolates of pathogenic fungi. The dendrogram shows
there is degree of relationship between F. sterilihy-
phosum and F. proliferatum; between F. moniliforme
and F. subglutinans; between F. oxysporum and F.
chlamydospore; the degree of relationship among F.
subglutinans, F. proliferatum and F. sterilihyphosum
and degree of relationship among F. moniliforme, F.
sterilihyphosum, F. proliferatum and F. subglutinans
Keywords:
Fusarium Spp.; Mango Malformation
1. INTRODUCTION
Mango (Mangifera indica L.) is the most important fruit
grown in tropical and subtropical region of the world.
Mango is the most important fruit crop in Egypt. Mango
malformation is one of the most destructive mango dis-
eases [1]. Losses due to malformation have not been
accurately assessed because yield loss is not a linear
function of disease severity [2]. A number of Fusarium
species has been reported to be associated with the mal-
formation disease of mango [3]. Some Fusarium species
especially those insection Liseola and their allied, identi-
fication process based solely on morphological charac-
teristics are not always convincing and still incomplete
and inconclusive. Therefore, molecular characterization
can be used as additional criteria for species characteri-
zation and identification. Genetic diversity was exam-
ined among 74 F. subglutinans—like isolates from mal-
formed mango in Brazil, Egypt, Florida (USA), India,
Israel and South Africa. With nitrate-non-utilizing (nit)
auxotrophic mutants, seven vegetative compatibility groups
(VCGs) were identified. Three of the VCGs were found
in a single country, and VCG diversity was greatest in
Egypt and the USA where, respectively, four and three
different VCGs were found. RAPD profiles generated
with arbitrary decamer primers were variable among iso-
lates in different VCGs, but were generally uniform for
isolates within a VCG. In PCR assays, a 20-mer primer
pair that was developed previously to identify F. subglu-
tinans from maize (mating population (MP-E) of the
Gibberella fujikuroi complex) also amplified a specific
448 bp fragment for isolates of F. sacchari from sugar-
cane (MP-B) and what was probably F. circinatum (pine,
MP-H). With the exception of three isolates from Brazil,
it did not amplify the fragment from F. subglutinans—
like isolates from mango. A second pair of 20-mer prim-
ers was developed from a unique fragment in the RAPD
assays. It amplified a specific 608 bp fragment for 51 of
54 isolates from mango (all but the three Brazilian iso-
lates). It also amplified a smaller, 550 bp fragment from
isolates of F. n y g a mai (MP-G), but did not amplify DNA
of isolates of any other toxin of Fusarium that was tested
[4].
A wild-type isolate of F. subglutinans causing mango
malformation disease was transformed with the GUS (B
glucuronidase) reporter and hygromycin resistance genes.
Five stable transformants were isolated containing vary-
ing copy numbers at different integration sites. Specific
W. M. Haggag et al. / Advances in Bioscience and Biotechnology 2 (2011) 226-232
227
GUS activity was quantified for the transformants, whereas
no activity was recorded for the wildtype isolate. The
transformants and the wild-type isolate were inoculated
into healthy mango floral and vegetative buds. Typical
symptoms of misshapen shoots with short internodes,
stub by leaves, and bunchy, malformed inflorescences
were observed 6 to 8 weeks following inoculation. The
presence of GUS—stained mycelium of the pathogen
viewed microscopically within infected plant organs pro-
vided unequivocal evidence that F. subglutinans is in-
deed a causal agent of mango malformation disease [5].
According to PCR—specific primer amplification, the
pathogen was detected in 97% of seedling apical meris-
tems, declining gradually to 5% colonization in roots. It
was concluded that inoculum of the pathogen originates
from infected panicles and affects seedlings from the
meristem, with infections descending to lower stem sec-
tions and roots. Minor infections of roots may occur
from inoculum originating from infected panicles, but
the pathogen is not seed borne [6]. In order to character-
ize molecularly the etiological agent of mango floral and
vegetative malformation in Brazil AFLPs, sequence analy-
sis and assays were used. The AFLP patterns of the ma-
jority of isolates collected in Brazil were different from
Fusarium mangiferae and Fusarium sterilihyphosum,
two previously described Fusarium species associated
with mango malformation. The cluster analysis of AFLP
data using Dice coefficient produced a network where
Fusarium spp. from Brazil were in one group apart from
two other groups represented by isolates of F. sterilihy-
phosum from Brazil and South Africa, and by isolates of
F. mangiferae from Egypt, India, South Africa and USA,
respectively. Fusarium spp. from Brazil was compared
with 24 species of the Gibberella fujikuroi complex
(GFC) using AFLP data and showed to be a distinctive
species. Sequence analyses of portions of amp; #946—
tubulin and EF-1amp and #945; were used to elucidate
the phylogenetic relationships between Fusarium spp.
from Brazil and the species of the GFC. Maximum par-
simony analyses grouped this Fusarium spp. in the
American clade, but within a distinct subgroup which
indicates a different species close related to F. sterilihy-
phosum. These species are not easily separated when
only morphological characters are used, but can be dis-
tinguished through AFLP patterns, fertility and sequence
analyses [3].
Thus, objective of the present study is to molecular
characterization of Fusarium spp. to identify the mango
malformation pathogens in Egypt
2. MATERIALS AND METHODS
Seven Fusarium specie i.e. F. oxysporium, F. prolifera-
tum, F. subglutinans, F. sterilihyphosium, F. monilifrme
and F. Avenaceum isolated from malformed mango
blossom tissue were tested for their ability to cause mal-
formation. Mango seedling cv. Sedekia (two years old)
was inoculated with 10
5
colony forming units of Fusa-
rium spp. as inoculated soil. Four replications of six
seedlings each were evaluated. Sterilized water was used
as a control. Transplanted seedlings were monitored for
development of malformation. At the end of the experi-
ment (120 days), all surviving seedlings were examined
for apical disease symptoms. Data were recorded on
symptoms manifestation as diseases incidence and se-
verity. The isolates were cultured on PDA overlaid with
four pieces of sterile-osmosis membrane for seven days
under the standard growth conditions. Approximately
100 mg of mycelium were used for protein and DNA
extractions
2.1. SDS-PAGE Analysis of Total Protein
Protein extraction: protein was extracted from Fusarium
isolates according to Reuveni, et al. [7] with some modi-
fied. Harvest and rapidly wash the cell once with 0.1 M
NaCl, then resuspended the cell pellet with lyses solu-
tion, which included of 100 mM Tris-HCL (PH 8.0), 5%
(vol/vol) glycerol, 2 mM EDTA, 2% SDS, 5% sucrose.
Then place the tube on ice for 3 min. and rapidly in wa-
ter bath at 100˚C for 3 min. repeated that tree times.
Examine the suspension by microscopy to accretion that
breakage has occurred. If not, quickly freeze and boil the
sample again. Centrifuge at high speed under cooling.
Remove the supernatant to another tube.
2.1.1. Gel Preparation
Sodium dodocylsulphate polyacrylamide gel electropho-
resis (SDS-PAGE) was performed using 12.5% acryla-
mide and 8% bis acrylamide running gel (65 mm
× 70
mm) consisting of 0.375 M Tris-HCl (pH 8.8) and 0.1%
SDS. Stacking gels (10 mm) were made using 4.5%
acrylamide containing 8% bis-acrylamide in 0.125 M
Tris-HCl (pH 6.8) and 0.1% SDS. The electrophoresis
buffer contained 0.025 M Tris-HCl, 0.19 glycine and
0.1% SDS. The samples were homogenized in 0.12 M
Tris-HCl (pH 6.8), 0.4% SDS, 10% β-merkaptoethanol,
0.02% bromophenol blue, and 20% glycerol. The sam-
ples were then heated for 3 min. in a boiling water bath
before centrifugation. The gels were run under cooling at
90 V for the first 15 min, then 120 V for the next 0.5 h.
and finally 150 V for the remaining 1.5 h.
2.1.2. Sample Loading
A volume of 15 µl protein sample was applied to each
well by micropipette. Control wells were loaded with
standard protein marker.
2.1.3. Electrophoresis Conditions
Four liters of running buffer were poured into the run-
ning tank to be pre-cooled (4˚C). Eight hundred ml of
running buffer was added in the upper tank just before
C
opyright © 2011 SciRes. ABB
W. M. Haggag et al. / Advances in Bioscience and Biotechnology 2 (2011) 226-232
228
running so that the gels were completely covered. The
electrodes were connected to power supply and adjust at
100 V until the bromophenol blue dye entered the re-
solving gel, and then increased to 250 V until the bro-
mophenol blue dye reached the bottom of the resolving
gel. The small triangle of one corner gel was marked so
the orientation is not during staining.
2.1.4. Gel Staining and Destaining
After the completed of the run, gel was placed in stain-
ing solution consisting of (1 g Coomassie Brillint blue-
R-250; 455 ml Methanol; 90 ml Acetic acid glacial and
up to 1 L with D.D.W.), and detained with 200 ml de-
staining solution and agitated gently on shaker. The dis-
taining solution was changed several times until the gel
background was clear.
2.1.5. Gel Analysis
Gels were photographed using a Bio-Rad gel documen-
tation system. Data analysis was obtained by Bio-Rad
Quantity one software version 4.0.3.
2.1.6. Native Gel Preparation
The methods described by Stegemann et al. [8] 30%
Acrylamide: 29.2 g Acrylamide, 0.8 g N,N-methylene
bisacrylamide were dissolved 100 ml H
2
O (dd.). 2%
ammonium persulphate: 0.25 g ammonium persulphate
was dissolved with 10 ml H
2
O (dd.). This stock must be
prepared immediately before use. Buffer solution: this
Borate buffer (pH 8.9) was used for Isozymes analysis.
The stock solution was composed of 605 g tris and 46 g
boric acid dissolved in 5000 ml H
2
O (dd.). Electrode
buffer: (0.125 M, pH 8.9) was prepared by dilution of
300 ml of the stock solution with 2100 ml H
2
O (dd.).
2.1.7. Gel Preparation
35 ml of 30% Acrylamide was added with 70 ml (0.125
M, pH 8.5) dilute buffer to get 8% Acrylamide, 33 mg
sodium sulphate (dissolve completely) 66 ml TEMED
(teteramethylenediamine) and 2.5 ml ammonium persul-
phate the gel solution was quickly poured immediately
and 15 well combs were used, then gels were left for
about 30 minutes for polymerization
2.2. Molecular Genetic Study (RAPD-PCR)
A-DNA Extraction
DNA isolation was performed using the CTAB method
of Doyle and Doyle [9]. 0.5 g fresh sample from Sesamum
indicum was ground to powder in liquid nitrogen with a
prechilled pestle and mortar, suspended in 1 ml pre-
heated CTAB buffer, and incubated at 65˚C for 1 h with
occasional shaking then centrifuge for 10 min at 1000
rpm. Transfer the supernatant to a new tube by wide pore,
add 0.5 ml of (chloroform: isoamylol) 24:1 then centri-
fuge for 15 minutes at 14,000 rpm and the aqueous layer
was transferred to a new sterilized tube (avoid protein
surface). The ice cold isopropanol was added to precipi-
tate the nucleic acid (RNA, DNA) then Incubate at
−20˚C overnight and centrifugation was happened at
14,000 rpm for 20 minutes. The supernatant was discard
and the pellet was washed carefully twice with cold 70%
ethanol, dried at room temperature and resuspend in 100
µl of sterile deionized distilled water. DNA concentra-
tion was determined by electrophoresis of 5 µl of DNA
with 2 µl of loading buffer and run at 100 V for ap-
proximately 30 minutes.
2.3. B-RAPD Analysis
RAPD was performed as described by Williams et al.
[10] with minor modifications. Briefly, PCR amplifica-
tion was performed in 25 µl reaction mix (Tables 1-3)
containing 20.40 ng genomic DNA, 0.5 unit Taq poly-
merase (Sigma), 0.2 mM each of dATP, dCTP, dGTP and
dTTP, 5 Pico mole random primer and appropriate am-
plification buffer. The reaction was assembled on ice,
overlaid with a drop of mineral oil. Amplification was
performed for 45 cycles (Table 2) using Biometera Uno
thermal cycler, as follows: One cycle at 95˚C for 3 min-
utes and then 44 cycles at 92˚C for 2 minutes, 37˚C for 1
minute and 72˚C for 2 minutes (for denaturation, an-
nealing and extension, respectively). Reaction was fi-
nally incubated at 72˚C for 10 minutes and further incu-
bated on 4˚C .Five primers were used for RAPD analysis
based on their ability to amplify Amaransis genome and
producing reproducible amplification patterns (Table 4).
2.4. C-Agarose Electrophoresis
The amplification products were analyzed by electro-
phoresis in 2% agarose in TAE buffer stained with 0.2
µg/ml ethidium bromide and photographed under UV
light. The buffer was added to the agarose then heated in
a microwave tell melting, cooling to 60˚C then the ethi-
a microwave tell melting, cooling to 60˚C then the ethi-
dium bromide was added. Sample was prepared by using
Table 1. Components of RAPD-PCR mixture.
Reagent Concentration Volume
d NTP
S
0.2 mM 2.5 µl
PCR buffer 10× 5 µl
Ampli Taq polymerase (RTS Taq DNA
polymerase).
2 Units 0.25 µl
MgCl
2
1.5 µl
Primer 5 p mole 3 µl
Distilled sterile water - 9.75 µl
Total genomic DNA 20.40 ng 3 µl
Total volume
-
25 µl
C
opyright © 2011 SciRes. ABB
W. M. Haggag et al. / Advances in Bioscience and Biotechnology 2 (2011) 226-232
229
Table 2. PCR program (temperature profile).
Order Action Temperature Duration No. of cycles
1
2
3
4
5
6
1stDenaturation
Denaturation
Annealing
Extension
Last extension
Incubation
95˚C
92˚C
37˚C
72˚C
72˚C
4˚C
3 minutes
2 minutes
1 minutes
2 minutes
10 minutes
1 cycle
44 cycles
1 cycle
Table 3. Composition of stocks.
Stock Composition
CTAB
1.4 M Nacl, 0.2% β-mercaptoethanol, 100 mM
Tris-HCl and 20 mM EDTA
50× Tris-Acetate
Buffer
242 g Tris-base, 57.1 ml Glacial acetic acid and
100 ml EDTA (0.5 M, pH 8.0)
Loading buffer
0.25 g bromophenol blue and 100 ml Glycerol
(30%)
Ethidium bromide 0.2 µg/ml ethidium
Table 4. Name and sequences of the selected random primers
used in RAPD-PCR analysis and make amplification.
Primer code Nucleotide sequences (5 - 3)
1- A1
2- A3
3- A4
4- B1
5- B4
6- G2
7- Z1
8- G3
9- Z3
10- A2
CAGGCCCTTC
AGTCAGCCAC
AATCGGGCTG
GTTTCGCTCC
GGACTGGAGT
GGCACTGAGG
TCTGTGCCAC
GAGCCCTCCA
CAGCACCGCA
TGCCGAGCTG
Name of primers that did not make amplification G2, B4, B1, A1, A4.
10 µl PCR-product and 2 µl loading buffer. One marker
was used, 100 bp DNA ladder (Axygen).
3. RESULTS AND DISCUSSION
Seven fungi viz. F. subglutinans, F. oxyspoum, F. sterili-
hyphosum, F. proliferatum, F. moniliforme, F.avena and
F. chlamydspore isolated from mango malformed tissue
were tested using susceptible Sadekia cultivar as inocu-
lated soil (Table 5). Data pertaining to artificial inocula-
tions revealed that effort to produce disease by soil in-
oculation with spores suspension. Four Fusarium sub-
glutinans proved to be the dominant fungus with 100%
sample’s infection in inoculated soil. Fungi F. o x -
ysporum, F. sterilihyphosum and F. proliferatum showed
moderate infection in induced typical malformation
symptoms in inoculated mango seedling and were re-
isolated . Other Fusarium spp. give grown and root rots
symptoms.
3.1. Molecular Characterization of Fusarium
Isolates
Molecular characterization of the eight Fusarium iso-
lates was carried out using sodium dodocyle sulphate
Table 5. Comparative virulence of selected Fusarium isolates
on inoculated mango cv. Sedekia seedlings.
Infested soil with spore suspension
Tested isolates
Disease incidence % Disease severity
F. subglutinans
100.0 a 4.0 a
F. oxyspoum
50.0 b 1.3 c
F. sterilihyphosum
50.0 b 2.3 b
F. solani
0.0 c 0.0 d
F. avenaceum
0.0 c 0.0 d
F. chlamydspore
0.0 c 0.0 d
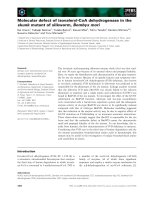
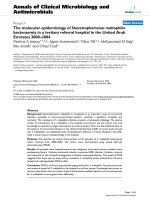
Figure 1. SDS-PAGE of total proteins extracted from eight
Fusarium isolates (1 = F. proliferatum, 2 = F. oxysporum, 3 =
F. so l ani , 4 = F. chlamydsporium, 5 = F. moniliforme, 6 = F.
sterilihyphosum, 7 = F. avenaceum, 8 = F. subglutinans, M
refers to protein stander).
polyacrylamide gel electrophoresis (SDS-PAGE) analysis.
3.2. SDS-PAGE Analysis of Total Protein
Total proteins were separated by SDS-PAGE. Figure 1
shows the electrophoretic pattern of Fusarium isolates.
The maximum number of the bands was twenty-six, as
shown in Table 6. The molecular weight of the bands
obtained with SDS-PAGE ranged from 14 to 215 KDa.
Most band are considered as common band exept bands
with molecular weight (MW) 215 and 210 KDa which
represented only in three isolates , F. chlamydsporium, F.
moniliforme and F. sterilihyphosum respectively. As they
appeared only in two isolates F.proliferatum and F. o x -
ysporum respectively bands with MW 100, 88, 50, 30
and 20. These bands are not found in the rest of isolates
and considered as potential marker associated with the-
ses isolates and their pathogenisty. While band with MW
30 KDa represented only in F. proliferatum, F. oxysporum
and F. subglutinans respectively. This band considered
as specific band for these isolates, which released high
pathogenisity effect.
C
opyright © 2011 SciRes. ABB
W. M. Haggag et al. / Advances in Bioscience and Biotechnology 2 (2011) 226-232
230
Table 6. SDS-PAGE protein banding pattern extracted from
eight Fusarium isolates.
No. MW 1 2 3 4 5 6 7 8
1 215 – – –
+ + +
– –
2 210 – – –
+ + +
– –
3 205 + + + + + + + +
4 200 –
+ +
– – – – –
5 116 + + + + + + + +
6 115 – – + + + + + +
7 110 + + + – – – – –
8 100
+ +
– – – – – –
9 97 + + + + + + + +
10 88
+ +
– – – – – –
11 80 + + + + + + + +
12 75 + + + + + + + +
13 66 + + + + + + + +
14 60 + + – + + + + +
15 55 + +
+ + + + + +
16 50
+ +
– – – – – –
17 45 – – + + + + + +
18 40 – – + + + + + +
19 35
+ +
– – – – –
+
20 30
+ +
– – – – – –
21 29 + + + + + + + +
22 26 + + + + + + + +
23 25 – – + + + + + +
24 20
+ +
– – – – – –
25 16 – – –
+
–
+
– –
26
14 + + + + + + + +
MW = Molecular weight; + = Presence of band.; – = Absence of band.
From 1 = F. proliferatum, 2 = F. oxysporum, 3 = F. solani, 4 = F. c hl a-
mydsporium, 5 = F. moniliforme, 6 = F. sterilihyphosum, 7 = F. avenaceum,
8 = F. subglutinans, respectively.
3.3. Molecular Genetic Study (RAPD-PCR)
In the present study RAPD-PCR markers were used to
discriminate variations between Fusarium isolates. RAPD
would be the markers of choice, since it offers the ad-
vantages of being technically undemanding, use no ra-
dioactivity or polyacrylamide. Furthermore, RAPD-mark-
ers tend to reside in regions with many repeated se-
quences and their fore in non coding regions, which are
more susceptible to mutations. Consequently, they usu-
ally reveal more polymorphism compared with isozymes or
RFLPs, which are mostly representative of conserved
genome regions [10]
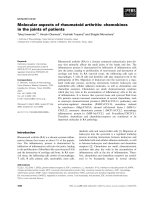
3.4. RAPD-PCR Using G3 Primer
The results of RAPD analysis using primer G3 are illus-
trated in Figure 2 and Table 7 for all Fusarium isolates.
The maximum number of bands by this primer was nine.
The molecular weight of the PCR products generated by
this primer ranged from 90 to 950 base paires (bp). Only
band with MW 600 bp could be considered as common
band. Bands with MW 950, 870 and 350 bp are consid-
ered as specific bands or positive markers of Fusarium
isolates i.e. F. oxysporum, F.subglutinans. While the
Figure 2. DNA polymorphesim based on RAPD-PCR analysis
of the seven Fusarium isolates against the primer G3 (1 = F.
proliferatum, 2 = F. oxysporum, 3 = F. subglutinans, 4 = F.
chlamydsporium, 5 = F. moniliforme, 6 = F. sterilihyphosum, 7
= F. avenaceum, M refers to ladder DNA stander marker).
Table 7. RAPD profiles of the Fusarium isolates using primer
G3.
No. MW 1 2 3 4 5 6 7
1 950 – + +
– – –
–
2 870 – + +
+ – –
–
3 750 – + + + – – –
4 600 –
+ +
+ + + +
5 550 – + + – + – –
6 350 – + + – – – –
7 250 – + + – + + +
8 150
– +
+ + + – –
9
90 – – – –
+
– –
MW = Molecular weight; + = Presence of band.; – =Absence of band. From
1 to 7 = F. proliferatum, F. oxysporum, F. subglutinans, F. chlamydsporium,
F. moniliforme, F. sterilihyphosum, F. avenaceum respectively.
band with MW 90 bp could be considered as specific
marker for F. moniliforme. The disappearance of the
band with MW 250 bp could considered as negative
marker to F. chlamydsporium.
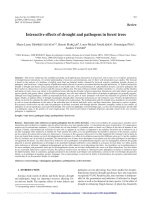
3.5. RAPD-PCR Using Z3 Primer
The results of RAPD analysis using primer Z3 are illus-
trated in Figure 3 and Table 8 for all Fusarium isolates.
The maximum number of bands by this primer was eight.
The molecular weight of the PCR products generated by
this primer ranged from 100 to 800 base paires (bp).
Only band with MW 500 bp could be considered as
common band. Bands with MW 800 and 700 bp are con-
sidered as specific bands or positive markers of Fusa-
rium isolates i.e. F. oxysporum and F. subglutinans.
While the band with MW 100 bp could be considered as
specific marker for F. proliferatum and F. moniliforme.
The disappearance of the band with MW 200 and 300 bp
could consider as negative marker to F. avenaceum.
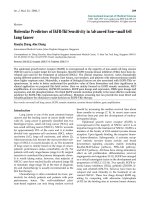
3.6. RAPD-PCR Using A2 Primer
The results of RAPD analysis using primer A2 are illus-
C
opyright © 2011 SciRes. ABB
W. M. Haggag et al. / Advances in Bioscience and Biotechnology 2 (2011) 226-232
231
Figure 3. DNA polymorphesim based on RAPD-PCR analysis
of the seven Fusarium isolates against the primer Z3 (1 = F.
proliferatum, 2 = F. oxysporum, 3 = F. subglutinans, 4 = F.
chlamydsporium, 5 = F. moniliforme, 6 = F. sterilihyphosum, 7
= F. avenaceum, M refers to ladder DNA stander marker).
Table 8. RAPD profiles of the Fusarium isolates using primer
Z3.
No. MW 1 2 3 4 5 6 7
1 800 – + +
– – –
–
2 700 – + + – – – –
3 600 –
+ +
– + – +
4 500 + + + + + + +
5 400 – + + + + + +
6 300 + + + + + + –
7 200
+ +
+ + + + –
8
100 + – – –
+
– –
MW = Molecular weight; + = Presence of band.; – =Absence of band. From
1 to 7 = F. proliferatum, 2 = F. oxysporum, 3 = F. subglutinans, 4 = F. ch l a-
mydsporium, 5 = F.moniliforme, 6 = F.sterilihyphosum, 7 = F. avenaceum,
respectively.
trated in Figure 4 and Table 9 for all Fusarium isolates.
The maximum number of bands by this primer was nine.
The molecular weight of three PCR products generated
by this primer ranged from 100 to 900 base paires (bp).
Band with MW 800 bp is considered as specific bands or
positive marker of F. subglutinans. While the band with
MW 600 and 400 bp could be considered as specific
markers for F. oxysporum. Bands with MW 700 and 200
bp are considered as specific bands or positive marker of
F. moniliforme and F. proliferatum. The disappearance of
the band with MW 250 bp could considered as negative
marker to F. chlamydsporium.
3.7. The Relationship between Fusarium Isolates
The dendrogram shows in Figure 5, there is degree of
relationship between F. sterilihyphosum and F. prolif-
eratum; between F. moniliforme and F. subglutinans;
between F. oxysporum and F. c h l amydosp o re; the degree
of relationship among, F. proliferatum and F. sterilihy-
phosum and degree of relationship among F. monili-
forme, F. sterilihyphosum, F. proliferatum and F. subglu-
tinans. These species are not easily separated when only
Figure 4. DNA polymorphesim based on RAPD-PCR analysis
of the seven Fusarium isolates against the primer A2 (1 = F.
proliferatum, 2 = F. oxysporum, 3 = F. subglutinans, 4 = F.
chlamydsporium, 5 = F. moniliforme, 6 = F. sterilihyphosum, 7
= F. avenaceum, M refers to ladder DNA stander marker).
Table 9. RAPD profiles of the Fusarium isolates using primer
A2.
No. MW 1 2 3 4 5 6 7
1 900 – – –
– – +
–
2 800 – – + – – – –
3 700 +
– –
– + – –
4 600 – + – – – – –
5 500 – + – + – – +
6 400 – + – – – – –
7 300
+ +
– – – + –
8 200 + – – –
+
– –
9
100 – + – –
–
– +
MW = Molecular weight; + = Presence of band.; – =Absence of band. From
1 to 7 = F. proliferatum, 2 = F. oxysporum, 3 = F. subglutinans, 4 = F. ch l a-
mydsporium, 5 = F. moniliforme, 6 = F. sterilihyphosum, 7 = F. avenaceum,
respectively.
morphological characters are used. Therefore, molecular
characterization can be used as additional criteria for
species characterization and identification. In order to
identify and characterize molecularly the etiological
agent of mango floral and vegetative malformation, SDS-
PAGE of total proteins and RAPD-PCR assays were used.
The RAPD-PCR technique has been used successfully
by the Tree Pathology. SDS-PAGE of total proteins of
portions and RAPD-PCR were used to elucidate the
phylogenetic relationships between Fusarium species
[4,11,12]. In many ways, molecular approaches are more
easier and can provide results that are less ambiguous
and the most important criteria is the same observations
can be made between different researchers, as compared
to morphological approach.
RAPD banding patterns showed similarity and varia-
tions between the seven Fusarium species isolated from
mango infected plants. Since, relationship between F.
sterilihyphosum and F. proliferatum; between F. monili-
forme and F. subglutinans; between F.oxysporum and F.
chlamydospore; the degree of relationship among, F.
C
opyright © 2011 SciRes. ABB
W. M. Haggag et al. / Advances in Bioscience and Biotechnology 2 (2011) 226-232
Copyright © 2011 SciRes.
232
[2] Kumar
, J. and Beniwal, S.P. (1987) A method of estimat-
ing cultivar susceptibility against mango malformation.
Tropical Pest Management, 33, 208-210.
doi:10.1080/09670878709371151
[3] Lim
a, C.S., Pfenning, L.H., Costa, S.S., Campos, M.A.
and Leslie, J.F. (2009) A new Fusarium lineage within
the Gibberella fujikuroi species complex is the main
causal agent of mango malformation disease in Brazil.
Plant Pathology, 58, 33-42.
doi:10.1111/j.1365-3059.2008.01946.x
[4] Zheng, Q. and Ploetz, R. (2002) Genetic diversity in, and
development of a PCR assay for identifying, the mango
malformation pathogen. Plant Pathology, 51, 208-216.
doi:10.1046/j.1365-3059.2002.00677.x
[5] Freeman, S., Maimon, M. and Pinkas, Y. (1999) Use of
GUS transformants of Fusarium subglutinans for deter-
mining etiology of mango malformation disease. Phyto-
pathology, 89, 456-461.
doi:10.1094/PHYTO.1999.89.6.456
[6] Youssef, S. A., Maymon, M., Zveibil, A., Klein-Gueta,
D., Sztejnberg, A., Shalaby, A.A. and Freeman, S. (2007)
Epidemiological aspects of mango malformation disease
caused by Fusarium mangiferae and source of infection
in seedlings cultivated in orchards in Egypt. Plant Pa-
thology, 56, 257-263.
doi:10.1111/j.1365-3059.2006.0
1548.x
Figure 5. The dendrogram that release the relation ship between
the seven Fusarium isolates.
[7] Reuveni, R., Shimoni, M., Karchi, Z. and Kuc, J. (1992)
Peroxidase activity as a biochemical marker for resis-
tance of muskmelon on (Cucumis meb) to Pseudoper-
onospora cubensis. Phytopathology, 82, 749-753.
doi:10.1094/Phyto-82-749
proliferatum and F. sterilihyphosum and degree of rela-
tionship among F. moniliforme, F. sterilihyphosum, F.
proliferatum and F. subglutinans were found. In addition,
these bands are not found in the rest of isolates and con-
sidered as potential marker associated with theses iso-
lates and their pathogenisty.
[8] S
tegemann, H., Afify, A. and Hussein, K.R.F. (1985)
Cultivar Identification of dates (Phoenix dactylifera) by
protein patterns. 2nd International Symposium of Bio-
chemical Approaches to Identification of Cultivars, Braun-
schweing, 1985, 44.
Resu
lts of RAPD analysis can be used to differentiate
isolates of pathogenic Fusarium species of mango mal-
formation namely F. subglutinans, F. sterilihyphosum, F.
oxysporum and F. proliferatum. The Polymorphism of
RAPD profiles have also been observed in various iso-
lates of Fusarium species such as F. moniliforme, F. s u b -
glutinans, F. oxysporum and F. proliferatum [13,14].
[9] Doyle, J.J. and Doyle, J.L. (1990) Isolation of DNA from
fresh tissue. Focus, 12, 13-15.
[10] Williams, K., Kublik, A., Livak, K., Rafalski, J. and Tin-
gey, V. (1990) Useful as genetic markers. Nucleic Acids
Research, 18, 6531-6535. doi:10.1093/nar/18.22.6531
[11] Zaccaro, S., Alves C.L., Travensolo, F., Wickert, E. and
Lemos, M. (2007) Use of molecular marker SCAR in the
identification of Fusarium subglutinans, causal agent of
mango malformation. Revista Brasileira de Fruticultura,
29. doi: 10.1590/S0100-29452007000300029
4. ACKNOWLEDGEMENTS
This manuscript funded from the project “New applied approaches to
promote productivity and Quality of some fruit crops (Mango)” Na-
tional Research Centre, 2007 to 2010. Also, this paper publish from
Thesis under title of biological and molecular characterization for
controlling mango malformation disease. PI: Dr. Wafaa Haggag.
[12] Nur
, A., Izzati, M.Z. and Salleh, B. (2009) Genetic vari-
ability amongst Fusarium spp. in the section liseola from
bakanae-infected rice in Malaysia and indonesia by rapd
analysis. Malaysian Applied Biology, 38, 71-79.
[13] Vakalounakis, D., Wang, Z, Fragkiadakis, G., Skaracis, G.
and Li, D. (2004) Characterization of Fusarium ox-
ysporum isolates obtained from cucumber in China by
pathogenicity, VCG and RAPD. Plant Disease, 88, 645-
649. doi:10.1094/PDIS.2004.88.6.645
REFERENCES
[1] Ploetz, R.C. (2001) Malformation: A unique and impor-
tant disease of mango, Mangifera indica L. In: Sum-
merell, B.A., Leslie, J.F., Backhouse, D. and Bryden, W.
Eds., Fusarium: Paul E. Nelson Memorial Symposium,
American Phytopathological Society (APS) Press, St
Paul, 233-247.
[14] Zheng, Q.
and Ploetz, R. (2002) Genetic diversity in, and
development of a PCR assay for identifying, the mango
malformation pathogen. Plant Pathology, 51, 208-216.
doi:10.1046/j.1365-3059.2002.00677.x
ABB