Báo cáo Y học: Implications of the simultaneous occurrence of hepatic glycolysis from glucose and gluconeogenesis from glycerol pdf
Bạn đang xem bản rút gọn của tài liệu. Xem và tải ngay bản đầy đủ của tài liệu tại đây (136.36 KB, 6 trang )
Implications of the simultaneous occurrence of hepatic glycolysis
from glucose and gluconeogenesis from glycerol
John W. Phillips
1
, Michael E. Jones
2
and Michael N. Berry
3
Departments of
1
Medical Biochemistry,
2
Anatomy and Histology and
3
Human Physiology, School of Medicine,
The Flinders University of South Australia, Adelaide, South Australia, Australia
Glycolysis from [6-
3
H]glucose and gluconeogenesis from
[U-
14
C]glycerol were examined in isolated hepatocytes from
fasted rats. A 5 m
M
bolus of glycerol inhibited phosphory-
lation of 40 m
M
glucose by 50% and glycolysis by more than
60%, and caused cellular ATP depletion and glycerol
3-phosphate accumulation. Gluconeogenesis from 5 m
M
glycerol was unaected by the presence of 40 m
M
glucose.
When nonsatu rating concentrations of glycerol (< 200 l
M
)
were maintained in the medium b y infusion of glycerol,
cellular ATP concentrations remained normal. The rate of
uptake of i nfused glycerol was unaected by 40 m
M
glucose,
but carbohydrate synthesis from glycerol was i nhibited 25%,
a corresponding amount of glycerol being diverted to g ly-
colytic products, whereas 10 m
M
glucose had no inhibitory
eect on conversion of infused glycerol into carbohydrate.
Glycerol infusion depressed glycolysis from 10 m
M
and
40 m
M
glucose by 15 and 25%, respectively; however, the
overall rates of glycolysis were unch anged because o f a
concomitant in crease i n g lycolysis from the infused glycerol.
These s tudies show that exposure of hepatocytes to glucose
and l ow quasi-steady-state concentrations of glycerol result
in the simultaneous occurrence, at substantial rates, of
glycolysis from glucose and gluconeogenesis from the a dded
glycerol. We interpret our results as demonstrating that, in
hepatocytes from normal rats, segments of the pathways of
glycolysis from glucose and gluconeogenesis from glycerol
are compartmentalized and that this segregation prevents
substantial cross-over o f phosphorylated intermediates f rom
one pathway to the oth er. The c ompetition between glucose
and glycerol implies that glycolysis and phosphorylation of
glycerol take place in the same cells, a nd that the occurrence
of simultaneous glycolysis and g luconeogenesis may indicate
channelling within t he cytoplasm of individual hepatocytes.
Keywords: compartmentalization; gluconeogenesis; glycerol
metabolism; glycolysis; metabolic channelling.
The mammalian liver has the capability for both glycolysis
and gluconeogenesis. In the fed state , a major fate o f glucose
is glycolysis to py ruvate and l actate , which serve as
precursors for lipid synthesis. In the f asted animal, in which
hepatic lipogenesis is greatly diminished, metabolites such as
lactate and glycerol, generated in the p eripheral tissues, a re
taken u p by the liver and converted i nto glucose. However,
hepatocytes from fasted animals are also capable of
substantial rates of glycolysis [1,2]. It is generally assumed
that glycolysis and gluconeogenesis do not occur simulta-
neously in the same cell, but rather that metabolic condi-
tions or allosteric effectors that stimulate ¯ux along one
pathway depress ¯ow in the opposite direction. The actual
direction of ¯ow at any g iven moment is though t to be
determined by regulatory me chanisms that control ¯ux
through the enzymatic steps speci®c to g lycolysis and
gluconeogenesis [3±5]. Moreover, evidence b ased on enzyme
distribution i n the liver suggests that metabolic zonation
within the hepatic lobule exists, favouring gluconeogenesis
in the periportal region [6].
Glycerol is an important gluconeogenic substrate, es pe-
cially in the fasting state [7,8], and the bulk of t he glycerol
reaching the live r is converted into gluc ose [9]. The question
therefore arises as to the fate of glycerol when glycolysis is
induced in hepatocytes from fasting animals by a glucose
load [2]. In this paper we r eport that, when isolated
hepatocytes from fasted rats are incubated with glycerol and
glucose in combination, glycolysis from glucose, and
gluconeogenesis from glycerol, proceed simultaneously at
substantial rates. The implications of these ®ndings are
discussed.
MATERIALS AND METHODS
Materials
Collagenase and enzymes necessary for the assay of
metabolites were from Roche Diagnostics Australia (Castle
Hill, NSW, Australia) as was BSA (fraction V), which was
defatted as described b y Chen [10]. Inulin was obtained
from Sigma (St Louis, MO, USA) and inulinase (Novozym
230) was a gift from Novo Nordisk A/S (Bagsvaerd,
Denmark). All other chemicals were o f the highest purity
commercially available. HPLC-puri®ed [2-
3
H]glucose and
[6-
3
H]glucose were obtained f rom New England Nuclear
(Boston, MA, USA), and [U-
14
C]glycerol from Amersham
Correspondence to M. N. Berry, Department of Human Physiology,
School of Medicine, The Flinders University of South Australia,
GPO Box 2100, Adelaide, South A ustralia 5001, Australia.
Fax: + 61 8 82045768, Tel.: + 61 8 82044015,
E-mail: michael.berry@¯inders.edu.au
Abbreviations:Fru-2,6-P
2
, fructose 2,6-bisphosphate; Glc-6-P,glucose
6-phosphate; Gro-3-P, glycerol 3-phosphate; S
0.5
, substrate concen-
tration yielding half-maximal reaction r ate.
(Received 12 September 2001, revised 16 N ovember 2 001, accepted 19
November 2001)
Eur. J. Biochem. 269, 792±797 (2002) Ó FEBS 2002
Pharmacia Biotech (Castle Hill, NSW, Australia). Dowex
AG50-X8 (H
+
, 100±200 mesh) and Dowex AG1-X8 (Cl
±
,
100±200 mesh), for the separation of radiolabelled glucose
and its metabo lic products, were obtained from Bio-Rad
(Hercules, CA, USA).
Preparation and incubation of hepatocytes
Hepatocytes were prepared from male Hooded Wistar rats
(280±300 g body wt), starved for 24 h to deplete liver
glycogen, by a modi®cation [11] of the method of Berry &
Friend [12], in which 1 m
M
Ca
2+
was added to the washing
medium. The hepatocytes ( 100 mg wet wt) were i ncu-
bated a t 3 7 °C in 2 mL of a balanced bicarbonate±saline
containing 2.25% (w/v) albumin, with a gas phase of 95%
O
2
/5% CO
2
[13,14]. The incubation mixtures initially
contained 1 lCi [6-
3
H]glucose for determination of the rate
of glycolysis from glucose [2] and 1.0 lCi [2-
3
H]glucose for
determination of the rate of glucose phosphorylation [1].
For the measurement of glycerol metabolism, the i ncuba-
tion vessels were infused with 0.14
M
[U-
14
C]glycerol
(speci®c radioactivity 4 8 000 d.p.málmol
)1
)atarateof
0.138 0.006 lmolámin
)1
. In experiments in which CO
2
generation was m easured, duplicate incubations were car-
ried out in sealed vials; perchloric acid was injected through
the seal a t the end of the incubation period, and
14
CO
2
collected in phenylethylamin e (0.25 mL) [15].
In a number of experiments, w e e mployed 4 0 m
M
glucose
because the substrate concentration yielding half-maximal
reaction rate (S
0.5
) for glucokinase is more than doubled
in vitro [16]. We have previously observed that h epatocytes
exposed to this substrate concentration carry out glycolysis
at rates observed in vivo [3,15,17]. In other studies we used
10 m
M
glucose, together with trace amounts of fructose
generated from inulin by inulinase [18]. This constant
generation of fructose, which maintains a concentration of
70 l
M
in the medium, signi®cantly lowers the in vitro S
0.5
of
glucokinase for glucose [18], although not to the value seen
in vivo [16,19]. The metabolism of the fructose formed from
inulin did not contribute signi®cantly to glucose formation
[18]. To maintain nonsaturating concentrations of glycerol
in the incubation medium, we infused glycerol by means of a
high-precision infusion pump (Braun, Melsungen, Germa-
ny) adapted to hold an array of 24 1-mL tuberculin syringes
(Becton Dickinson, Singapore). To avoid signi®cant dilu-
tion of the incubation mixture, an infusion rate of
0.985 0.005 lLámin
)1
(n 20) was selected.
Analytical procedures
At the completion of the incubation period, a 0.5-mL sample
was deproteinated with 1.5 mL ice-cold ethanol for the
measurement of isotopic p roducts of glucose and glycerol
metabolism. Fructose 2,6-bisphosphate (Fru-2,6-P
2
)was
stabilized by mixing 0.3 mL of the contents of the incubation
vessel with 0.3 mL 0.1
M
NaOH and the mixture heated at
80 °C for 10 min [20]. S amples were st ored at 4 °C until
assayed. All extracts were d iluted 10-fold with 10 m
M
NaOH
before assay as d escribed by Van Schaftingen et al.[20].The
remaining portion of the incubation mixture was deprote-
inated with an equal v olume of ice-cold 1
M
perchloric
acid and neutralized before the metabolites were measured
by stan dard enzymatic techniques [21]. In con®rmatory
experiments, the isotopic prod ucts of glucose and glycerol
were also determined in the p erchloric acid-precipitated
neutralized medium, a nd results s imilar to those obtained
with ethanol deproteination were obtained. R adiolabelled
glucose and water were separated by ion-exchange chroma-
tography [22,23]. The radiolabelled products of glycerol
metabolism were also separated in this manner. The rate o f
glycolysis was d etermined from the sum o f tritium from
[6-
3
H]glucose recovered in water, lactate, pyruvate and
amino acids [1] and the rate o f glucose phosphorylation from
the sum of
3
H
2
O released from [2-
3
H]glucose plus the
amount of tritiated glycogen formed [1]. In experiments in
which 10 m
M
glucose was added, when the rates of glucose
metabolism were calculated, allowance w as made for t he
change in glucos e speci®c radioactivity over the course of
the incubation period [18]. Isotopic glycogen formation was
measured as previously described [1]. Determination of the
rate of glucose/glucose 6-phosphate (Glc-6-P) cycling w as
performed as d escribed previously [15]. To simplify balance
studies, the rates of glucose and glycerol metabolism are
expressed as lmol C
6
equivalentsámin
)1
á(g wet w eight)
)1
(mean SEM). Statistical analysis was carried out using
Student's t-test for unpaired data.
RESULTS
Effects of a bolus of glycerol on hepatic carbohydrate
metabolism
In initial studies, hepatocytes from fasted rats were
incubated with 40 m
M
[6-
3
H]glucose in the absence or
presence of a bolus of 5 m
M
[
14
C]glycerol. Under these
conditions, t here was no s igni®cant c hange i n t he rate of
gluconeogenesis from glycerol in the p resence of 40 m
M
glucose [0.65 0.02 to 0.60 0.03 lmolámin
)1
á(g wet
weight)
)1
; n 5], whereas the glycolytic rate from glucose
was inhibited by more than 60% [0.96 0.03 to
0.33 0.02 lmolámin
)1
á(g wet weight )
)1
(n 5, P <
0.001)] in the presence of glycerol. We also observed that, in
hepatocyte suspensions exposed to glycerol, added as a
bolus to achieve i nitial concentrations in the incubation
medium of 0.5±5.0 m
M
, there was an immediate rise in both
dihydroxyacetone phosphate and, in particular glycerol
3-phosphate (Gro-3-P), whereas ATP concentrations fell.
The extent of these changes and the rate of glycerol uptake
and glucose synthesis were dependent on the initial concen-
tration of added substrate and were maximal by 5 m
M
(Table 1). Closely similar changes were observed when
glycerol and glucose were added in combination. These
effects of glycerol are apparently a consequence of the
trapping of phosphate in phosphorylated intermediates and
are analogous to those brought about by exposure of
hepatocytes to high concentrations of fructose [24].
The g eneration of
3
H
2
Ofrom[2-
3
H]glucose p rovides a
good measure of the rate of hepatic phosphorylation of
glucose in vitro [2,25]. Incubation of hepatocytes with
[2-
3
H]glucose (Table 2) showed that glucokinase activity
was impaired by exposure of cells to a 5-m
M
bolus of
glycerol so that rates of glucose phosphorylation were
decreased by 47% (P < 0.001). Duplicate experiments in
which [6-
3
H]glucose was substituted for [2-
3
H]glucose were
carried out to measure the effects of g lycerol on glucose
cycling through Glc-6-P. Glycerol addition signi®can tly
Ó FEBS 2002 Simultaneous hepatic glycolysis and gluconeogenesis (Eur. J. Biochem. 269) 793
decreased the rate of glucose u tilization ( P < 0.001) and
lowered the rate of cycling through Glc-6-P by 25%
(P < 0.05) (Table 2). However, under these conditions the
proportion of glucose phosphorylated that was recycled
back to glucose was increased f rom 40 t o 60%. A s with
hepatocytes incubated in the absence of glucose (Table 1),
the b olus addition of 5 m
M
glycerol re sulted in an accumu-
lation of intrac ellular Gro-3-P and depletion of ATP; the
concentration of Fru-2,6-P
2
fell by over 90% (Table 2).
Effect of glycerol infusion on hepatic carbohydrate
metabolism
These initial studies indicated the desirability o f m aintaining
low c oncentrations of glycerol in the incubatio n medium.
Because t his substrate is rapidly metabolized by hepato-
cytes, this required continuous infusion of the substrate at a
nonsaturating rate. Preliminary experiments established
that, when glycerol was infused at a rate of
0.138 0.006 lmolámin
)1
(n 10), cellular ATP con-
centrations and near-maximal rates of glucose synthesis
were maintained (Table 3). Under t hese conditions, t here
was a near-stoichiometric conversion of glycerol into
glucose. Samples taken at 10-min intervals, over a period
of 1 h under these co nditions, showed that medium glycerol
concentrations did not rise above 200 l
M
and intracellular
Gro-3 -P was consistently less than 1.5 m
M
.Higherratesof
glycerol infusion resulted in the depletion of cellular A TP
and accumulation of Gro-3-P, but had little effect on the
rate of glucose synthesis.
These experiments on glucose±glycerol interactions were
repeated by incubating hepatocytes with 40 m
M
[6-
3
H]glu-
cose, together w ith infusion of [
14
C]glycerol. After an initial
incubation period of 10 min, during which metabolic
changes became linear, isotopic measurements taken over
the subsequent 50 min, revealed that more th an 90% of
infused [U-
14
C]glycerol was converted into glucose plus
glycogen. Lactate and CO
2
formation w ere m inimal, and no
pyruvate was detected (Table 4). The rate o f gluconeogen-
esis (glucose + glycogen) from [U-
14
C]glycerol, infused
when the incubation medium con tained 40 m
M
[6-
3
H]glu-
cose, was about 25% less than that observed with glycerol
alone (P < 0.01), a s measured b y incorporation of
[
14
C]glycerol into glucose + glycogen, and substantial
amounts of
14
C were now detected in the lactate, pyruvate
and CO
2
. Moreover, when glycerol was infused with glucose
present, glycolysis from glucose w as inhibited by about 25%
(P < 0.001), but the o verall rate of glycolysis was
unchanged (Table 4).
We also examined the effects of glycerol infusion on
carbohydrate metabolism when hepatocytes were incubated
with 10 m
M
[6-
3
H]glucose, inulin and inulinase (Fig. 1).
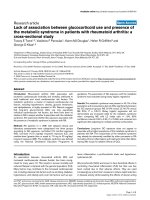
When glycerol was infused, glucose accumulated in the
medium at a rate of 0.25 0.03 lmolámin
)1
á(g wet
weight)
)1
(n 5) whereas, in the absence of glycerol
infusion, glucose was remov ed at 0.37 0.02 lmolá
min
)1
á(g wet weight)
)1
(n 5). Thus in the p resence o f
glycerol, there was an apparent net s ynthesis of glucose of
0.62 0.05 lmolámin
)1
á(g wet weight)
)1
. The rate of
glycogen synthesis of 0.13 0.01 lmolámin
)1
á(g wet
Table 1. Eect of initial g lycerol concentration on rates of glyc erol removal, glucose formation, and cellular concentrations of ATP, dihydroxyacetone
phosphate (DHAP) and G ro-3-P. Hepatocytes ( 100 m g wet wt) from fasted rats were incubated under standard conditions in the presence o f initial
glycerol concentrations of 0.5±5 m
M
. The cellular concentrations [lmolá(g wet w t)
±
1] of ATP, DHAP and Gro-3-P were measured at 5, 10 or 20 min
depending on the initial g lycerol concentration and correspond to the m aximum rate of glycerol r emoval for each initial glyc erol concentratio n.
Data are presented as the m ean SEM (n 5). Glyc erol uptake and glucose formation are expressed as lmol C
6
equivalentsámin
)1
á(g wet w t)
)1
.
[Glycerol]
(m
M
)
[DHAP] [Gro-3-P] [ATP]
Glycerol
uptake
Glucose
formation
0.5 0.09 0.01 2.25 0.09 2.14 0.14 0.56 0.04 041 0.11
1.0 0.13 0.01 3.93 0.14 1.71 0.06 0.78 0.07 053 0.02
2.0 0.20 0.01 7.09 0.24 1.29 0.08 0.80 0.02 072 0.02
3.0 0.24 0.02 7.89 0.46 1.24 0.05 0.92 0.01 076 0.02
4.0 0.24 0.02 7.87 0.39 0.98 0.04 1.02 0.03 085 0.03
5.0 0.28 0.02 8.44 0.38 0.80 0.03 0.98 0.03 087 0.04
Table 2. Eect of a bolus addition of glycerol on hepatic glucose metabolism. Hepatocytes (100 mg w et wt) fro m fasted rats were incubated under
standard condition s with 40 m
M
glucose in the absen ce and presence of 5 m
M
glycerol. The rates of glucose phosphorylation were measured as the
sum of
3
H
2
O r eleased from [2-
3
H]glucose plus the amount of tritiated glycogen formed. The rate of [6-
3
H]glucose utilization represents the sum of
tritium from [6-
3
H]glucose recovered in water, lactate, pyruvate, amin o acid s and gly cogen. T he rate o f Glc/Glc -6-P cycling was calculated from the
dierence between the rates of glucose phosphorylatio n and [6-
3
H]glucose utilization [expressed as lmol C
6
equivalentsámin
)1
á(g wet wt)
)1
]. The
cellular concentrations of ATP a nd Gro-3-P [expressed as lmolá(g wet wt)
)1
]andFru-2,6-P
2
[expressed a s nmolá(g wet wt)
)1
] w ere measured afte r
30 m in incubation. Data are presented as the mean SEM (n 5).
Treatment
Glucose
phosphorylation
[6-
3
H]Glucose
utilization
Glc/Glc-6-P
cycling
[ATP] [Gro-3-P] [F2,6-P]
40 m
M
Glucose 1.95 0.06 1.14 0.07 0.81 0.07 2.46 0.04 0.47 0.04 17.88 0.07
40 m
M
Glucose +
5m
M
glycerol
1.03 0.05
a
0.42 0.03
a
0.61 0.05
b
0.84 0.03
a
8.89 0.13
a
1.25 0.10
a
a,b
P < 0.001 and P < 0.01, respectively, for the eect of 5 m
M
glycerol addition.
794 J. W. Phillips et al.(Eur. J. Biochem. 269) Ó FEBS 2002
weight)
)1
(n 5) was un affected by the glycerol infusion.
The basis for the effects of g lycerol infusion is revealed by
the isotopic data (Table 4). These show that when glycerol
was i nfused into the medium, the rate o f glycolysis w as
reduced by 20% (P < 0.01) even though the rate of glucose
phosphorylation in the presence of glucose alone
[0.73 0.01 lmol C
6
equivalentsámin
)1
á(g wet weight)
)1
,
n 3] was not altered during the glycerol infusion
[0.70 0.02 lmol C
6
equivalentsámin
)1
á(g wet weight)
)1
,
n 3]. As gluconeogenesis from [U-
14
C]glycerol occurred
at a rate of 0.48 0.01 lmolámin
)1
á(g wet weight)
)1
(n 5), a net accumulation of carbohydrate took place.
As with the incubations containing 40 m
M
glucose
(Table 4), the overall rate o f glycolysis was not signi®cantly
changed. The infusion of glycerol into hepatocytes incubat-
ed with 10 m
M
and 4 0 m
M
glucose lowered the cellular
Fru-2,6-P
2
concentration b y 15% and 25%, respectively
(Table 4). This i s i n m arked c ontrast with the effect of a
bolus addition of 5 m
M
glycerol (Table 2) where a > 90%
reduction in Fru-2,6-P
2
was measured. It was noteworthy
that at both g lucose concentrations, the percentage fall in
cellular Fru-2,6-P
2
concentration resulting from glycerol
infusion was equivalent to the per centage decrease in the
rates o f glycolysis. The ® vefold rise in cellular Fru-2,6-P
2
concentration a ssociated with the a ddition of glucose t o
Table 3. Eect of glycerol metabolism o n hepatocytes from fasted rats. Hepatocytes from fasted rats were incubat ed either in the presence of an
initial glycerol concentration of 5 m
M
or under conditions where glycerol was infu sed at 0.138 0.006 lmolámin
)1
. The cellular concentrations of
ATP and Gro-3-P [lmolá(g wet wt
)1
)] and Fru-2,6-P
2
[nmolá(g wet wt
)1
)] were measured after 30 min incubation and the rates o f glucose fo rmation
and glycerol removal [lmol C
6
equivalentsámin
)1
á(g wet wt
)1
)] were determined between 10 and 30 min . Data are presented as the mean SEM
(n 5).
Treatment
Glucose
formation
Glycerol
utilization
[ATP] [Gro-3-P] [Fru-2,6-P]
Endogenous ± ± 2.12 0.04 0.29 0.02 0.58 0.03
Glycerol added at 5 m
M
0.87 0.03 0.98 0.03 0.80 0.03 8.44 0.38 0.45 0.04
Glycerol infused at
0.138 0.006 lmolámin
)1
0.59 0.02 0.68 0.01 2.24 0.13 1.47 0.11 2.54 0.14
Table 4. Metabolism of added glucose and infuse d glycerol separately and in c ombination. Hepatocytes from fasted rats were incubated with either
40 m
M
glucose or 10 m
M
glucose, together with 0.12% (w/v) inulin and 10 m U inulinase, for periods of up to 60 min in the presence and absence of
a glycerol infusion. Where indicated, glycerol was infused at 0.138 0.006 lmolámin
)1
(n 10). The rate of glycolysis from glucose was
measured with [6-
3
H]glucose an d d etermined from the sum of tritium r ecovered in water, lac tate, pyruvate and amino a cids. The rates o f g lycerol
conversion into glucose, g lycogen, lactate and pyruvate were determined by measuring incorporation of [
14
C]glycerol into these products. The rate
of glycolysis from glycerol was calculated from the sum of
14
C-labelled lactate, pyruvate and CO
2
. Metabolic rates are expressed as lmol C
6
equivalentsámin
)1
á(g wet wt
)1
). The cellular concentration of Fru-2,6- P
2
[nmolá(g wet wt)
)1
] was measured after 30 min incubation. Data are
presented as the mean SEM (n 5).
Treatments
Glucose
metabolism
(glycolysis)
Glycerol metabolism
[Fru-2,6-P]
Glucose
Glucose +
glycogen
Lactate +
pyruvate Glycolysis
Glycerol
utilization
40 m
M
Glucose 0.96 0.03 ±±±±±17.88 0.07
40 m
M
Glucose+
glycerol infusion
0.73 0.03
c
0.32 0.02
a
0.41 0.03
a
0.18 0.01
a
0.23 0.02
a
0.64 0.05 13.49 0.17
a,c
Glycerol infusion ± 0.48 0.01 0.55 0.02 0.02 0.01 0.03 0.01 0.58 0.03 2.52 0.14
10 m
M
Glucose 0.45 0.02 ±±±±±13.18 0.26
10 m
M
Glucose+
glycerol infusion
0.38 0.01
d
0.43 0.01
b
0.52 0.02 0.11 0.01
a
0.13 0.02
a
0.65 0.03 11.29 0.33
a,e
a,b
P < 0.001 and P < 0.05, respectively, for the eect of glucose on glycerol metabolism;
c
P < 0.001 for the eect of glycerol infusion on
40 m
M
glucose metabolism;
d,e
P < 0.01 and P < 0.001, respectively, for the eect of glycerol infusion on 10 m
M
glucose metabolism.
Fig. 1. Eect of glycerol infusion on the glucose concentration in the
incubation medium. Hepatocytes (100 mg wet w eight) from fa sted rats
were incubated in a total volume of 2 mL with 10 m
M
glucose plus
0.12% (w/v) inulin and 10 mU inulinase e ither alone (j) o r together
with an infusion of g lycer ol at 0.138 0.006 lmolámin
)1
(d)for
periods up to 60 min. The ®gu re shows th e change in the amo unt of
glucose in the incubation me dium, and data are presented as me an
SEM (n 5).
Ó FEBS 2002 Simultaneous hepatic glycolysis and gluconeogenesis (Eur. J. Biochem. 269) 795
hepatocyte incubations infused with glycerol had a minimal
effect o n the rate o f g lucose + glycogen formation from
glycerol (Table 4).
DISCUSSION
In the experiments re ported here, w e used an infusion
technique to maintain concentrations of glycerol below
200 l
M
in the incubation medium. Most experiments were
conducted w ith 40 m
M
glucose i n o rder to achieve n ear
maximal ¯ux through glucokinase. Moreover, the large
glucose pool gave the advantage of reducing the likelihood
of glucose, newly formed from glycerol, being subsequently
glycolysed. In the absence of a dded glucose, about 90% o f
the glycerol taken up was converted into carbohydrate
(glucose plus glycogen) and the b alance was glycolysed. The
rate of glycer ol uptake was unaffected in the presence of
40 m
M
glucose, but carbohydrate synthesis from glycerol
was i nhibited 2 5%, a corresponding amount of glycerol
being d iverted to glycolytic products. However, the pr esence
of 10 m
M
glucose had no signi®cant inhibitory effect on
glycerol conversion into carbohydrate. These ®ndings can
be explained on the basis that some of the glycolytic
products generated from 4 0 m
M
glucose are recycled to
glucose and glycogen [3] and can compete to some extent
with gluconeogenesis from glycerol. This competition is
overcome when glycer ol is added as a bolus at saturating
concentrations. Glycolytic products from glucose, added at
10 m
M
, are apparently recycled to a much lesser extent
[3,26], and do not affect the rate of gluconeogenesis from
infused glycerol.
The addition of a bolus of glycerol to hepatocytes
incubated with 40 m
M
glucose inhibited glycolysis more
than 60%. Ho wever, glycerol infusion depressed glycolysis
from 40 m
M
glucose b y only about 2 5%, and the overall
rate of lactate + pyruvate formation (from g lucose and
glycerol) was unchanged because o f a concomitant increase
in the f ormation of glycolytic product from the infused
glycerol. Glyce rol i nfusion depressed glycolysis from
10 m
M
glucose by 20% and, under these conditions, abou t
17% of the glycerol carbon was diverted to glycolytic
products. Glycerol appears to inhibit glycolysis from
glucose b y two mechanisms. When added a s a bolus, it
depresses glucose phosphorylation, presumably as the
result of depletion of ATP. Un der these c onditions, there
was a decrease in the rate of glucose recycling t hrough
Glc-6- P; however, the proportion of glucose phosphory-
lated recycled back to gluco se was increased. When infused
at a r ate that m aintains a glycerol concentration in t he
incubation medium below 200 l
M
, ATP was not depleted.
It is dif®cult to reconcile the changes in cellular Fru-2,6-P
2
concentration resulting from glycerol infusion with the
simultaneous rates of glycolysis f rom glucose and
gluconeogenesis from glycerol. The inhibition of glycolysis
is consistent with a lowering of the Fru-2,6-P
2
concentra-
tion and an inhibition of phosphofr uctokinase-2, but the
rate of gl uconeogenesis was unaltered in th e presence of
10 m
M
glucose.
When glycerol was the only added substrate, more than
90% o f the
14
C w as recovered in gluc ose and glycogen a nd
about 5% in glycolytic products. However, when 40 m
M
glucose w as also present, the p ercentage of glycerol
14
C
converted into glucose fell to about 65%, and 35%
accumulated as glycolytic products. It can be envis aged
that the operation of a redox couple between Gro-3-P and
pyruvate, generated during g lycolysis from glucose, facili-
tates the entry of so me dihydroxyacetone phosphate and
glyceraldehyde 3-phosphate, d erived from glycerol, into the
glycolytic pathway. This could take place by means of the
interaction o f cytoplasmic NAD-linked Gro-3-P and lactate
dehydrogenases.
Our data, derived both from balance studies and
isotopic e xperiments, show that exposure o f h epatocytes
to glucose and low quasi-steady-state concentrations of
glycerol resulted in the s imultaneous occurrence of
glycolysis from glucose and gluconeogenesis from the
added g lycerol. The r ate of carbohydrate synthesis f rom
glycerol was 60% of the rate of glycolysis from 40 m
M
glucose and exceeded that of glycolysis from 10 m
M
glucose. The shared e nzymes in the metabolic s equences
from glucose to lactate and from glycerol to glucose are
phosphohexose isomerase, aldolase and triose phosphate
isomerase. These c ytoplasmic e nzymes are considered to
catalyse reactions reversible in the presence of m etabolite
concentrations found intracellularly. The enzymes all have
high activity in liver and are thought to keep the mass±
action ratio of their substrates close to equilibrium [3].The
conventional view is that the substrate pools of these
enzymes are e ach considered to exist within a single
aqueous and homogeneous cellular compartment, fre-
quently referred to as the ÔcytosolÕ [27].Insucha
compartment, the fate of a triose phosphate molecule,
expressed in t erms of entry into the glycolytic or
gluconeogenic pathway, should in no way be in¯uenced
whether its origin is exogenous g lycerol or fructose 1,6-
bisphosphate derived from glucose. Yet when hepatocytes
were exposed to glycerol alone, over 90% of the substrate
was c onverted into glucose. M oreover, even in a glycol-
ysing environment, induced by the presence of 40 m
M
glucose, almost three times as much glycerol carbon
entered the gluconeogenic pathway than formed glycolytic
products. When the initial glucose concentration was set
at 10 m
M
, which generated a rate of glycolysis about half
of that observed with 40 m
M
glucose, less than one
glycerol molecule in seven entered the glycolytic pathway.
These results do not seem compatible with the existence of
a single homogeneous pool of triose phosphate contained
within one cellular c ompartment. Rather it seems likely
that the glycolytic and gluconeogenic ¯uxes that take
place as a consequence of exposing hepatocytes to the
substrate combination of glycerol and glucose re¯ect
metabolic ¯ows occurring in two s eparate cellular c om-
partments, i.e . m etabolic channelling.
We therefore interpret our results as demonstrating t hat,
in hepatocytes from normal rats, segments of the pathways
of glycolysis from glucose and gluconeogenesis from
glycerol are c ompartmentalized and that this s egregation
prevents a substantial cross-over of phosphorylated inter-
mediates from one pathway to the other. Brunengraber a nd
coworkers have concluded from mass isotopo mer distribu-
tion analysis that triose phosphate pools a re not equally
labelled by [
13
C]glycerol in whole liver or isolated
hepatocytes [28]. Malaisse et al. [29] have more recent ly
made similar observations. This unequal labelling h as been
explained on the basis of the existence of different cell
populations [28]. This possibility has not been conclusively
796 J. W. Phillips et al.(Eur. J. Biochem. 269) Ó FEBS 2002
excluded in this study, in that our ®nd ings can be accounted
for on the basis that the isolated cell preparation contains
two types of hepatocyte, one kind with glycolytic and the
other with g luconeogenic properties [6]. However, this seems
improbable a s the distribution of g lycerokinase activity is
approximately equal in periportal a nd perivenous hepato-
cytes [28]. Furthermore, there i s considerable overlap in the
distribution of the speci®c enzymes of glycolysis and
gluconeogenesis in the hepatocyte lobule [6]. Thus, it seems
likely that the irregular labelling of triose phosphates by
[
14
C]glycerol, described in [28], may re¯ect labelled and
unlabelled forms of these metabolites coexisting in the same
cell as a consequence of channelling. More direct evidence
for this comes from our ®ndings that there is competition
between glycerol a nd glucose for the glycolytic p athway,
and that g lycolysis is impaired by high c oncentrations of
Gro-3-P. Moreover, glycerol depresses g lucose phosphory-
lation. As hepatocytes are generally impermeable to
phosphorylated metabolites such as Gro-3-P, our observa-
tions suggest that glycolysis and phosphorylation of glycerol
take place in the same cells, a nd that the occurrence of
simultaneous glycolysis and gluconeogenesis is an indication
of channelling within the hepatoc yte cytoplasm of individ-
ual hepatocytes. Further studies to test this hypothesis are in
progress.
ACKNOWLEDGEMENTS
This work was s upported by g rants f rom the Australian National
Health and Medical Research Counc il, th e Flinders Medical Centre
Foundation and the Drug and Alcohol Services Counc il of South
Australia. We thank Mrs S. Phillip s, Ms A . Goodman, M s B. Parker
and Mr M. Inglis for excellent technical assistance.
REFERENCES
1. Berry, M.N., Phillips, J.W., Henly, D.C. & Clark, D.G. (1993)
Eects of fatty acid oxidation on glucose utilisation by isolated
hepatocytes. FEBS Lett. 319, 26±30.
2. Phillips, J.W., Clark, D.G., Henly, D.C. & Berry, M.N. (1995) The
contribution of glucose cycling to the m aintenance of steady-state
levels of lactate by hepatocytes during glycolysis and gluconeo-
genesis. Eur. J. Biochem. 227, 352±358.
3. Newsholme, E.A. & Start, C. (1973) Regulation in Metabolism.
Wiley, London.
4. Fell, D. (1997) Understanding the Control of Metabolism.Portland
Press Ltd, London.
5. Cornish-Bowden, A. (1995) Fundamentals o f Enzyme Kinetics.
Portland Press Ltd, London.
6. Jungermann, K. & Kietzmann, T. (1996) Zonation of parenchymal
and nonparenchymal metabolism in liver. Annu. Rev. Nutr. 16,
179±203.
7. Previs, S.F. & Brunengraber, H. (1998) Methods for measuring
gluconeogenesis in vivo. Curr. Opin. Clin. Nutr. Metab. Care 1,
461±465.
8. Owen, O.E., Smalley, K.J., D'Alessio, D.A., Mozzoli, M.A. &
Dawson, E .K. (1998) Protein, fat, and carbohydrate requirements
during starvation: anaplerosis and cataplerosis. Am.J.Clin.Nutr.
68, 12±34.
9. B erry, M.N., Kun, E. & Werner, H.V. (1973) R egulatory role of
reducing-equivalent transfer from substrate to ox ygen in t he
hepatic metabolism of g lycerol and sorbitol. Eur. J. Biochem. 33,
407±417.
10. Chen, R.F. (1967) Removal of fatty acids from serum albumin b y
charcoal treatment . J. Biol. Chem. 242, 173±181.
11. Berry, M .N., Edwar d s, A.M. & Barritt, G .J. (1991 ) Isol ated
Hepatocytes. Preparation, Properties and Application.Elsevier,
Amsterdam.
12. Berry, M.N. & Friend, D.S. (1969) High-yield preparation of
isolated rat live r parenchymal cells: a biochemic al and ®ne s truc-
tural study. J. Cell Biol. 43, 506±520.
13. Berry, M.N., Werner, H.V. & Kun, E. (1974) Eects of bicarbonate
on intercompartmental red ucing-equivalent translocation in iso-
lated parenchymal cells from rat liver. Biochem. J. 140, 355±361.
14. Cornell, N.W., Lund, P., Hems, R. & Krebs, H.A. (1973) Accel-
eration o f gluconeogenesis from lactate by lysine. Biochem. J. 134,
671±672.
15. H enly, D.C., Phillips, J.W. & Berry, M.N. (1996) Suppression of
glycolysis is a ssociated with an incr ease in glucose cycling i n
hepatocytes from diabetic rats. J. Biol. Chem. 271, 11268±11271.
16. B ontemps , F., Hue, L. & Hers, H.G. (1978) P hosphorylatio n o f
glucose in isolated rat hepatocytes. Sigmoidal kinetics explained by
the activity of glucokinase alone. Biochem. J. 174, 603±611.
17. B erry, M.N., Gregory, R.B., Grivell, A.R., Phillips, J.W. & Scho
È
n,
A. (1994) The c apacity of r educing-equivalent shuttles limits
aerobic glycolysis during ethanol oxidation. Eur. J. Biochem. 225,
557±564.
18. Phillips, J.W., Henly, D.C. & Berry, M.N. (1999) Long-term
maintenance of low concentrations of fructose for the study of
hepatic glucose phosphorylation. Biochem. J. 33 7 , 497±501.
19. Van Schaftingen, E. & Vandercammen, A. ( 1989) Stimulation of
glucose phosphorylation by fructose in isolated rat hep atocytes.
Eur. J. Biochem. 179, 173±177.
20. Van Schaftingen, E., Lederer, B., Bartrons, R. & Hers, H.G. (1982)
A kinetic study of p yrophosp hate: fructose -6-phosphate p hos-
photransferase from po tato tubers. Applicat ion to a mic roassay of
fructose 2,6-bisphosphate. Eur. J. Biochem. 129, 191±195.
21. Bergmeyer, H.U. (1974) Me thods of Enzy matic A nalysis.Aca-
demic Press, New Y ork.
22. Clark, D.G., Rognstad, R. & Katz, J. ( 1973) Isotopic evidence for
futile cycles in liver c ells. Biochem. Biophys. Res. Com mun. 54,
1141±1148.
23. K atz, J., Wals, P.A., Golden, S. & R ognstad, R. (1975) Recycling
of glucose by rat hepatocytes. Eur. J. Biochem. 60, 91±101.
24. Woods, H.F., Eggleston, L.V. & Krebs, H.A. ( 1970) The cause of
hepatic accumulation of fructose 1-phosphate on fructose loadin g.
Biochem. J. 11 9, 501±510.
25. H ue, L. ( 1981) The role of futile cycles in the regulation o f
carbohydrate metabolism i n t he live r. Adv. Enzymol. Relat. Areas
Mol. Biol. 52, 247±331.
26. Gregory, R.B., Phillips, J.W., H enly, D.C. & Berry, M .N. (1996)
Eects of thyroid status on glucose cycling by isolated rat
hepatocytes. Metab. Clin. Exp. 45, 101±108.
27. Lardy, H.A. (1965) On the direction of pyridine nucleotide
oxidation-reduction reactions in gluc oneogemesis and lipogenesis.
In A Symposium on Control of Energy Metabolism (Chance, B.,
Estabrook, R. & Williamson, J.R., eds), pp. 245±248. Academic
Press, New York.
28. Previs, S.F., Hallowell, P.T., Neimanis, K.D., David, F. & Brun-
engraber, H. (1998) L imitations of the mass isotopomer distribu-
tion analysis of glucose to study gluconeogenesis. Heterogeneity of
glucose label ing i n i ncu bated he patocy tes. J. Biol. C he m. 273 ,
16853±16859.
29. Malaisse, W.J., Ladriere, L., Verbruggen, I., Grue-Sorenson, G.,
Bjorkling, F. & Willem, R. (2000) Metabolism of [1,3-
13
C]-
glycerol-1,2,3-tris(methylsuccinate) and g lycerol-1,2,3-tris(methyl
[2,3-
13
C]succinate) in rat hepatocytes. Metab. Clin. Exp. 49,
178±185.
Ó FEBS 2002 Simultaneous hepatic glycolysis and gluconeogenesis (Eur. J. Biochem. 269) 797