Báo cáo Y học: Complexation of ytterbium to human transferrin and its uptake by K562 cells pot
Bạn đang xem bản rút gọn của tài liệu. Xem và tải ngay bản đầy đủ của tài liệu tại đây (425.87 KB, 9 trang )
Complexation of ytterbium to human transferrin and its uptake
by K562 cells
Xiu-lian Du
1
, Tian-lan Zhang
1
, Lan Yuan
1
, Yong-yuan Zhao
1
, Rong-chang Li
1
, Kui Wang
1
, Siu Cheong Yan
2
,
Li Zhang
2
, Hongzhe Sun
2
and Zhong-ming Qian
3
1
Department of Chemical Biology, School of Pharmaceutical Sciences, Peking University, Beijing, China;
2
Department of Chemistry
and Open Laboratory of Chemical Biology, University of Hong Kong, Hong Kong;
3
Department of Applied Biology and Chemical
Technology, Hong Kong Polytechnic University, Kowloon, Hong Kong
There is an increasing interest in the use of lanthanides in
medicine. However, the mechanism of their accumulation in
cells is not well understood. Lanthanide cations are similar to
ferric ions with regard to transferrin binding, suggesting
transferrin-receptor mediated transport is possible; however,
this has not yet been confirmed. In order to clarify this
mechanism, we investigated the binding of Yb
3+
to apo-
transferrin by UV-Vis spectroscopy and stopped-flow spec-
trophotometry, and found that Yb
3+
binds to
apotransferrin at the specific iron sites in the presence of
bicarbonate. The apparent binding constants of these sites
showed that the affinity of Yb
3+
is lower than that of
Fe
3+
and binding of Yb
3+
in the N-lobe is kinetically fav-
ored while the C-lobe is thermodynamically favored. The
first Yb
3+
bound to the C-lobe quantitatively with a Yb/
apotransferrin molar ratio of < 1, whereas the binding to the
other site is weaker and approaches completeness by a higher
molar ratio only. As demonstrated by
1
H NMR spectra,
Yb
3+
binding disturbed the conformation of apotransferrin
in a manner similar to Fe
3+
. Flow cytometric studies on the
uptake of fluorescein isothiocyanate labeled Yb
3+
-bound
transferrin species by K562 cells showed that they bind to the
cell receptors. Laser scanning confocal microscopic studies
with fluorescein isothiocyanate labeled Yb
3+
-bound trans-
ferrin and propidium iodide labeled DNA and RNA in cells
indicated that the Yb
3+
entered the cells. The Yb
3+
-trans-
ferrin complex inhibited the uptake of the fluorescein labeled
ferric-saturated transferrin (Fe
2
-transferrin) complex into
K562 cells. The results demonstrate that the complex of
Yb
3+
-transferrin complex was recognized by the transferrin
receptor and that the transferrin-receptor-mediated mech-
anism is a possible pathway for Yb
3+
accumulation in cells.
Keywords: K562 cells; recognition; transferrin; ytterbium.
Lanthanides have been suggested for the treatment of a
series of diseases and for diagnosis by magnetic resonance
imaging [1,2]. Recent studies also show that they could act
as scavengers of free radicals [3] and therefore protect cells
and tissues from oxidative stress-induced injury. Some
lanthanides nuclides were also suggested for palliative
therapy.
169
Yb (c-emission, t
½
% 32 days) was reported to
provide comparable tumor control and has been considered
as a potential replacement for
125
Iand
103
Pd in permanent
implants [4,5]. Evidently, the intracellular accumulation is
very important in these cases, but its mechanism still
remains unclear.
It was suggested that the particulate- and protein-bound
Ln enters the cells by endocytosis [6]; the anionic low-
molecular-mass complexes, via anion channels [7], whereas
free Ln
3+
is transported by ionophores [8], Na
+
/Ca
2+
exchange [9] and self-facilitated diffusion [10]. It is known
that Ln
3+
is mainly bound to proteins in the extracellular
media (e.g. plasma). Various studies have demonstrated that
considerable amounts of Ln are bound to the iron transport
protein transferrin (Tf) in the blood [11–14]. As metal ions
of therapeutic and diagnostic interest also bind to Tf at the
specific iron sites [15], Tf has been thought of as a Ôdelivery
vehicleÕ for metal ions into cells [16–19]. Tf takes up Fe
3+
at
pH 7.4 and transports it into cells via receptor-mediated
endocytosis. In this transport system, ferric ion binds to
apotransferrin (apo-Tf) first to form an iron-loaded Tf, and
subsequently the iron-loaded Tf binds to the specific Tf
receptor (TfR). The Tf-TfR complex is internalized and iron
dissociates from Tf upon acidification of cytoplasm (pH
% 5.5). The molecular recognition between Tf and TfR is
believed to be critical for the iron transport. The recognition
depends on the conformation of the protein, which is
regulated by the metal ion, from the Ôlobe-openÕ state in the
apo-form to Ôlobe-closedÕ state in the holo-form as revealed
from X-ray crystal structures of Tf and the recombinant
N-lobe of Tf [20–22].
Although Yb
3+
hasbeenreportedtobindtoapo-Tf,it
is not clear whether Yb
3+
can enter the cells by the same way.
Correspondence to K. Wang, Department of Chemical Biology,
School of Pharmaceutical Sciences, Peking University, Beijing,
100083, China. Fax: + 86 10 6201 5584, Tel.: + 86 10 6209 1539,
E-mail: or H.Z. Sun, Department of
Chemistry and Open Laboratory of Chemical Biology,
University of Hong Kong, Pokfulam Road, Hong Kong.
Fax: + 852 2857 1586, Tel.: + 852 2859 8974,
E-mail:
Abbreviations: apo-Tf, apotransferrin; Fe
2
-Tf, ferric-saturated trans-
ferrin or holotransferrin; FITC, fluorescein isothiocyanate; FITC-
Fe
2
-Tf, FITC labeled Fe
2
Tf; hTf, human serum transferrin; LSCM,
laser scanning confocal microscopy; Tf, transferrin; TfR, transferrin
receptor; ICP-AES, inductively coupled plasma atomic emission
spectrometry.
(Received 9 July 2002, revised 15 October 2002,
accepted 21 October 2002)
Eur. J. Biochem. 269, 6082–6090 (2002) Ó FEBS 2002 doi:10.1046/j.1432-1033.2002.03326.x
In the present work, we report a detailed study of uptake of
Yb
3+
by human Tf (hTf) by UV-vis and NMR spectroscopy,
and inductively coupled plasma atomic emission spectro-
metry (ICP-AES). The binding of Yb-bound Tf to human
erythroleukemia K562 cells was determined by flow cyto-
metry and the cross-membrane transport was studied by
confocal laser scanning microscopy (CLSM).
EXPERIMENTAL PROCEDURES
Materials
Human Tf (catalog no. T0519), Hepes, Yb
2
O
3
,Lu
2
O
3
,
fluorescein isothiocyanate (FITC) and propidium iodide
were purchased from Sigma. A Sephadex G-25 fine column
was purchased from Pharmacia. K562 cells were obtained
from the Laboratory of Immunology, Peking University.
RPMI 1640, penicillin, streptomycin and fetal bovine serum
were all purchased from Gibco. All the chemicals used were
of analytical grade. All containers were rinsed with hydro-
chloric acid to diminish the influence of metal ions.
Ultrapure water was used to prepare solutions.
Ytterbium chloride stock solution was prepared by
dissolving ytterbium oxide in a minimum of concentrated
HCl and adjusting pH to % 4 with NaOH. The solution was
then diluted to the concentration needed prior to use.
Ytterbium citrate was prepared by addition of 1 mol equiv
of citrate to YbCl
3
solution and followed by pH adjustment
to 4–6. Human erythroleukemia K562 cells were cultured in
RPMI 1640 medium supplemented with 10% inactivated
fetal bovine serum and 100 UÆmL
)1
penicilin and strepto-
mycin at 310 K in a 5% CO
2
atmosphere. All experiments
wereperformedwithacelldensityof% 5 · 10
5
cells per mL.
Preparation of Fe
C
-Tf and ferric-saturated Tf (Fe
2
-Tf)
Monoferric- (selective loading of Fe
3+
in the C-lobe of Tf)
and diferric-Tf were prepared as described previously [23].
The apo-Tf was purified by sequential dialysis against 0.1
M
Hepes (pH 7.4) with 0.1
M
NaClO
4
for 24 h and then
against 0.1
M
Hepes buffer pH 7.4 containing 0.1
M
NaCl
[24]. The addition of 1 or 2 mol equiv of Fe(nitrilotriace-
tate)
2
to apo-TF and incubated the solution at 310 K for
30 min. The solution was then passed through Sephadex G-
25 column (1 · 10 cm) to remove the low molecular mass
ligands (e.g. nitrilotriacetate), and Fe
C
-Tf or Fe
2
-Tf fraction
was collected. Protein concentrations were determined
spectrophotometrically on the basis of e
280
93 000,
103 000 and 113 000
M
)1
Æcm
)1
for apo-Tf, Fe
C
-Tf and
Fe
2
-Tf, respectively [23]. The iron saturation of Fe
C
-Tf and
Fe
2
-Tf was also estimated from the ratio of A
280nm
/A
465nm
[23].
The Yb-Tf solution was prepared by mixing YbCl
3
and
apo-Tf solutions in a molar ratio of 2.5 : 1 and the free Yb
was removed by ultrafiltration. As indicated in the Results
section, with this molar ratio apo-Tf was not fully saturated
by Yb
3+
however, the major Yb-bound Tf species is mainly
Yb
2
-Tf. Fluorescence labeled Yb-Tf and Fe
2
-Tf were
prepared by incubating Fe
2
-Tf and Yb
2
-Tf solution with
FITC in 0.5
M
Na
2
CO
3
-NaHCO
3
buffer (pH 9.0) at 277 K
for 4–5 h [25]. The excess FITC was removed by gel filtration
through a Sephadex G-25 column (1.0 · 10 cm). The green
solution of FITC-labeled protein fraction was collected. The
ratio of apo-Tf vs. FITC and the concentration of FITC-Tf
were determined according to the literature [26].
Electronic absorption spectroscopy
The apo-Tf solutions were prepared by diluting aliquots of a
stock solution to % 1 · 10
)5
M
)1
with 100 m
M
Hepes buffer
(pH 7.4). Immediately before Yb
3+
was added, an aliquot
of a concentrated solution of NaHCO
3
wasaddedtogivea
5m
M
bicarbonate solution. For titration experiments,
aliquots of the stock solution of Yb
3+
wereaddedtothe
apo-Tf cuvette and the spectra were recorded at intervals of
at least 30 min at room temperature.
Stopped-flow spectrophotometry
The kinetic process of Yb
3+
binding to apo-Tf and Fe
C
-Tf
was monitored on a SF18MV stopped-flow spectropho-
tometer (Applied Photophysics). The changes in the
absorption at 242 nm were followed upon mixing equal
volume of the YbCl
3
and protein solutions (8.3 and 7.9 l
M
for apo-Tf and Fe
C
-Tf, respectively). The driving syringes
were immersed in a water bath at 298 ± 0.5 K. Four-
hundred data points were collected over various times (2, 5
and 10 s) for each trace and each curve was obtained by
averaging 5–10 traces. The dead-time of the instrument
under the experimental condition was less than 5 ms.
Inductively coupled plasma atomic emission
spectrometry
These experiments were carried out on a Perkin-Elmer
Plasmaquant 110 Emission Spectrometer using standard
methods [27]. Yb-loaded proteins were prepared by addition
of appropriate molar equivalent of metal ions to apo-Tf in
0.1
M
Hepes buffer containing 0.1
M
NaCl,atpH7.4,and
left to incubate at room temperature for about 1 h. Then the
samples were purified by using Centricon 30 (Amicon)
ultrafilters, washed four times with 0.1
M
Hepes buffer,
followed by ultrafiltration after each washing. The final
protein solutions were diluted with ultrapure water con-
taining 1% nitric acid. The Yb content measured directly
without digestion of the samples using ICP-AES at
369.3 nm.
NMR spectroscopy
1
H NMR spectra were recorded at 500 MHz on a Bruker
DRX500 spectrometer. Spectra were acquired using 0.6 mL
of solution in a 5-mm tube at 298 K, % 1000 transients, 6-ls
pulses, recycle time 1.8 s and 16 K data points. A solution of
0.8 m
M
apo-Tf in 0.1
M
KCl, 10 m
M
NaHCO
3
was used for
the
1
H NMR studies. The pH values of NMR solutions were
kept at 7.40 ± 0.05 and was checked before and after NMR
measurements with a Corning 440 pH-meter, equipped
with an Aldrich microcombination electrode and calibrated
with standard buffers at pH 4.0 and 7.0, respectively.
Flow cytometry analysis
The competitive effect of Yb-Tf species on binding of Fe
2
-Tf
to K562 cells was studied by flow cytometry. The solutions
with a constant concentration of FITC-labeled Fe
2
-Tf and
Ó FEBS 2002 Ytterbium transferrin (Eur. J. Biochem. 269) 6083
various concentrations of unlabeled Yb-Tf (2.5 : 1) were
each incubated with 1 mL of K562 cell suspension
(10
6
cellsÆmL
)1
)in10m
M
Hepes buffer (pH 7.4), contain-
ing 0.15
M
NaCl at 310 K for 30 min. After chilling
(0 °C, 30 min) to terminate the reaction, the incubated
mixtures were centrifuged at 500 g for 5 min and then the
pellets were washed twice with ice-cold Hank’s balanced salt
solution to remove the extracellular FITC-labeled Fe
2
-Tf.
The fluorescence intensity of each single cell was recorded
on a FASCAN flow cytometer (Becton-Dickinsin), with
argon laser set at k
ex
488 nm and k
em
530 ± 26 nm. The
results were expressed as the mean channel fluorescence
intensity (
FF), which was obtained by integrating the
intensity per cell from 1 · 10
4
cells for each sample.
Laser scanning confocal microscopy
Entry of FITC-Yb-Tf into K562 cells was investigated by
LCSM. A suspension (1 mL) of 10
6
K562 cells was
incubated with 1 l
M
FITC-Yb-Tf solution for 30 min at
310 K. The unbound FITC-Yb-Tf was removed by
centrifugation with ice-cold 10 m
M
Hepes buffer at
pH 7.4, containing 0.15
M
NaCl. The cells were visualized
under LCSM (TCS NT, Leica). Fluorescence images were
collected at 512 · 512 pixels resolution using confocal
microscopy with an oil immersion objective (apo-planar
40 · 1.25) in a Leica inverted microscopy, with k
ex
488 nm for FITC-Yb-Tf or Fe
2
-Tf, and k
ex
568 nm for
propidium iodide. The emission fluorescence at k
em
530/
30 nm was collected with Band Pass (BP) filter and Long
Pass (LP) 590 nm filter.
RESULTS
Binding of Yb
3+
to apo-hTf
The thermodynamics of binding of Yb
3+
to apoTf.
Binding of Yb
3+
to apo-Tf was investigated by addition
of aliquots of Yb
3+
to a solution of apo-TF in 100 m
M
Hepes buffer in the presence of 5 m
M
NaHCO
3
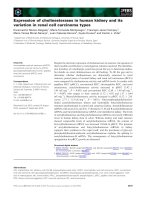
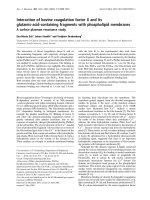
. As shown
in Fig. 1, upon addition of Yb
3+
to apo-Tf, two absorbance
bands appeared at 242 and 292 nm, the characteristic of
metal binding to phenolate groups of tyrosine residues at the
specific iron bind-sites of apo-Tf. The De
242
increases
linearly with the increase of Yb/apoTf ratio (r)uptoa
value of r ¼ 1. The results indicated that Yb
3+
bound to
tyrosine residues of the Fe
3+
-binding sites and induced
deprotonation. From the initial slope of the curve, the
molecular absorption coefficient (e)ofTfwithoneYb
3+
saturated was obtained as 26 500 ± 500
M
)1
Æcm
)1
. Above
r ¼ 1, the absorption increases further but less profoundly,
indicative of the occupation of a second site with a lower
affinity. Under similar conditions, reactions of apo-Tf with
Yb
3+
-citrate gave rise to the same two bands at 242 and
292 nm, respectively, and the same molecular absorption
coefficient. We also noticed that the higher the bicarbonate
concentration, the higher degree of saturation of trnasferrin
by Yb
3+
(data not shown).
The two dissociation constants (K
d1
and K
d2
)were
determined based on the data in Fig. 1. According to
Bjerrum equation [28], we have,
nn ¼
K
1
½Yb
3þ
free
þ 2K
1
K
2
½Yb
3þ
2
free
1 þ K
1
½Yb
3þ
free
þ K
1
K
2
½Yb
3þ
2
free
ð1Þ
where
nn ¼
½Yb
3þ
bind
½Tf
total
, K
1
(¼ 1/K
d1
)andK
2
(¼ 1/K
d2
)are
the stepwise association constants.
At low [Yb
3+
]
total
, all of the added Yb
3+
bind to
apo ) Tf, [Yb
3+
]
bind
¼ [Yb
3
±Tf ] and therefore,
nn ¼
½Yb
3þ
À Tf
½Tf
total
¼ / ¼
A À A
min
A
max
À A
min
ð2Þ
½Yb
3þ
free
¼½Yb
3þ
total
À½Yb
3þ
bind
¼½Yb
3þ
total
À½Yb
3
Æ Tf
¼½Yb
3þ
total
À /½Tf
total
ð3Þ
By fitting the /$ [Yb
3+
]
free
curve to Eqn (1) with those
data shown in the insert of Fig. 1, we get the two
dissociation constants K
d1
¼ 4.17 ± 0.4 l
M
and K
d2
¼
18.5 ± 7.0 l
M
.
ICP-AES was also used to study the binding ratio of Yb
3+
to apo-Tf. After addition of 2.0 and 2.5 mol equiv of Yb
3+
to apo-Tf, the final ratios of Yb
3+
to Tf, after removal of low
molecular mass components via ultrafiltration, were %
1.70 : 1 and 1.98 : 1, respectively. This suggested that both
the N- and C-lobe of apo-Tf could be occupied by Yb
3+
.
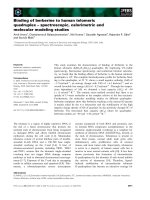
The kinetics of binding of Yb
3+
to apo-Tf. The kinetics of
Yb
3+
binding to apo-Tf was studied with the stopped-flow
technique. The absorbance at 242 nm increased upon
mixing Yb
3+
with apo-Tf and the rise was more rapid with
increasing the molar ratio of Yb
3+
to apo-Tf (data not
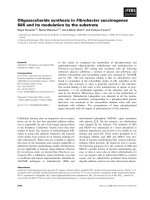
shown). The apparent rate constants were obtained from
fitting the kinetic curves. The quality of the fits was assessed
according to the residuals and the normalized variance
(Fig. 2). The data can be fitted to the bi-exponential
function (Eqn 4):
fðxÞ¼A
1
expðÀR
1
xÞþA
2
expðÀR
2
xÞþc ð4Þ
Where R
1
and R
2
are the rate constants of the two kinetic
phases, and A
1
and A
2
are the corresponding amplitudes
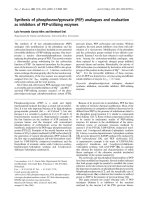
Fig. 1. UV difference spectra of apo-Tf (11.3 l
M
apo-Tf in 5 m
M
NaHCO
3
and 10 m
M
Hepes buffer at pH 7.4 and 310 K) after addition
of various amounts of molar ratios of Yb
3+
(as YbCl
3
). The two
absorption bands at 242 and 295 nm are indicative of Yb
3+
binding to
the specific iron sites of Tf. Molar ratio from bottom to top: 0.25, 0.50,
0.75, 1.0, 1.25, 1.5, 2.0, 3.0, 3.5 and 4.0. Inset: titration curve (242 nm)
for Yb
3+
binding to apo-Tf.
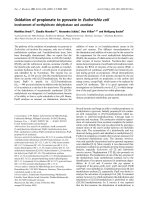
6084 X l. Du et al. (Eur. J. Biochem. 269) Ó FEBS 2002
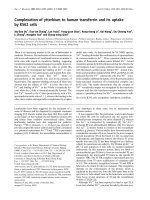
that show the contribution of individual kinetic phases to
the observed change in the absorption. The molar absorp-
tivity (e) and the normalized rate constant k can be obtained
from the fitted values of A and R divided by the protein
concentration (e ¼ A/[Tf] and k ¼ R/[Tf]). The depend-
ence of e and k on the molar ratio of Yb
3+
to apo-Tf is
shown in Fig. 3, upper and lower, respectively.
In order to understand the two kinetic phases, Tf with
iron selectively loaded into the C-lobe (Fe
C
-Tf) was
prepared and the binding kinetics of Yb
3+
to Fe
C
-Tf was
studied under the same experimental conditions. Quite
differently, the kinetic data for the reaction of Yb
3+
and
Fe
C
-Tf can readily be fitted to a single exponential function
f(x) ¼ Aexp(–Rx) + c. The molar absorptivity (e)andthe
normalized rate constant k can be obtained similarly and
were shown in Fig. 2 for comparison. It was noticed that e
1
and e (13 300 ± 500
M
)1
Æcm
)1
) were approximately the
same and were only half the value of e
2
. The slope of the
curve of rate constant k
1
vs. [Yb
3+
]/protein (1.268 · 10
5
s
)1
) was again almost the same as that of k vs. [Yb
3+
]/
protein (slope: 1.216 · 10
5
s
)1
).
Citrate competition
The competition between Tf and citrate for Yb
3+
binding
was investigated by addition of small aliquots of citrate to
the solution containing apo-Tf and 2.5 mol equivalents of
Yb
3+
in the presence of 5 m
M
bicarbonate. The protein
bound Yb
3+
(converted from DA
242
) decreased almost
linearly upon addition of 2, 4, 6, 8 and 10 mol equiv of
citrate, and finally reached to < 10% of its original value.
The very minor decrease in absorbance upon further
addition of citrate was probably due to other factors
(Fig. 4).
Competition with ferric iron. When Fe
3+
wasaddedtoa
solution of apo-Tf containing 2.5 mol equiv of Yb
3+
,anew
broad band centred at 465 nm appeared and increased in
intensity gradually up to 2.0 mol equiv of Fe
3+
(data not
shown). This indicated that 2 mol equiv of iron were
sufficient to completely displace Yb
3+
from Yb-bound Tf
species in solution of 2.5 : 1 mol ratio, suggesting that Fe
3+
binds to Tf more tightly than Yb
3+
(data not shown).
The binding mode and the conformational changes
induced by Lu
3+
and Yb
3+
:
1
H NMR studies
These experiments were carried out in order to investigate
the order of lobe loading and the conformational change
induced by Yb
3+
. Because the signals of Yb
3+
-Tf systems
were broadened, due to paramagnetic effect of Yb
3+
,a
parallel study on Lu
3+
and apo-Tf was conducted for
comparison that will provide insight into the nature of
Yb
3+
binding and the conformational changes in detail.
A
1
H NMR spectrum of apo-Tf in the presence of 10 m
M
bicarbonate was recorded after addition of Yb
3+
(or Lu
3+
)
Fig. 2. Kinetics of binding of Yb
3+
to apo-Tf. The final concentration of
the protein is 4.15 l
M
, and the molar ratio of Yb
3+
to apo-Tf is 1.75.
Also shown are the residuals to the bi- (middle) and mono-exponential
fits (the lower), suggesting that the bi-exponential function is a better fit.
Fig. 3. The dependence of e (top) and k (bottom) on the molar ratio of
Yb
3+
to apo-Tf. In the lower panel the data of k
1
, k
2
and k over the
range of the ratio [Yb
3+
]/protein between 2 and 6 are linearly fitted:
k
1
¼ 1.268x + 2.449, R
2
¼ 0.979; k
2
¼ 0.704x + 0.110, R
2
¼ 0.952;
k ¼ 1.216x + 0.508, R
2
¼ 0.996.
Ó FEBS 2002 Ytterbium transferrin (Eur. J. Biochem. 269) 6085
in steps of 0.5 mol equiv. Typical
1
H NMR spectra of apo-
Tf in aliphatic and aromatic regions are shown in Figs 5 and
6. The resonance appeared in the high-field region
(+0.5 to )1.0 p.p.m., Fig. 5A) was attributed to the methyl
groups close to the surface of the aromatic rings of Phe, Trp
and Tyr residues due to the ring current effects [29]. Signal b
()0.33 p.p.m) was related to the resonance of the CH
3
group of Leu122, which lies directly above the face of
Trp128 [29–31]. Signals g and h were assigned to Leu122
and Val246, respectively; other signals were assigned to
methyl groups in the C-lobe [29]. Following the addition of
1 mol equiv of Lu
3+
, signal c disappeared, signal d
increased in intensity, while signal j decreased, and signal i
shifted to the lower frequency. The other signals remained
unchanged. This suggests that Lu
3+
binds to the C-lobe
first. No changes appeared after further addition of Lu
3+
,
which is similar to that of Bi
3+
[32]. More changes were
observed in the
1
H NMR spectrum upon addition of Yb
3+
to Tf solution (Fig. 6).
The typical
1
H NMR spectrum of Tf in the region of 2.0–
2.2 p.p.m. featured three sharp intense signals (Figs 5B and
6B), which are assigned to the N-acetyl moieties of AcNeu
and GlcNac of the di-antennary glycan chains in the C-lobe
[29]. Upon the addition of 1 mol equiv of Lu
3+
,anew
signal appeared at 2.097 p.p.m. (signal C), while the signal
at 2.088 p.p.m. split into two (A and B). The relative
intensities of the peaks altered upon further addition of
Lu
3+
, but no shift occurred. Although the signals were
broadened and shifted by Yb
3+
due to its paramagnetic
character, the appearance of a new signal at 2.120 p.p.m.
and the splitting of signals at 2.084 and 2.045 p.p.m. were
still visible (Fig. 5B); Yb
3+
binding to the C-lobe can thus
be inferred. These results suggested that Yb
3+
bind to the
protein and probably altered the conformation of the
protein in a manner similar to Fe
3+
.
The signals in the region of 6.2–8.5 p.p.m. were usually
attributed to His dCH resonance. As shown in Fig. 5C,
when 0.5 mol equiv of Lu
3+
was added, signal p
(6.360 p.p.m) decreased in intensity, while the new signal
q appeared at 6.420 p.p.m. Further addition of Lu
3+
led to
the disappearance of p and further increase of q, whereas a
new signal r emerged at 7.75 p.p.m. No further changes
were observed up to 1.5 mol equivalent Lu
3+
was added. In
2D-TOCSY
1
H NMR spectra, the signals at 6.34 p.p.m. (p)
and 7.72 p.p.m. (r) were previously demonstrated to be
correlated [32]. These changes induced by Lu
3+
indicated
the disturbance on the microenvironment around His
residues. In contrast, the signals of apo-Tf were severely
broadened when Yb
3+
was added (data not shown).
Binding of Yb
2
-Tf on K562 cell membrane
Binding of FITC-Yb
2
-Tf to K562 cells. The binding of
Yb-bound Tf species in solution with 2.5 : 1 mol ratio to
K562 cellular membrane was quantitatively evaluated by
sorting the cells after incubation with FITC-Yb
2
-Tf by
flow cytometric technique based on the fluorescence excited
at 488 nm. As shown in Fig. 7A, the mean channel
fluorescence intensity (
FF), which reflects the amount of
FITC-Yb-Tf species bound to the cells, was found to
increase significantly at low concentration of FITC-Yb-Tf
(<0.1l
M
Tf), probably due to specific binding of the
protein to Tf receptor (TfR). When the concentration of
FITC-Yb-Tf was over 0.1 l
M
, the increase in intensity
became less profound and reached saturation at 0.2 l
M
.
In contrast, the mean channel fluorescence intensity of
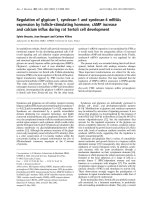
Fig. 5.
1
H NMR Spectra of apo-Tf and its Lu
3+
complexes. (A) In the
high-fieldregion()1.0 to +0.5 p.p.m), (B) N-acetyl region, and (C) in
the aromatic region.
Fig. 6.
1
H NMR spectra of apo-Tf and its Yb
3+
complexes in the high-
field region ()1.0 to +0.5 p.p.m) (A) and N-acetyl region (B).
Fig. 4. Competition between apo-Tf and citrate. Changes in percent of
Yb bound to Tf (converted from the molar absorption coefficient at
242 nm) with increasing citrate concentration at 298 K and pH 7.4.
6086 X l. Du et al. (Eur. J. Biochem. 269) Ó FEBS 2002
FITC-Fe
2
-Tf increased more evidently and reached satura-
tion at a much lower concentration (0.05 l
M
)thanthatof
FITC-Yb-Tf species under the same conditions. This result
confirmed the binding of Yb-Tf to K562 cellular membrane.
The competitive effect of Yb
2
-Tf on the binding of Fe
2
-Tf
to K562 cells. K562 cells were incubated with a constant
concentration of FITC-Fe
2
-Tf solution in the presence of
different molar ratios of Yb-Tf (2.5 : 1) at 273 K for
30 min. The cells were then sorted according to FITC
fluorescence excited at 488 nm (Fig. 7). The results showed
that upon the addition of Yb
2
-Tf and increasing the molar
ratio of Yb-Tf /FITC-Fe
2
-Tf, the cell populations shift to
lowered fluorescence (Fig. 7B), while the mean fluorescence
intensity (
FF) decreased with increasing concentration of Yb-
Tf (Fig. 7C). The
FF decreased to half of its original value
when 18 mol equiv of Yb-Tf was incubated with cells in the
presence of FITC-Fe
2
-Tf. Therefore part of the FITC-Fe
2
-
Tf was inhibited from binding to TfR by Yb-Tf. These
results suggested that Yb-bound Tf species compete with
Fe
2
-Tf for the specific Fe
2
-Tf binding sites to the receptor on
the cell membrane.
The transport of FITC-Yb
3+
-apo-Tf into K562 cells
observed by LCSM
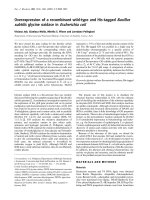
LSCM was employed to visualize the entry of FITC labeled
Yb-bound Tf species into K562 cells. In Fig. 8A,B, the
green fluorescence resulted from the emission of FITC
labeled Yb-Tf when cells were excited at 488 nm. As the
protein (Tf) was randomly labeled with FITC, its position
and intensity represent the location and relative concentra-
tion of the labeled Yb-Tf. The red fluorescence resulted
from the emission of propidium iodide when the same cells
were labeled with propidium iodide and excited at 560 nm.
The appearance of green fluorescence inside K562 cells
(Fig. 8C) clearly demonstrates that FITC labeled protein
not only binds to K562 cellular membrane but also enters
the cells.
DISCUSSION
There is an increasing interest in the use of lanthanide in
medicine and biology [4–7].
169
Yb has been considered as a
potential replacement for
125
Iand
103
Pd. It was also chosen
as a model nuclide for chemically related trivalent metal
ions such as
90
Y
3+
and the clinically used
153
Sm
3+
[4,5].
However, not enough about transport proteins and the
chemical structure in which
169
Yb is incorporated into cells
is understood; in order to improve their accumulation in
tumors, such knowledge is essential. Tf is a glycoprotein
(80 kDa) present in blood plasma with a concentration of
35 l
M
.Itisonly30%saturatedwithironinbloodplasma
and has the capacity for binding to other metal ions of
therapeutic and diagnostic interest [16]. Therefore, it has
been suggested that Tf can act as a nature ÔcarrierÕ for
metallodrugs (e.g.
67
Ga, Ru and Ti anticancer agents) [33].
Complexation of metal ions to the phenolic group of
the tyrosine residues in the specific iron site perturbs the
p–p* transitions of the aromatic group and leads to
two absorption bands at % 240 and 295 nm in the UV
difference spectrum. The molar absorption coefficient
(26 500
M
)1
Æcm
)1
) upon binding of Yb
3+
to apo-Tf, is
similar to other Ln to apo-Tf, for example, 20,400, 21 000
and 22 000
M
)1
Æcm
)1
for Lu
3+
,Sm
3+
and Eu
3+
,respect-
ively [34]. Both UV and ICP-AES data suggested that two
Yb
3+
bind to apo-Tf in the specific iron binding site and two
tyrosines are involved in binding of Yb
3+
in both the N- and
C-lobe as the case for Fe
3+
. The X-ray crystal structure of
Sm
2
-lactoferrin revealed that Sm
3+
indeed binds to two
tyrosine residues in both lobes of the protein and induces the
Fig. 7. Saturation curve of binding of FITC-Fe
2
-Tf (filled square) and
FITC-Yb-Tf (filled red circle) to the K562 cellular membrane (A), his-
tograms of cellular fluorescence excited by 488 nm (B), and the inhibition
of Yb-Tf on FITC-Fe
2
-Tf bound to K562 cells (C). The three curves in
(B) represent the negative populations (curve ÔaÕ), cell populations after
incubation with 0.48
M
FITC-Fe
2
-Tf solution (curve ÔbÕ)andcell
populations after incubation with solution with Yb
2
Tf: Fe
2
-Tf ¼ 18,
0.48
M
FITC-Fe
2
-Tf (curve ÔcÕ).
Ó FEBS 2002 Ytterbium transferrin (Eur. J. Biochem. 269) 6087
same overall structural changes in this protein as Fe
3+
[35].
However, binding of Yb
3+
to the strong site (the C-lobe)
was in a molar ratio Yb
3+
/apo-Tf < 1: 1, while the binding
to the other site is much weaker.
To examine the kinetics of the uptake of Yb
3+
in the
individual lobes, we carried out stopped-flow experiments
and found two kinetic phases with twofold differences in rate
constants. The almost identical molar absorptivity of e
1
and e
and approximately the same slope of the k
1
and k (Fig. 3)
suggests that thenatureofthefirstkineticphaseofthereaction
between Yb
3+
and apo-Tf is the same as that of the reaction
between Yb
3+
and Fe
C
-Tf. Therefore the rapid kinetic phase
should correspond to the binding of the metal to the N-lobe,
although the binding favorsthe C-lobe thermodynamically as
judged by
1
H NMR. The more open conformation of the N-
lobe may facilitate Yb
3+
ion binding [21].
Although
1
H NMR signals were considerably broadened
upon addition of Yb
3+
to the protein due to paramagnetic
properties, information can still be obtained by comparison
with its analogue Lu
3+
. The sharp resonances at 2.0–
2.2 p.p.m. are attributable to the N-acetyl moieties of the
glycan chains (NAcGlc and NacNeu residues) in the C-lobe
of Tf. As these resonances were perturbed only on addition of
the first mol equiv of Yb
3+
and Lu
3+
(Figs 5 and 6), this
suggests preferential binding of Yb
3+
(and Lu
3+
)tothe
C-lobe of Tf occurs. Similar behavior has been observed for
several other metal ions [29,30,32]. The changes in shifts
induced by progressive addition of Lu
3+
(and Yb
3+
)maybe
due to the conformational change induced by metal ions, a
common feature that was observed previously [16,29,30,32].
Our flow cytometric data (Fig. 7) clearly demonstrate
that the Yb-bound Tf species can be recognized by and bind
to TfR on the surface of K562 cells in a manner similar to
Fe
2
-Tf. However, the higher saturation concentration of
Yb
2
-Tf (0.2 l
M
vs. 0.05 l
M
for Fe
2
-Tf) and its competition
with iron indicated a lower affinity of cell receptors for Yb
2
-
Tf than for Fe
2
-Tf.
LCSM offers an effective way to investigate the transport
of extracellular molecules across the membranes and to
identify the locations of the molecules within individual cells
using appropriate fluorescent probes [36–38]. The green
fluorescence inside cells indicated that FITC-Yb
2
-Tf entered
cells and may have been located in cytoplasm when
compared with cells labeled with propidium iodide. These
results are in good agreement with flow cytometric study.
However, they are merely the static pictures, reflecting the
position of the Yb-bound Tf species at that moment.
Further investigation is therefore needed to confirm whether
Yb
3+
can be released from Yb-Tf species. Our data on the
stability of the Yb
3+
–Tf complexes as a function of pH have
shown that Yb
3+
was released under acidic conditions
(pH < 6). Intracellular Yb has also been detected after
incubation of Yb-Tf solution (mol ratio 2.5 : 1) with U87-
MGcellsbyICP-MS(K.Wang,X.Du,Y.Chang,R.Li,J.
Situ, H. Sun & Z. Qian, unpublished data). Thus, beside
anion channel and other mechanism (e.g. citrate), the
cellular uptake of Yb
3+
via Tf receptor-mediated endocy-
tosis is highly possible.
Different transport or uptake mechanisms seem to exist for
the complexes of Yb
3+
and uptake of
169
Yb-citrate was
previously shown to be an active cellular transport process. It
is only dependent on the metabolic activity of the cells,
however, and is not tumor specific [5]. The citrate concentra-
tion in blood plasma (% 100 l
M
) is comparable to Tf
(35 l
M
). Our citrate competition data indicated that binding
of Yb
3+
to Tf is slightly stronger than to citrate (Fig. 4). The
metal can be essentially removed from the protein in the
presence of 10 mol equiv of citrate. Therefore, Tf is probably
one of the (major) targets in blood plasma in addition to
citrate. Previous in vivo andin vitro studies usinglabeled blood
serum have suggested that the major target of Yb
3+
is Tf
[12,13]. It is known that malignant cells have a higher iron
requirement and subsequently express much higher Tf
receptors [39]. Then the uptake of Yb-bound Tf by the tumor
cells might be much higher than the normal cells and the
uptake of iron by the tumor cells will be retarded much more
than by the normal cells. Yb-Tf uptake mechanism via the
receptor-mediated endocytosis is possible and this mechan-
ism could selectively facilitate the accumulation of Yb
3+
in
tumor cells. It is known that
67
Ga citrate, a commonly used
radiopharmaceutical for soft tumors and abscess diagnosis,
enters tumor cells via the Tf mediated endocytosis [11,40,41].
CONCLUSIONS
The spectroscopic studies have shown that Yb
3+
binds to
the two specific iron-sites of apo-Tf. The
1
HNMRdata
show that Yb
3+
preferentially occupies the C-lobe rather
than the N-lobe, as has been observed for several other
metal ions and that Yb
3+
can be replaced by Fe
3+
.
Interestingly, the binding to the N-lobe is kinetically
favored. The binding of Yb
2
-Tf to K562 cell membranes
(TfR) was demonstrated and was weaker than that of Fe
2
-
Tf and only part of Fe
2
-Tf could be displaced. The confocal
microscopic studies indicated that Yb
2
-Tf is likely to enter
the cells in a way similar to Fe
2
-Tf, and at the same time
almost without affecting the function of Tf. It will be
interesting for the future to investigate whether Tf can
enhance Yb
3+
accumulation in tumor cells.
ACKNOWLEDGEMENTS
This work was funded by National Natural Science Foundation of
China (No. 29890280), the University of Hong Kong and the Hong
Kong Polytechnic University. We thank the Area of Excellence Scheme
of University Grants Committee (Hong Kong) for their support.
Fig. 8. Transport of FITC-Yb-Tf into K562
cells visualized by LSCM. (A) K562 cells after
incubation with FITC-Yb-Tf (B) propidium
iodide-stained K562 cells and (C) merging the
images. The green fluorescence indicated
FITC- Yb
2
Tf entered into cells.
6088 X l. Du et al. (Eur. J. Biochem. 269) Ó FEBS 2002
REFERENCES
1. Smith, T., Shawe, D.J., Crawley, J.C.W. & Gumpel, J.M. (1988)
Use of single photon emission computed tomography (SPECT)
to study the distribution of
90
YinpatientswithBaker’s
cysts and persistent synovitis of the knee. Ann. Rheum. Dis. 47,
553–558.
2. Canada, R.G. (1993) Calcium receptor binding of cisplatin and
terbium in human breast tumor cells after hyperthermia. Radiat.
Res. 133, 170–175.
3. Wang, K., Li, R.C., Cheng, Y. & Zhu, B. (1999) Lanthanides- the
future drugs? Coord. Chem. Rev. 190–192, 297–308.
4. Lazarescu, G.R. & Battista, J.J. (1997) Analysis of the radio-
biology of ytterbium-169 and iodine-125 permanent brachyther-
apy implants. Phys.Med.Biol.42, 1727–1736.
5. Kampf, G., Knop, G., Franke, W.G., Bergmann, R. &
Johannsen, B. (1997) Uptake of
169
Yb complexes in normal and
tumour cells: influence of ligand and metabolic cell activity and
stability of cellular association. Nucl. Med. Biol. 24, 349–355.
6. Evans, C.H. (1990) Biochemistry of the Lanthanides.PlenumPress,
New York.
7. Cheng, Y., Huo, Q.H., Lu, J.F., Li, R.C. & Wang, K. (1999) The
transport kinetics of lanthanide species in a single erythrocyte
probed by confocal laser scanning microscopy. J. Biol. Inorg.
Chem. 4, 447–456.
8. Shastri, B.P., Sankaram, M.B. & Easwaran, K.R. (1987) Car-
boxylic ionophore (lasalocid A and A23187) mediated lanthanide
ion transport across phospholipid vesicles. Biochemistry 26, 4925–
4930.
9. Powis, D.A., Clark, C.L. & O’Brien, K.J. (1994) Lanthanum can
be transported by the sodium-calcium exchange pathway and
directly triggers catecholamine release from bovine chromaffin
cells. Cell Calcium 16, 377–390.
10. Cheng,Y.,Liu,M.Z.,Li,R.C.,Wang,C.,Bai,C.L.&Wang,K.
(1999) Gadolinium induces domain and pore formation of human
erythrocyte membrane: an atomic force microscopic study. Bio-
chim. Biophys. Acta 1421, 249–260.
11. Jackson, G.E. & Byrne, M.J. (1996) Metal ion speciation in blood
plasma: gallium-67-citrate and MRI contrast agents. J. Nucl. Med.
37, 379–386.
12. Taylor, D.M., Duffield, J.R., Williams, D.R., Yuele, L., Gaskin,
P.W. & Unalkat, P. (1991) Binding of f-elements to the iron-
transport protein transferrin. Eur. J. Solid. State. Inorg. Chem. 28,
271–274.
13. Meng, L., Ding, L., Chen, H.T., Zhao, D.Q. & Ni, J.Z. (1999)
Biologicaleffectofrareearth(I)-contentanddistributionofrare
earth in normal human plasma. Chem.J.Chin.University20, 5–8.
14. Luk, K.C. (1971) Study of the nature of the metal-binding sites
and estimate of the distance between the metal-binding sites in
transferrin using trivalent lanthanide ions as fluorescent probes.
Biochemistry 10, 2838–2843.
15. Aisen, P. (1998) Transferrin, the transferrin receptor, and the
uptake of iron by cells. Metal Ions Biol. Syst. 35, 585–631.
16. Sun, H., Li, H. & Sadler, P.J. (1999) Transferrin as a metal ion
mediator. Chem. Rev. 99, 2817–2842.
17. Harris, A.W. & Sephton, R.G. (1977) Transferrin promotion of
67
Ga and
59
Fe uptake by cultured mouse myeloma cells. Cancer
Res. 37, 3634–3638.
18. van Leeuwen-Stok, A.E., Schuurhuis, G.J., Drager, A.M., Visser-
Platier, A.W., Teule, G.J. & Huijgens, P.C. (1996) Effect of
modulation of the transferrin receptor on gallium-67 uptake and
cytotoxicity in lymphoma cell lines. Br.J.Cancer74, 619–624.
19. Roskams, A.J. & Connor, J.R. (1990) Aluminum access to the
brain: a role for transferrin and its receptor. Proc.NatlAcad.Sci.
USA 87, 9024–9027.
20. Zuccola, H.J. (1993) The crystal structure of monoferric human
serum transferrin. PhD Thesis, Georgia Institute of Technology,
Atlanta, GA.
21. Jeffrey, P.D., Bewley, M.C., MacGillivray, R.T.A., Mason, A.B.,
Woodworth, R.C. & Baker, E.N. (1998) Ligand-induced con-
formational change in transferrins: crystal structure of the open
form of the N-terminal half-molecule of human transferrin. Bio-
chemistry 37, 13978–13986.
22. MacGillivray, R.T.A., Moore, S.A., Chen, J., Anderson, B.F.,
Baker, H., Luo, Y., Bewley, M., Smith, C.A., Murphy, M.E.P.,
Wang, Y., Mason, A.B., Woodworth, R.C., Brayer, G.D. &
Baker, E.N. (1998) Two high-resolution crystal structures of the
recombinant N-lobe of human transferrin reveal a structural
change implicated in iron release. Biochemistry 37, 7919–7928.
23. Martin, D.M., Chasteen, N.D. & Grady, J.K. (1991) Fluorescence
and kinetic properties of Ru (III) (NH
3
)
5
modified transferrin.
Biochim. Biophys. Acta 1076, 252–258.
24. Bali, P.K. & Harris, W.R. (1990) Site-specific rate constants for
iron removal from diferric transferrin by nitrilotris (methylene-
phosphonic acid) and pyrophosphate. Arch. Biochim. Biophys.
281, 251–256.
25. Musgrove, E., Rugg, C., Tayor, I. & Hedley, D. (1984) Transferrin
receptor expression during exponential and plateau phase growth
of human tumour cells in culture. J. Cell Physiol. 118, 6–12.
26. Aladar, J. & Kalman, K. (1966) Chemical characterization of
fluorescein isothiocyanate-protein conjugates. Biochim. Biophys.
Acta 124, 166–175.
27. Zhang, L., Szeto, K.Y., Wong, W.B., Loh, T.T., Sadler, P.J. &
Sun, H. (2001) Interactions of bismuth with human lactoferrin and
recognition of the Bi(III)-lactoferrin complex by intestinal cells.
Biochemistry 40, 13281–13287.
28. Naik, D.V., Paul, W.L., Threatte, R.M. & Schulman, S.G. (1975)
Fluorometric determination of drug–protein association con-
stants: the binding of 8-anilino-1-naphthalenesulfonate by bovine
serum albumin. Anal. Chem. 47, 267–270.
29. Kubal, G., Mason, A.B., Sadler, P.J., Tucker, A. & Woodworth,
R.C. (1992) Uptake of Al
3+
into the N-lobe of human serum
transferrin. Biochem. J. 285, 711–714.
30. Kubal, G., Mason, A.B., Patel, S.U., Sadler, P.J. & Woodworth,
R.C. (1993) Oxalate- and Ga(3+)-induced structural changes in
human serum transferrin and its recombinant N-lobe.
1
HNMR
detection of preferential C-lobe Ga
3+
binding. Biochemistry 32,
3387–3395.
31. Kubal, G., Sadler, P.J. & Tucker, A. (1994) pH-induced structural
changes in human serum apotransferrin. pKa values of histidine
residues and N-terminal amino group determined by
1
H-NMR
spectroscopy. Eur. J. Biochem. 220, 781–787.
32. Li, H., Sadler, P.J. & Sun, H. (1996) Unexpectedly strong binding
of a large metal ion (Bi3+) to human serum transferrin. J. Biol.
Chem. 271, 9483–9489.
33. Li, H., Sun, H. & Qian, Z.M. (2002) The role of the transferrin-
transferrin-receptor system in drug delivery and targeting. Trends
Pharmacol. Sci. 23, 206–209.
34. Harris, W.R., Yang, B., Abdollahi, S. & Hamada, Y. (1999) Steric
restrictions on the binding of large metal ions to serum transferrin.
J. Inorg. Biochem. 76, 231–242.
35. Sharma, A.K. & Singh, T.P. (1999) Lactoferrin–metal inter-
actions: first crystal structure of a complex of lactoferrin with a
lanthanide ion (Sm
3+
)at3.4A
˚
resolution. Acta Crystallogr. D55,
1799–1804.
36. Kitamura, T., Gatmaitan, Z. & Arias, I.M. (1990) Serial quanti-
tative image analysis and confocal microscopy of hepatic uptake,
intracellular distribution and biliary secretion of a fluorescent
bile acid analog in rat hepatocyte doublets. Hepatology 12,
1358–1364.
Ó FEBS 2002 Ytterbium transferrin (Eur. J. Biochem. 269) 6089
37. Kotze
´
, A.F., Lueben, H.L., de Leeuw, B.J., de Boer, B.G., Ver-
hoef, J.C. & Jungier, H.E. (1997) N-trimethyl chitosan chloride as
a potential absorption enhancer across mucosal surfaces: In vitro
evaluation in intestinal epithelial cells (Caco-2). Pharmaceut. Res.
14, 1197–1202.
38. Drevets, D. & Campbell, P.A. (1991) Macrophage phagocytosis:
use of fluorescence microscopy to distinguish between extracellular
and intracellular bacteria. J. Immunol. Meth. 142, 31–38.
39. Flulk, W.P., His, B.L. & Stevens, P.J. (1980) Transferrin and
transferrin receptors in carcinoma of the breast. Lancet 2,390–
392.
40. Bernstein, L.R. (1998) Mechanisms of therapeutic activity for
gallium. Pharmacol. Rev. 50, 665–682.
41. Harris, W.R. (1998) Binding and transport of nonferrous metals
by serum transferrin. Struct. Bonding 92, 122–162.
SUPPLEMENTARY MATERIAL
The following material is available from ck-
wellpublishing.com/products/journals/suppmat/EJB/
EJB3326/EJB3326sm.htm
Fig. S1. The effect of pH on the binding of Yb
3+
to apo-Tf.
6090 X l. Du et al. (Eur. J. Biochem. 269) Ó FEBS 2002