Báo cáo Y học: Changes in ultrastructure and the occurrence of permeability transition in mitochondria during rat liver regeneration ppt
Bạn đang xem bản rút gọn của tài liệu. Xem và tải ngay bản đầy đủ của tài liệu tại đây (362.42 KB, 9 trang )
Changes in ultrastructure and the occurrence of permeability
transition in mitochondria during rat liver regeneration
Ferruccio Guerrieri
1,
*, Giovanna Pellecchia
1
, Barbara Lopriore
1
, Sergio Papa
1
, Giuseppa Esterina Liquori
2
,
Domenico Ferri
2
, Loredana Moro
3
, Ersilia Marra
3
and Margherita Greco
3
1
Department of Medical Biochemistry and Biology, University of Bari, Italy;
2
Department of Zoology, Laboratory of Histology and
Comparative Anatomy, University of Bari, Italy;
3
Center for the Study of Mitochondria and Energy Metabolism (CNR) Bari, Italy
Mitochondrial bioenergetic impairment has been found in
the organelles isolated from rat liver during the prereplicative
phase of liver regeneration. To gain insight into the mech-
anism underlying this impairment, we investigated mito-
chondrial ultrastructure and membrane permeability
properties in the course of liver regeneration after partial
hepatectomy, with special interest to the role played by Ca
2+
in this process. The results show that during the first day after
partial hepatectomy, significant changes in the ultrastructure
of mitochondria in situ occur. Mitochondrial swelling and
release from mitochondria of both glutamate dehydrogenase
and aspartate aminotransferase isoenzymes with an increase
in the mitochondrial Ca
2+
content were also observed.
Cyclosporin-A proved to be able to prevent the changes in
mitochondrial membrane permeability properties. At 24 h
after partial hepatectomy, despite alteration in mitochon-
drial membrane permeability properties, no release of cyto-
chrome c was found. The ultrastructure of mitochondria,
the membrane permeability properties and the Ca
2+
content
returned to normal values during the replicative phase of
liver regeneration. These results suggest that, during the
prereplicative phase of liver regeneration, the changes in
mitochondrial ultrastructure observed in liver specimens
were correlated with Ca
2+
-induced permeability transition
in mitochondria.
Keywords: liver regeneration; mitochondria ultrastructure;
membrane permeability; calcium; cyclosporin-A.
Seventy percent partial hepatectomy (PH) induces cell
proliferation until the original mass of the liver is restored
[1]. The tissue regeneration process consists of two phases:
the prereplicative phase, the duration of which depends on
the age of the animal [2,3] as well as on hormones and
dietary manipulation [2,4] and the replicative phase, during
which a sharp increase in DNA synthesis occurs with active
mitosis [2]. In the light of early changes in ATP concentra-
tion found in liver after PH, before activation of cell
proliferation [5,6], mitochondria were investigated as they
are directly involved in the process of liver regeneration
[4,7–16]. Many mitochondrial functions, including oxidative
phosphorylation [11–13] and generation of reactive oxygen
species [14,15], were investigated in some detail in the
prereplicative phase of liver regeneration. In isolated
mitochondria, a decrease in the respiratory control index
[12], ATP synthesis, probably due to a decrease in the
ATPsynthase complex content [14], and glutathione content
[13] as well as an increase in malondialdehyde production
[14] and oxidant production [15] were found. This suggests
the occurrence in the prereplicative phase of liver regener-
ation of a transient mitochondrial oxidative stress in which
mitochondria can also release proteins from the matrix [16].
Despite this, mitochondria recover their functions in the
replicative phase of liver regeneration [12,14–16].
In this paper, we investigated whether and how the
mitochondrial structure can change in the prereplicative
phase of liver regeneration and whether mitochondrial
permeability properties are somehow affected in this phase
of the process. In the prereplicative phase of liver regener-
ation, we found the occurrence of a number of mitochon-
dria with dilated, paled and vacuolized matrix. The isolated
mitochondria showed impairment in membrane permeab-
ility properties, which were prevented by cyclosporin-A
(CsA). An increase in Ca
2+
content was also observed.
Despite alteration in mitochondrial membrane permeability
properties, no release of cytochrome c was found during the
prereplicative phase of liver regeneration. The mitochond-
rial ultrastructure, the membrane permeability properties
and the Ca
2+
content showed normal values during the
replicative phase of liver regeneration when a progressive
recovery of liver mass is observed.
MATERIALS AND METHODS
Partial hepatectomy
Three-month-old male Wistar rats were anaesthetized with
an ether/oxygen mix (at variable ratios) and the median and
left lateral lobes of the liver were excised [12]. After surgery,
the rats were kept on a standard diet until they were
Correspondence to M. Greco, Center for the Study
of Mitochondria and Energy Metabolism CNR BARI,
Via Amendola 165/A I-70126 Bari, Italy.
Fax: + 39 080 5443317, Tel.: + 39 080 5443316,
E-mail:
Abbreviations: AAT, aspartate aminotransferase; CsA, cyclosporin-A;
GDH, glutamate dehydrogenase; PH, partial hepatectomy; EU,
enzyme units.
Enzymes: aspartate aminotransferase (EC 2.6.1.1); glutamate
dehydrogenase (EC 1.4.1.2).
*Note: deceased in November 2000.
(Received 8 February 2002, revised 20 May 2002,
accepted 22 May 2002)
Eur. J. Biochem. 269, 3304–3312 (2002) Ó FEBS 2002 doi:10.1046/j.1432-1033.2002.03010.x
sacrificed. The livers were removed, weighed, and processed
as follow: one-third were cut into sections for electron
microscopy studies and two-thirds were used for the
isolation of mitochondria. Sham-operated rats, obtained
after a small midline abdominal incision without excision of
the liver, were used as a control and killed at 0, 24 and 96 h
after the surgical operation. In all the assays reported, no
difference between sham-operated and rats that did not
receive any surgical operation was observed.
All operations were carried out under sterile conditions.
The animals received humane care and the study was
approved by the State Commission on animal experimen-
tation.
Electron microscopy
Ultrastructural morphology of mitochondria was deter-
mined by electron microscopy. Liver specimens from
control rats and from rats at 24 and 96 h after PH, were
fixed with 4% glutaraldehyde in 0.1
M
sodium cacodylate
buffer pH 7.4 for 4 h at 4 °C. After fixation and an
overnight wash in sodium cacodylate buffer at 4 °C, the
specimens were postfixed with 1% osmium tetroxide in
sodium cacodylate buffer for 1 h at 4 °C, dehydrated in
alcohol and embedded in araldite resin (Taab Laboratories
Equipment LTD, Aldermaston, Berkshire, England) and
semithin sections (1 lm) were removed for optical micros-
copy. Ultra-thin sections were mounted on copper mesh
grids and stained with uranyl acetate and lead citrate,
according to Reynolds [17], before examination with a
Zeiss EM 109 electron microscope. All tissue samples were
first inspected on semithin sections by light microscopy. The
ultrastructural morphology of mitochondria was evaluated
on five rats for each experimental group (control, 24 and
96 h after PH) and 10 randomly selected electron micro-
graphs of a hepatic lobule were observed in each animal
(7000· magnification).
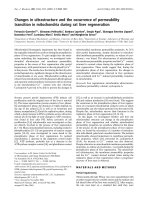
Five morphological groups of mitochondria were defined
and divided into two types according to the observed
conformation: normal and altered (*) (Fig. 1). For each
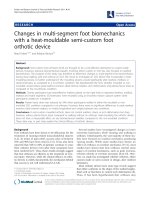
Fig. 1. Electron micrographs of normal and altered (*) mitochondria during liver regeneration. Representative electron micrographs of normal and
altered (*) mitochondria. (A) Detail of hepatocyte in control rat. (B–D) Detail of hepatocytes at 24 h after PH, showing normal and altered (*)
mitochondria. (E) Detail of hepatocyte at 96 h after PH. Bars ¼ 0.5 lm.
Ó FEBS 2002 Mitochondria and liver regeneration (Eur. J. Biochem. 269) 3305
animal the morphology of about 600 mitochondria in a
hepatic lobule was examined.
Preparations of cytosolic fraction and mitochondria
Mitochondria were prepared according to Bustamante et al.
[18] using a medium containing 0.25
M
sucrose and 5 m
M
Tris/HCl (pH 7.4) as isolation buffer. After precipitation of
mitochondria, the supernatant was used for preparation of
cytosol by ultracentrifugation at 105 000 g for 1 h. The final
supernatant was used as cytosolic fraction. In the prepara-
tions used for measurements of mitochondrial Ca
2+
content, 1.6 l
M
ruthenium red and 1 m
M
EDTA were
added in the isolation buffer to restrict Ca
2+
movement
during the subfractionation technique. As preliminary
analyses showed that there was no statistically significant
difference in the Ca
2+
content of mitochondria whether the
buffers used for the subfractionation procedure contained
either 1 m
M
EDTA alone, or 1 m
M
EDTA and 1.6 l
M
ruthenium red or 1 m
M
EGTA, for all subsequent prepa-
rations, 1 m
M
EDTA and 1.6 l
M
ruthenium red were
included in the subfractionation buffers.
Protein concentration was determined using the Bio-Rad
kit (Bio-Rad Laboratories Inc., Milan, Italy).
Swelling assay
To monitor the mitochondrial swelling properties in sucrose
solution, mitochondria (0.5 mg proteinÆmL
)1
) were suspen-
ded in a swelling medium [5 m
M
succinate/Tris, 10 m
M
Mops/Tris, 0.2
M
sucrose, 1 m
M
phosphate/Tris, 2 l
M
rotenone and 1 lgÆmL
)1
oligomycin (pH 7.4)].
The absorbance was followed at 540 nm and at 25 °C, as
described previously [19], using a spectrophotometer
equipped with magnetic stirring and thermostatic control.
Where indicated, 1 l
M
CsA (Sandoz Prodotti Farmaceutici,
Milano, Italy) was added to the reaction medium.
Matrix proteins release assay
For the assay of the in vitro release of matrix proteins,
mitochondria (10 mg proteinÆmL
)1
) were suspended in the
swelling medium, above reported, and incubated at 25 °C
for 8 min. After incubation, the mitochondria were preci-
pitated by centrifugation at 8000 g for 40 s. The superna-
tants were then centrifuged for 10 min at 10 000 g.Five
microliters of the final supernatants were used for SDS/
PAGE analysis with a linear gradient of polyacrylamide
(10–15%) [20]. After the run, the gel was stained with
Coomassie Brilliant Blue. Where indicated, mitochondrial
aspartate-aminotransferase [16] (AAT) or glutamate-dehy-
drogenase (GDH) [21] activities were determined in the final
supernatants. When indicated, CsA (1.7 nmolÆmg
)1
mito-
chondrial proteins) was added. The activities of the two
enzymes were also determined in the mitochondrial and
cytosolic fractions, and in the whole liver homogenate. The
enzyme activity of mitochondrial AAT in the cytosol was
determined as described by Greco et al. [16]. Briefly, two
aliquots of either cytosolic fraction or whole homogenate
were incubated separately at 37 °Cand70°C for 15 min,
then AAT activity in both samples was determined. The
AAT activity of the sample incubated at 37 °Cwastakento
be that of both isoenzymes (mitochondrial and cytosolic
AAT), whereas that of the sample incubated at 70 °Cwas
assumed to be solely due to cytosolic isoenzyme. In fact,
under conditions where the cytosolic AAT was stable, there
was a thermal instability of mitochondrial AAT at 70 °C
[22]. The activity of mitochondrial AAT was taken as the
difference between the two values.
Determination of cytochrome
c
content
The amount of cytochrome c in cytosol and mitochondria
during rat liver regeneration was determined by SDS
polyacrylamide gel electrophoresis analysis, as described by
Schaegger et al. [23]. Mitochondrial (20 lgofprotein)or
cytosolic (90 lg of protein) preparations were loaded onto an
SDS/polyacrylamide gel. Gels were then incubated in a
medium containing tetrametylbenzidine in 10% isopropanol
and 7% acetic acid. After 10 min, H
2
O
2
30% was added and,
after 1–2 min, the greenish-blue bands of heme-containing
peptides, among which was cytochrome c, were developed, as
described by Broger et al. [24]. The bands were analyzed by
laser densitometry at 595 nm, using a CAMAG TLC
scanner II densitometer (Merck–Hitachi). Commercially
purified horse cytochrome c (Sigma–Aldrich) was used as
standard.
Determination of mitochondrial Ca
2+
content
For determination of the endogenous Ca
2+
content,
mitochondria (0.1 mg proteinÆmL
)1
) were suspended in
0.25
M
sucrose in the presence of 40 l
M
Arsenazo III
(Sigma–Aldrich, Milan, Italy). The absorbance change at
675–685 nm, was monitored by dual wavelength spectro-
photometry. After reading a baseline for 1 min, Triton
X-100 (0.2%) plus 3.3 l
M
SDS were added to disrupt the
mitochondrial membranes [25]. The absorbance change was
calibrated by addition of standard aliquots of Ca
2+
to the
medium. A standard curve was obtained from the pooled
results of five independent series of determinations and used
for analysis of mitochondrial Ca
2+
content, which for the
control was 8 ± 0.2 nmol per mg mitochondrial protein.
No statistically significant differences in Ca
2+
content were
observed when the mitochondrial preparation was per-
formed either in the presence or in the absence of ruthenium
red and EDTA in isolation buffer.
Statistical analysis
Data are reported as the mean ± SEM of five experiments
performed using liver sections or mitochondria and cytosol
obtained from five different animals for each experimental
group (control, 24 and 96 h after PH). Statistical analysis
was performed using the Student’s t-test.
RESULTS
Mitochondrial ultrastructure during liver regeneration
after PH
In order to find out whether and how mitochondria
structure changes occur during liver regeneration, 10
randomly selected electron micrographs of the same mag-
nification (7000·) were examined from one hepatic lobule of
five rats for each experimental group (control, 24 and 96 h
3306 F. Guerrieri et al. (Eur. J. Biochem. 269) Ó FEBS 2002
after PH), and the morphology of about 600 mitochondria
in a hepatic lobule of each animal was analyzed. The typical
mitochondrial morphology of control liver is shown in
Fig. 1A. Liver mitochondria of rats at 24 h after PH
were quite variable in morphology and ultrastructure
(Fig. 1B–D). Three different mitochondrial morphologies
were observed: (a) normal mitochondria (Fig. 1B) charac-
terized by the same basic architecture of the typical liver
mitochondria with a folded internal membrane and a dense
matrix; (b) altered mitochondria (*) with a marked decrease
in the area of the inner membrane, reduction in the number
of cristae, destructurization of the matrix compartment, a
dilated and paled matrix, lack of dense granules (Fig. 1C);
and (c) altered mitochondria (*) with clear vacuolization of
the matrix compartment (Fig. 1D). No evident rupture of
mitochondrial outer membrane integrity was observed in
altered mitochondria. At 96 h after PH (Fig. 1E), mito-
chondria were nearly normal in morphology, cristae-rich,
and with an electron-dense matrix. Quantitation of normal
and altered mitochondria in control liver and in liver at
24 and 96 h after PH was performed. The majority of liver
mitochondria from control rats presented a normal mor-
phology; only a small fraction (3.0 ± 0.6%) belonged to
the altered type. A large proportion (41.0 ± 6.6%) of
mitochondria from liver at 24 h after PH showed alterations
in mitochondrial ultrastructure. At 96 h after PH, only a
small fraction (3.0 ± 0.05%) belonged to the altered type.
The differences between the number of altered mitochon-
dria at 24 h after PH and the number of altered mito-
chondria in control rats were statistically significant
(P < 0.0001). Furthermore, in liver at 24 h after PH the
total number of mitochondria, counted in 10 randomly
selected electron micrographies of a hepatic lobule, was less
than the total number present in either control liver (11%
decrease; P ¼ 0.001) or in liver at 96 h after PH (17%
decrease; P < 0.001). The decrease in the mitochondria
number corresponds to a decrease in the mitochondrial
proportion of the cell volume at 24 h after PH. This was
correlated with a decrease in the activity of the mitochon-
drial marker enzymes GDH and mAAT in the total liver
homogenate at 24 h after PH (15% and 24% decrease
for GDH and mAAT, respectively). Moreover, in the
hepatocytes of liver at 24 h after PH, a small increase in
the number of lysosomes and the presence of autophago-
somes were also observed (data not shown). No significant
change in the number of apoptotic nuclei was found with
respect to control liver and liver at 96 h after PH (data not
shown).
Mitochondrial membrane permeability during liver
regeneration after PH
As the ultrastructure of 40% of liver mitochondria at 24 h
after PH is suggestive of changes in membrane permeability
of the organelles, we followed the swelling of mitochondria
isolated during liver regeneration (0, 24, 96 h after PH) in
isotonic sucrose medium supplemented with succinate and
phosphate. Mitochondria were suspended in the swelling
medium and the absorbance of the mitochondrial suspen-
sion as a function of time was monitored either in the
absence or in the presence of CsA (1 l
M
), the specific
inhibitor of the mitochondrial transition pore [26]. Mito-
chondria isolated from control rats and at 96 h after PH,
were found to swell at a low rate and extent in about 20 min
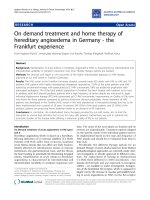
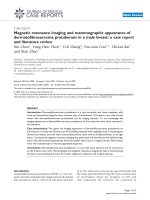
(Fig. 2, traces a and c); mitochondria isolated at 24 h after
PH showed, in contrast, a high rate and extent of swelling
(Fig. 2, trace b). CsA was found to prevent swelling in every
case (Fig. 2, traces a¢,b¢,c¢). Liver mitochondria isolated
from sham-operated rats at 0, 24 and 96 h after surgery
were found to swell poorly in a manner similar to that found
for control liver mitochondria (data not shown).
The CsA capability to prevent mitochondrial swelling is
indicative of the occurrence of permeability transition in
mitochondria during the prereplicative phase of liver
regeneration. Thus we checked whether the isolated mito-
chondria could release matrix proteins into the external
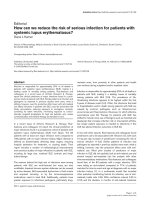
medium. Incubation of rat liver mitochondria, isolated at
24 h after PH, at 25 °C for 8 min in the swelling medium,
resulted in an increased and nonspecific release of mito-
chondrial proteins in the suspension medium (Fig. 3A, lane
c) compared to mitochondria isolated from control rats
(Fig. 3A, lane b) and mitochondria isolated at 96 h after PH
(Fig. 3A, lane d), as revealed by SDS/PAGE of the
supernatants obtained after precipitation of mitochondria
by centrifugation. This release of proteins at 24 h after PH
was associated with the appearance, in the supernatant, of
typical matrix enzyme activity, such as GDH (3.5 ± 0.26-
fold increase vs. control mitochondria; 23 ± 2.5% of the
total mitochondrial activity) and AAT (3.15 ± 0.23-fold
increase vs. control mitochondria; 5.1 ± 0.1% of the total
mitochondrial activity) (Fig. 3B, empty columns b). CsA,
added to the mitochondrial suspensions before incubation,
inhibited the release of enzyme activities (Fig. 3B, filled
columns b). At 96 h after PH, the activities of the enzymes
released in the supernatant (1.8 ± 0.1 and 0.8 ± 0.04% of
the total mitochondrial activity of GDH and AAT,
respectively), were as low as those found in the supernatant
Fig. 2. Absorbance changes at 540 nm of rat liver mitochondria isolated
during liver regeneration. Mitochondria (0.5 mg proteinÆmL
)1
)isolated
at 0, 24, 96 h after PH were suspended in swelling medium and the
absorbance change at 540 nm at 25 °C was monitored. Trace a:
mitochondria isolated before PH. Trace a¢:asainthepresenceof1l
M
CsA. Trace b: mitochondria isolated 24 h after PH. Trace b¢:asbinthe
presence of 1 l
M
CsA. Trace c: mitochondria isolated 96 h after PH.
Trace c¢: as c in the presence of 1 l
M
CsA.
Ó FEBS 2002 Mitochondria and liver regeneration (Eur. J. Biochem. 269) 3307
of mitochondria isolated from control rats (2.2 ± 0.1 and
0.8 ± 0.05% of the total mitochondrial activity of GDH
and AAT, respectively) (Fig. 3B, columns a and c).
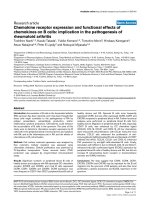
As shown in Fig. 4, the total activities of the matrix
enzymes GDH and AAT were found to decrease in
mitochondria isolated 24 h after PH, with respect to
mitochondria isolated from control rats (Fig. 4, columns
b) (3.07 ± 0.85-fold decrease for GDH and 1.67 ± 0.3-
fold decrease for AAT). An increase in enzymatic activities
in the corresponding cytosol (Fig. 4, columns b¢)with
respect to cytosol isolated from control rats (Fig. 4, columns
a¢) was observed (4.75 ± 0.59-fold increase for GDH and
2.28 ± 0.13-fold increase for AAT). Mitochondria and
cytosols obtained 96 h after PH show a pattern similar to
that of mitochondria and cytosols obtained from control
rats (Fig. 4, columns c, c¢).
The amount of cytochrome c in mitochondria did not
change during liver regeneration after PH (Fig. 4B;
P > 0.1). Accordingly, no release of cytochrome c was
observed in cytosols isolated from liver control and liver at
24 and 96 h after PH (Fig. 4B).
Ca
2+
content in mitochondria during liver regeneration
after PH
The occurrence of mitochondrial permeability transition is
due to an increase in mitochondrial Ca
2+
content [27].
Consistently, Ca
2+
pulse to mitochondria isolated before
PH or from sham-operated rats and suspended in an
isotonic sucrose medium supplemented with succinate and
phosphate, caused mitochondrial swelling (Fig. 5A), which
reflects a change in mitochondrial membrane permeability
[19]. Such a mitochondrial swelling was inhibited by the
addition to the mitochondrial suspension of CsA (Fig. 5A),
the specific inhibitor of the permeability transition pore of
mitochondria [26]. This change in permeability of the inner
mitochondrial membrane due to Ca
2+
loading was accom-
panied by a nonspecific release of mitochondrial proteins in
the suspension medium [28] with the appearance, in the
supernatants, of typical matrix enzyme activities, such as
mitochondrial AAT, the release of which was also inhibited
by the addition of CsA (Fig. 5B).
As the mitochondrial permeability transition is dependent
on the Ca
2+
content of mitochondria, we checked whether
the mitochondrial Ca
2+
content could change during liver
regeneration (Fig. 6). The mitochondrial Ca
2+
content in
sham-operated rats was about 8 ± 0.2 nmolÆmg
)1
protein;
this amount remained constant up to 6 h after PH. No
difference in liver mitochondrial Ca
2+
content was observed
between sham-operated rats and animals that did not
receive any surgical intervention (data not shown). A large
increase in Ca
2+
content(17.7±0.4nmolÆmg
)1
protein)
wasfoundat24hafterPH.TheCa
2+
contentat72–96h
after PH was the same as the control (Fig. 6). The increase
in liver weight after PH showed a biphasic pattern. A low
rate of increase was measured up to 24 h. After this interval
the liver weight increased linearly with the time (Fig. 6) [16].
DISCUSSION
Following PH, the remaining mature hepatocytes enter a
complex process, known as liver regeneration, which after
an initial prereplicative phase reconstitutes the original mass
of the liver [1,2]. The residual hepatocytes re-enter the cell
cycle while the normal homeostatic mechanisms that couple
cell cycle re-entry to cell death are suspended [29,30].
The present study shows that after surgical removal of
two-thirds of the mass of rat liver, mitochondria in the
Fig. 3. Release of matrix proteins from rat liver mitochondria isolated during liver regeneration. (A,B) Mitochondria (10 mg proteinÆmL
)1
)were
suspended in the swelling medium and incubated at 25 °C for 8 min. After incubation, mitochondria were precipitated by centrifugation at 8000 g
for 40 s. The supernatants were, then, centrifuged for 10 min at 10 000 g. (A) Five microliters of the final supernatant was analyzed by SDS/PAGE;
lane a, standard M
r
proteins; lane b, supernatant from control mitochondria; lane c, supernatant from mitochondria isolated 24 h after PH; lane d,
supernatant from mitochondria isolated 96 h after PH. (B) GDH and AAT activities released in the supernatants of control mitochondria (columns
a), mitochondria isolated 24 h after PH (empty columns b), mitochondria isolated 96 h after PH (empty columns c). The enzyme activities in the
presence of 1.7 nmolÆmg
)1
protein CsA added to the incubation medium are reported as filled columns (b and c). The data are the means (± SEM)
of five different mitochondrial preparations. The differences between both GDH and AAT activity at 24 h after PH and the same activities in the
supernatants of control mitochondria are statistically significant (*P<0.001).
3308 F. Guerrieri et al. (Eur. J. Biochem. 269) Ó FEBS 2002
Fig. 4. Glutamate-dehydrogenase, mitochondrial aspartate amino-
transferase activities and cytochrome c content in mitochondria and
cytosol prepared during liver regeneration. (A) Mitochondrial AAT and
GDH activities were measured in mitochondria and cytosol isolated
from liver control (columns a, a¢), at 24 h (columns b, b¢)and96h
(columns c, c¢) after PH. The data reported are expressed as lmol of
productÆmin
)1
per mg of mitochondrial or cytosolic proteins and are
the means (± SEM) of five different preparations. The differences
between GDH and AAT activity in mitochondria and cytosols isolated
at 24 h after PH and the enzyme activities in mitochondria and cyto-
sols isolated from control rats or at 96 h after PH are statistically
significant (*P< 0.001). (B) Mitochondrial (20 lg protein) and cyto-
solic (90 lg protein) preparations were loaded on an SDS/polyac-
rilamide gel. Gels were then incubated in a medium containing
tetramethylbenzidine in 10% isopropanol and 7% acetic acid. After
10 min, H
2
O
2
(30% v/v) was added to reveal cytochrome c. The bands
were analyzed by laser densitometry at 595 nm m, mitochondria; c,
cytosol. (C) control mitochondria or cytosol; 24 h, mitochondria or
cytosol at 24 h after PH; 96 h, mitochondria or cytosol at 96 h after
PH;S,standardcytochromec (500 ng). In the bottom panel,
mitochondrial cytochrome c (cyt c) content values are reported as
percentage of those detected in control mitochondria, taken as 100.
The values reported are the means (± SEM) of three different
preparations.
Fig. 5. Ca
2+
-induced swelling and externally release of aspartate-ami-
notransferase in control liver mitochondria suspended in swelling
medium. (A) Where indicated, isolated rat liver mitochondria (0.5 mg
proteinÆmL
)1
) were added to the isotonic sucrose medium (swelling
medium) reported in Materials and methods and the absorbance
change at 540 nm at 25 °C was monitored. After 4 min, 150 l
M
CaCl
2
was added. The dotted line shows the same experiment run in the
presence of 1 l
M
CsA added to the suspension medium before mito-
chondria. (B) AAT activity in the supernatant of liver mitochondria
incubated 8 min in the swelling medium (column a) or in the swelling
medium after a Ca
2+
pulse (70 nmolÆmg protein
)1
)(columnb).
Column c: as column b in the presence of CsA (1.7 nmolÆmg pro-
tein
)1
). The data reported are means (± SEM) of five different
experiments. The differences between AAT activity in the presence of
Ca
2+
and AAT activity in the absence of Ca
2+
pulse are statistically
significant (*, P < 0.001).
Fig. 6. Mitochondrial Ca
2+
content and recovery of liver mass during
liver regeneration. The mass of the liver at different time points after
PH (open symbols) is expressed as a percentage of the weight of the
liver of sham-operated rats (11 ± 1.1 g). For determination of Ca
2+
content at different time points after PH (closed symbols), mito-
chondria (0.1 mgÆprotein mL
)1
) were suspended in 0.25
M
sucrose in
thepresenceof40l
M
Arsenazo III and the absorbance change at
675–685 nm was monitored. After reading a baseline for 1 min,
Triton-X100 (0.2%) plus 3.3 l
M
SDS were added. In the mito-
chondrial preparation, 1.6 l
M
ruthenium red and 1 m
M
EDTA were
added to the isolation buffer. The difference between mitochondrial
Ca
2+
content at 24 h after PH and control rats is statistically signi-
ficant (*, P < 0.001).
Ó FEBS 2002 Mitochondria and liver regeneration (Eur. J. Biochem. 269) 3309
remaining hepatocytes undergo, in the first 24 h after
hepatectomy, i.e. in the prereplicative phase, ultrastructural
changes. These are associated with enhancement of the
mitochondrial Ca
2+
content and increase of CsA-sensitive
permeability to sucrose of the mitochondria isolated from
the residual liver mass.
Analysis of the structural and functional state of mito-
chondria in the liver mass which is reconstituted in the
successive 96 h, shows, on the other hand, normal mito-
chondrial ultrastructure, return of mitochondrial Ca
2+
content and CsA-sensitive sucrose permeability to the
normal values observed in the liver before hepatectomy or
in sham-operated rats.
Previous electron microscopy studies [15,31–33] had
revealed changes in the residual hepatocytes after PH but
less attention was paid to elucidating the correlation
between the changes occurring in the ultrastructure of
mitochondria and biochemical parameters during liver
regeneration. The present electron microscopy study shows
that the general organization of the mitochondrial inner
membrane cristae into the typical transverse alignment in
control animals was absent in about 40% of the mitochon-
dria in the hepatocytes at 24 h after PH. These mitochon-
dria were characterized by highly fractured and degenerated
cristae and a clear vacuolation. This suggests that the
decrease in ATP synthesis rate observed in mitochondria
isolated during the prereplicative phase of liver regeneration
[12] is probably a result of the decrease in the surface area of
the inner membrane.
The ultrastructural changes observed in liver mito-
chondria at 24 h after PH are consistent with the changes
found in the membrane permeability properties of the
mitochondria isolated from the residual liver mass. The
in vitro experiments show, in fact, that mitochondria
isolated from rat liver at 24 h after PH exhibit high CsA-
sensitive permeability to sucrose. It has been suggested that
permeabilization of the inner mitochondrial membrane
could be required for the turnover of matrix proteins [28]. A
release of mitochondrial AAT into the extramitochondrial
phase has been observed following oxygen radical injury of
mitochondria during hypoxic liver reoxygenation [34]. Our
data show a release of the mitochondrial matrix enzymes
GDH and AAT into the cytosol of liver at 24 h after PH. A
CsA-sensitive release of the same matrix enzymes can be
observed in vitro, following swelling of mitochondria,
isolated 24 h after PH. This suggests an involvement of
the inner mitochondrial membrane transition pore in the
release of matrix enzymes in vivo.
Our study shows that, during the prereplicative phase of
liver regeneration, the mitochondrial Ca
2+
content increa-
ses, reaching a maximum (17.75 nmolÆmg
)1
of protein) at
24 h after PH, when oxidative alteration of mitochondria is
also observed [14,15]. Following PH, an increase in cell
Ca
2+
content has been observed during the prereplicative
phase of liver regeneration [35]. HGF, the most important
in vitro mitogen for primary hepatocytes and whose plasma
level increases within 1 h upon PH [29,36], has been shown
to induce Ca
2+
entry across the hepatocyte plasma
membrane [37]. Furthermore, some hormones, that are
known to modulate liver regeneration acting as mitogens or
comitogens [29,36], raise the liver cytosolic Ca
2+
concen-
tration and cause an increase in the mitochondrial matrix
volume as a consequence of Ca
2+
entry from cytosol into
mitochondria [38].
Both mitochondrial Ca
2+
accumulation and oxida-
tive stress increase the probability that changes in the
mitochondrial membrane permeability occur [25,38,39].
Oxidative stress, Ca
2+
uptake and opening of the transition
pore in mitochondria are signals for cell death [40–42].
However, only a transient small increase in the number of
apoptotic cells ( 5%) has been reported at 1 h after PH
[15]. Three to six hours after PH, the level of apoptotic cells
was as low as that observed in control liver and no increase
in apoptosis was observed at 24 h after PH [15]. The present
ultrastructural analysis does not show any detectable
alteration in mitochondrial outer membrane integrity at
24 h after PH. The increase in the number of lysosomes,
even if at a low extent, the presence of autophagosomes and
the reduction in the number of mitochondria that we
observe in hepatocytes at 24 h after PH, suggest that
autophagic processes could occur in the prereplicative phase
of liver regeneration.
It has been proposed that if the permeability transition
occurs only for brief periods, its activity would not create
survival problems for mitochondria and cells [43]. The
mitochondria in intact cells may undergo permeability
transition and swelling in a fully reversible manner without
progressing to cell death [44–46]. Furthermore, it has been
observed that mitochondrial swelling is not sufficient to
affect cytochrome c release, and thus to trigger apoptosis
processes [45]. We show here that no release of cytochrome c
occurs in the prereplicative phase of liver regeneration. This
finding is in agreement with the electron microscopy
observations showing that neither evident breakage of the
mitochondrial outer membrane nor increased number of
apoptotic nuclei are present at 24 h after PH. We suggest
that the mitochondrial permeability transition occurring in
the prereplicative phase of liver regeneration is a transient
event and that, with the exception of irreparably damaged
mitochondria that could be eliminated by autophagy, a
great proportion of mitochondria undergoing permeability
transition recover in a fully reversible manner. Future
studies will be needed to ascertain the fate of mitochondrial
subpopulations during liver regeneration.
ACKNOWLEDGEMENT
This work was partially supported by a grant within the National
Research Project PRIN: ÔBioenergetics and Membrane TransportÕ of
Murst, Italy.
REFERENCES
1. Michalopoulos, G.K. (1990) Liver regeneration: molecular
mechanisms of growth control. FASEB J. 4, 176–187.
2. Steer, C.J. (1995) Liver regeneration. FASEB J. 9, 1396–1400.
3. Guerrieri,F.,Kalous,M.,Capozza,G.,Muolo,L.,Drahota,Z.&
Papa, S. (1994) Age dependent changes in mitochondrial F
0
F
1
-
ATP synthase in regenerating rat liver. Biochem. Mol. Biol. Int. 33,
117–129.
4. Guerrieri, F., Nicoletti, C., Adorisio, E., Caraccio, G., Leonetti, P.,
Zanotti, F. & Cantatore, P. (2000) Correlation between decreased
expression of mitochondrial F
0
F
1
-ATP synthase and low
regenerating capability of the liver after partial hepatectomy in
hypothyroid rats. J. Bioenerg. Biomembr. 32, 183–191.
3310 F. Guerrieri et al. (Eur. J. Biochem. 269) Ó FEBS 2002
5. Ove, P., Takai, S., Umeda, T. & Lieberman, I. (1967) Adenosine
triphosphate in liver after partial hepatectomy and acute stress.
J. Biol. Chem. 242, 4963–4971.
6. Ngala-Kenda, J.F., De Hamptinne, B. & Lambotte, L. (1984)
Role of metabolic overload in the initiation of DNA synthesis
following partial hepatectomy in the rat. Eur. Surg. Res. 16, 294–
302.
7. Buckle, M., Guerrieri, F. & Papa, S. (1985) Changes in activity
and F
1
content of mitochondrial ATPase in regenerating rat liver.
FEBS Lett. 188, 345–351.
8. Buckle, M., Guerrieri, F., Pazienza, A. & Papa, S. (1986) Studies
on polypeptide composition, hydrolytic activity and proton con-
duction of mitochondrial F
0
F
1
–H
+
-ATPase in regenerating rat
liver. Eur. J. Biochem. 155, 439–445.
9. Nagino, M., Tanaka, M., Nishikimi, M., Nimura, J., Kubota, H.,
Kanai, M., Kato, T. & Ozawa, T. (1989) Stimulated rat liver
mitochondrial biogenesis after partial hepatectomy. Cancer Res.
49, 4913–4918.
10. Tsai, J.L., King, K.L., Chang, C.C. & Wie, J.H. (1992) Changes of
mitochondrial respiratory functions and superoxide dismutase
activity during liver regeneration. Biochem. Int. 28, 205–217.
11. Inomoto, T., Tanaka, A., Mori, S., Jin, M.B., Sato, B.,
Yanabu, N., Tokuka, A., Kitai, T., Ozawa, K. & Yamaoka, Y.
(1994) Changes in the distribution of the control of the
mitochondrial oxidative phosphorylation in regenerating rabbit
liver. Biochem. Biophys. Acta 1188, 311–317.
12. Guerrieri,F.,Muolo,L.,Cocco,T.,Capozza,G.,Turturro,N.,
Cantatore, P. & Papa, S. (1995) Correlation between rat liver
regeneration and mitochondrial energy metabolism. Biochem.
Biophys. Acta 1272, 95–100.
13. Vendemmiale, G., Guerrieri, F., Grattagliano, I., Didonna, D.,
Muolo, L. & Altomare, E. (1995) Mitochondrial oxidative phos-
phorylation and intracellular glutathione compartmentation dur-
ing rat liver regeneration. Hepatology 21, 1450–1454.
14. Guerrieri, F., Vendemiale, G., Grattagliano, I., Cocco, T.,
Pellecchia,G.&Altomare,E.(1999)Mitochondrial oxidative
alterations following partial hepatectomy. Free Rad. Biol. Med. 26,
34–41.
15. Lee,F.Y.J.,Li,Y.,Zhu,H.,Yang,S.Q.,Lin,H.Z.,Trush,M.&
Diehl,A.M.(1999)Tumornecrosisfactorincreasesmitochondrial
oxidant production and induces expression of uncoupling protein-
2 in the regenerating rat liver. Hepatology 29, 677–687.
16. Greco, M., Moro, L., Pellecchia, G., Di Pede, S. & Guerrieri, F.
(1998) Release of matrix proteins from mitochondria to cytosol
during the prereplicative phase of liver regeneration. FEBS Lett.
427, 179–182.
17. Reynolds, E.S. (1963) The use of lead citrate at high pH as electron
opaque stain in electron microscopy. J. Cell. Biol. 40, 395–414.
18. Bustamante, E., Soper, J.W. & Pedersen, P.L. (1977) High yield
preparative method for isolation of rat liver mitochondria. Anal.
Biochem. 80, 401–408.
19. Petronilli, V., Cola, C., Massari, S., Colonna, R. & Bernardi, P.
(1993) Physiological effectors modify voltage sensing by the
Cyclosporin A-sensitive permeability transition pore of mito-
chondria. J. Biol. Chem. 268, 21939–21945.
20. Laemmli, U.K. (1970) Cleavage of structural proteins during
the assembly of the head of Bacteriophage T4. Nature 227,
680–685.
21. Bitensky, M.W., Yelding, L.K. & Tomkins, G.M. (1965) The
effect of allosteric modifiers on the rate of denaturation of
glutammate dehydrogenase. J. Biol. Chem. 240, 1077–1082.
22. Parli, J.A., Godfrey, D.A. & Ross, C.D. (1987) Separate enzy-
matic microassays for aspartate aminotransferase isoenzymes.
Biochem. Biophys. Acta 925, 175–184.
23. Schaegger, H. & von Jagow, G. (1991) Blue native electrophoresis
for isolation of membrane protein complexes in enzymatically
active form. Anal. Biochem. 199, 223–231.
24. Broger, C., Nelecz, M.J. & Azzi, A. (1980) Interaction of cyto-
chrome c with cytochrome bc
1
complex of respiratory chain.
Biochim. Biophys. Acta 592, 519–527.
25. Zaidan, E. & Sims, N.R. (1994) The calcium content of
mitochondria from brain subregions following short-term
forebrain ischemia and recirculation in the rat. J. Neurochem. 63,
1812–1819.
26. Crompton, M., Ellinger, H. & Costi, A. (1988) Inhibition by
Cyclosporin A of a Ca
2+
-dependent pore in heart mitochondria
activated by inorganic phosphate and oxidative stress. Biochem.
J. 255, 357–360.
27. Gunter, T.E. & Pfeiffer, D.R. (1990) Mechanisms by
which mitochondria transport calcium. Am. J. Physiol. 258,
C755–C786.
28. Igbavboa, V., Zwizinski, C.W. & Pfeiffer, D.R. (1989) Release of
mitochondrial matrix proteins through a Ca
2+
-requiring,
cyclosporin–sensitive pathway. Biochem. Biophys. Res. Commun.
161, 619–623.
29. Michalopoulos, G.K. & De Frances, M.C. (1997) Liver
regeneration. Science 276, 60–66.
30. Diehl, A.M. (1998) Role of CCAAT/enhancer-binding proteins in
regulation of liver regenerative growth. J. Biol. Chem. 273, 30843–
30846.
31. Jordan, S.W. (1964) Electron microscopy of hepatic regeneration.
Exp. Mol. Pathol. 3, 183–200.
32. Becker, F.F. & Lane, B. (press) P. (1966) Regeneration of mam-
malian liver: evidence of role of cytoplasmic alterations in pre-
paration for mitosis. Am. J. Pathol. 49, 227–235.
33. Gutierrez-Salinas, J., Aranda-Fraustro, A., Paredes-Diaz, R. &
Hernandez-Munoz, R. (1996) Sucrose administration to partially
hepatectomized rats: a possible model to study ethanol-induced
inhibition of liver regeneration. Int. J. Biochem. Cell Biol. 28,
1007–1016.
34. Shimizu, S., Kamiike, W., Hatanaka, N., Nishimura, M.,
Miyata, M., Inane, T., Yoshida, Y., Tagawa, K. & Matsuda, H.
(1994) Enzyme release from mitochondria during reoxygenation
of rat liver. Transplantation 57, 144–148.
35. Takahasi, H. & Yamaguchi, M. (1996) Enhancement of plasma
membrane (Ca
2+
-Mg
2+
)–ATPase activity in regenerating rat
liver: involvement of endogenous activating protein regucalcin.
Mol. Cell. Biochem. 162, 133–138.
36. LaBrecque, D. (1994) Liver regeneration: a picture emerges from
the puzzle. Am. J. Gastroent. 89, S86–S96.
37. Baffy, G., Yang, L., Michalopoulos, G.K. & Williamson, J.R.
(1992) Hepatocyte growth factor induces calcium mobilization
and inositol phosphate production in rat hepatocytes. J. Cell
Physiol. 153, 332–339.
38. Davidson, A.M. & Halestrap, A.P. (1990) Partial inhibition by
cyclosporin A of the swelling of liver mitochondria Ôin vivoÕ and
Ôin vitroÕ induced by sub-micromolar [Ca
2+
], but not by butyrate.
Biochem. J. 268, 147–152.
39. Halestrap, A.P., Kerr, P.M., Javadov, S. & Woodfield, K.Y.
(1998) Elucidating the molecular mechanism of the permeability
transition pore and its role in reperfusion injury of the heart.
Biochem. Biophys. Acta 1366, 79–94.
40. Di Lisa, F. & Bernardi, P. (1998) Mitochondrial function as a
determinant of recovery or death in cell response to injury. Mol.
Cell. Biochem. 184, 379–391.
41. Lemasters, J.J., Nieminen, A.L., Qian, T., Trost, L.C., Elmore,
S.P., Nishimura, Y., Crowe, R.A., Cascio, W.E., Bradham, C.A.,
Brenner, D.A. & Herman, B. (1998) The mitochondrial
permeability transition in cell death: a common mechanism in
necrosis, apoptosis and autophagy. Biochem. Biophys. Acta 1366,
177–196.
42. Bernardi, P. (1999) Perspectives on the permeability transition
pore, a mitochondrial channel involved in cell death. In: Frontiers
in Cellular Bioenergetics. (Papa,S.,Guerrieri,F.&Tager,J.M.,
Ó FEBS 2002 Mitochondria and liver regeneration (Eur. J. Biochem. 269) 3311
eds), pp. 773–795. Kluwer Academic/Plenum Publishers, New
York.
43. Zoratti, M. & Szabo, I. (1995) The mitochondrial permeability
transition. Biochem. Biophys. Acta 1241, 139–176.
44. Minamikawa, T., Williams, D.A., Bowser, D.N. & Nagley, P.
(1999) Mitochondrial permeability transition and swelling can
occur reversibly without inducing cell death in intact human cells.
Exp. Cell Res. 246, 26–37.
45. Lim, M.L.R., Minamikawa, T. & Nagley, P. (2001) The proto-
nophore CCCP induces mitochondrial permeability transition
without cytochrome c release in human osteosarcoma cells. FEBS
Lett. 503, 69–74.
46. Mancini, M., Anderson, B.O., Caldwell, E., Sedghinasab, M.,
Paty,P.B.&Hockenbery,D.M.(1997)Mitochondrial
proliferation and paradoxical membrane depolarization during
terminal differentiation and apoptosis in a human colon carcino-
ma cell line. J. Cell. Biol. 138, 449–469.
3312 F. Guerrieri et al. (Eur. J. Biochem. 269) Ó FEBS 2002