Extraction optimization and structural characterization of pectin from persimmon fruit (Diospyros kaki Thunb. var. Rojo brillante)
Bạn đang xem bản rút gọn của tài liệu. Xem và tải ngay bản đầy đủ của tài liệu tại đây (4.46 MB, 10 trang )
Carbohydrate Polymers 272 (2021) 118411
Contents lists available at ScienceDirect
Carbohydrate Polymers
journal homepage: www.elsevier.com/locate/carbpol
Extraction optimization and structural characterization of pectin from
persimmon fruit (Diospyros kaki Thunb. var. Rojo brillante)
˜oz-Almagro a, Mario Vendrell-Calatayud a, b, Pablo M´endez-Albin
˜ ana a,
Nerea Mun
c
b
a, *
Rodrigo Moreno , M. Pilar Cano , Mar Villamiel
a
Departamento de Química y Funcionalidad de Alimentos, Grupo de Química y Funcionalidad de Carbohidratos y Derivados, Instituto de Investigaci´
on en Ciencias de la
Alimentaci´
on (CIAL) (CSIC-UAM), Nicol´
as Cabrera, 9, Campus de la Universidad Aut´
onoma de Madrid, 28049 Madrid, Spain
Departamento de Biotecnología y Microbiología de Alimentos, Grupo de Fitoquímica y Funcionalidad de Productos Vegetales, Instituto de Investigaci´
on en Ciencias de la
Alimentaci´
on (CIAL) (CSIC-UAM), Nicol´
as Cabrera, 9, Campus de la Universidad Aut´
onoma de Madrid, 28049 Madrid, Spain
c
Instituto de Cer´
amica y Vidrio (ICV), Consejo Superior de Investigaciones Científicas (CSIC), Madrid, Spain
b
A R T I C L E I N F O
A B S T R A C T
Keywords:
Persimmon
Astringent fruits
Optimization
Yield
Monosaccharide composition
FTIR spectroscopy
In this work we have efficiently extracted and characterized pectin from different tissues of astringent (AS) and
non-astringent (NAS) persimmon fruits (peel, pulp, whole fruit) for the first time. The highest pectin extraction
(≥7.2%) was carried out at 80 ◦ C, 120 min with 1.5% sodium citrate in peel of both AS and NAS persimmon
samples. All persimmon pectins showed a molecular weight and galacturonic acid content upper than 328 kDa
and 78%, respectively, indicating their suitability as food ingredient. Pectin extracted from AS pulp and peel
tissues exhibited an enriched structure in rhamnose and arabinose, whereas the opposite behavior was observed
in NAS persimmon whole fruit samples. Remarkably, both pulp tissues (AS and NAS) presented the highest levels
of glucose and mannose, non-pectic carbohydrates. In addition, techno-functional assessment (zeta potential,
particle size, apparent viscosity, gelation) showed the suitability of the persimmon pectins for a broad range of
industrial applications.
1. Introduction
Persimmon fruit (Diospyros kaki Thunb. Var Rojo Brillante) is an
appreciated astringent cultivar that needs a de-astringency treatment
before commercialization to improve its sensorial quality such as
exposure to carbon dioxide in high concentrations (Plaza et al., 2012).
The astringent fruit can only be eaten when it is at the mature stage,
while the non-astringent can be consumed when the fruit is still firm
(Munera et al., 2019).
The consumption of persimmon has experienced an important in
crease since this fruit has been demonstrated to be a source of bioactive
components such as vitamin C, pectin, condensed tannins and caroten
oids (Cano et al., 2019; Gu et al., 2008; Jiang et al., 2020) which are
related to several positive health impacts comprising antihypercholesterolemic, cardioprotective, anti-carcinogenic, anti-inflam
matory and antioxidant effects (Ge et al., 2017; George & Redpath,
2008). However, there is evidence from published papers that pectin
shows strong inhibitory effects of absorption of a type of dietary
carotenoids, β-carotene (Hoffmann et al., 1999; Riedl et al., 1999).
Pectins are a family of versatile biopolymers rich in plants and used
commercially as emulsifiers, gelling agents, stabilizers, and/or thick
eners. The carboxylic groups of galacturonic acid of pectins are usually
methylesterified to some degree modifying their functional properties.
Commercial pectins are classified as high-methoxyl pectin (HMP) with a
degree of methylation (DM) >50% and low-methoxy pectin (LMP) with
a DM <50% (Chan et al., 2017). Despite its disposal in a number of plant
species, commercial sources of pectin are limited, being citrus an apple
pulp the major ones. On a commercial scale, it is extracted employing
long times (up to 5 h), high temperatures (up to 90 ◦ C) and using mineral
acids (nitric, hydrochloric, sulphuric acids) as extracting agents. The
preference of the industry toward these acids is mainly due to their
ability to generate pectin enriched in GalA as consequence of the strong
hydrolysis of neutral sugars of side chains. Nonetheless, the main
drawbacks of these procedures are the degradation of pectin structure,
their well-known toxicity and the generation of environment unfriendly
effluents, requiring special treatments. Hence, milder and eco-friendlier
* Corresponding author at: Instituto de Investigaci´
on en Ciencias de la Alimentaci´
on (CIAL) (CSIC-UAM), C/ Nicol´
as Cabrera 9, Campus de la Universidad
Aut´
onoma de Madrid, 28049, Spain.
E-mail address: (M. Villamiel).
/>Received 26 February 2021; Received in revised form 30 June 2021; Accepted 2 July 2021
Available online 8 July 2021
0144-8617/© 2022 The Authors.
Published by Elsevier Ltd.
This is an
( />
open
access
article
under
the
CC
BY-NC-ND
license
N. Mu˜
noz-Almagro et al.
Carbohydrate Polymers 272 (2021) 118411
extracting agents are preferred (Chan et al., 2017; Kang et al., 2015).
Recently, the application of a food grade compound such as sodium
citrate has been demonstrated to be a good pectin extracting agent with
regard to the pectin yield and the main intrinsic parameters (monomeric
composition, Mw) due to its lower hydrolysing capacity than mineral
˜ oz-Almagro, Prodanov, et al., 2020).
strong acids (Kang et al., 2015; Mun
Regarding persimmon, limited information on pectin is available. To
date, Liu et al. (2015) and Jiang et al. (2020) focused on the pectin
extraction using Aspergillus terreus and conventional hot-acid methods.
However, these studies only used persimmon peel as by-product and its
chemical composition was scarcely characterized. Therefore, to the best
of our knowledge, no studies have been carried out the pectin extraction
in other tissues of the persimmon fruit different from the peels, using
sodium citrate as extracting agent and also, including as source of pectin
the whole fruit which could be an interesting cheap source when these
fruits are not commercialized for non-uniform size, maturity or damage.
The aim of this work was to carry out an experimental design to find
the optimal extraction conditions of persimmon pectin from peel, pulp
and the whole fruit tissues from astringent (AS) and non-astringent
(NAS) fruits, cv. Rojo Brillante, that give rise to the lowest impact in
the chemical structure. This objective arises from the necessity to
characterize the pectin of persimmon not only as a new source, but also
to try to understand the pectin interactions with other bioactive
persimmon bioactive components present in the fruit during the
gastrointestinal digestion which will affect its nutritional value.
sodium hydroxide, sodium citrate, citric acid, oxalic acid, ammonium
acetate, hydroxilamine chloride, β-phenylglucoside, Pullulan Standard
(0.34–805 kDa), a polymer consists of α(1,6) linked maltotriose units,
and trifluoroacetic acid were acquired from Sigma Aldrich (St. Louis,
MO, USA). Reagents such as 96% ethanol (Alcoholes Montplet, Barce
lona, Spain), hydrochloric acid (J.T.Baker Fisher Scientific, Strasbourg,
France) were used for the extraction and purification of the pectin.
2.3. Experimental design
Optimization of pectin extraction from persimmon was done
applying a Centred Composite Orthogonal Design (CCOD) using
“Design-Expert®10 trial version” (Stat-Ease Inc., Minneapolis, USA)
with three central points, totalizing 17 trials at the 0.05 significance
level. The effects of temperature (X1, 60–80 ◦ C), time (X2, 30–120 min)
and extracting agent concentration (X3, 0.3–1.5% for sodium citrate) on
pectin yield were studied using three-factorial analysis of variance
(ANOVA). CCOD consist of six axials, eight factorial and three central
points, totalizing 17 trials for each type of extraction at the 0.05 sig
nificance level. RSM was used and a desirability function was applied to
determine the best conditions of extraction. The experiments were
performed randomly to avoid systematic errors.
The quadratic model for predicting the optimal point was expressed
as follows:
Yi = β0 + βi Xi + βij Xi2 + βij Xi Xj
2. Materials and methods
where, Yi is the predicted response for each experience (i = 1–17) and
each experimental response (X1–3), β0 is the intercept, βi, are linear co
efficients, βii are squared coefficients, and βij are the interaction co
efficients for each independent variable. The quality of fit of the secondorder model equation was expressed by the coefficient of determination
R2. Also, R2-Adjusted (percentage of explained variance) and R2-Pre
dicted (indicator of how well the regression model predicts responses for
new observations) were considered to evaluate the model uniformity.
The significance of the regression coefficients was tested by t-value.
2.1. Persimmon fruits
Persimmon fruits (Diospyros kaki Thunb., var. Rojo Brillante) were
harvested in Ribera del Xúquer (Valencia, Spain) at commercial matu
rity stage IV, which is based on the external colour according to Salvador
et al. (2007). Physical and physicochemical characteristics of
persimmon fruits (Table 1) which define the fruit maturity were eval
uated as described before (Plaza et al., 2012). Persimmon fruits were
washed, drained and hand prepared to obtain three types of tissue:
whole fruit, pulp and peel tissues. Each type of freeze-dried persimmon
sample was ground by pulverizing to a fine particle size (<2 mm) before
being carefully homogenized and vacuum stored at − 36 ◦ C in Cryovac®
bags until pectin analysis. The astringency of these fruits are due to their
high content of phenolic compounds, especially in proanthocyanidins.
To obtain non-astringent samples, it was necessary a very well-known
process with carbon dioxide to remove the astringency.
2.4. Pectin extraction and purification
Before extraction, 2.5 g of persimmon sample were mixed with 25
mL ethanol and kept at 90 ◦ C for 30 min in order to inactivate the pectin
methylesterase. Afterwards, the mixture was centrifuged at 3700g
(Heraeus Multifuge 3SR Plus, Thermo Scientific, Massachusetts, USA)
for 10 min. The wet solid was extracted with sodium citrate (original S/L
ratio, 1:20 w/v) at pH 3 (adjusted with citric acid), following the con
ditions of experimental design explained above. Once the extraction
time elapsed, the mixture was centrifuged at 3700 ×g for 10 min and
recovered with two volumes of 96% acidified ethanol (0.2% HCl, v/v).
The mixture was kept at 4 ◦ C overnight and centrifuged at 3700 ×g.
Lastly, the precipitate washed firstly with 96% acidified ethanol (0.04%
HCl, v/v) and later with ethanol (96%). The recovered pectin was
lyophilized and stored at − 20 ◦ C. The pectin yield was calculated ac
cording to the formula:
2.2. Materials and chemicals
Standard monosaccharides (galactose, rhamnose, glucose, fucose,
fructose, galacturonic acid (GalA), mannose, xylose and arabinose),
Table 1
Morphological characteristics and physicochemical properties of the astringent
and non-astringent whole fruits.
Astringent
Height (cm)
Width (cm)
Weight (g)
Peel weight (g)
Pulp weight (g)
pH
Acidity
Pulp humidity (%)
Peel humidity (%)
◦
Brix (%)
Pectin yield (%) =
Non-astringent
a
8.36 ± 0.47
6.35 ± 0.20a
218.25 ± 8.61a
27.15 ± 5.89a
164.23 ± 16.91a
5.58 ± 0.05a
0.13 ± 0.03a
86 ± 4.61a
75 ± 7.24a
17.93 ± 0.25b
(1)
a
8.35 ± 0.42
6.69 ± 0.19a
215.97 ± 9.67a
27.48 ± 1.76a
162.45 ± 6.68a
5.49 ± 0.13a
0.20 ± 0.04a
83 ± 5.84a
76 ± 6.47a
15.56 ± 0.06a
m (g)
× 100
m0 (g)
(2)
Where m is the weight of dried pectin (g) and m0 is the initial weight
of persimmon tissue used for extraction (g).
2.5. Structural characterization of astringent and non-astringent
persimmon pectins
2.5.1. Estimation of molecular weight (Mw) distribution
The estimation of Mw distribution of pectin in persimmon samples
was determined according to the method described by Mu˜
noz-Almagro
et al. (2018). Separation was achieved by HPSEC with two TSK-Gel
Averages with the same letter in the same line (a–b) indicate there is no sig
nificant difference between the samples (p < 0.05) in Tukey's test.
2
N. Mu˜
noz-Almagro et al.
Carbohydrate Polymers 272 (2021) 118411
columns G5000 PWXL (7.8 mm × 300 mm, 10 μm) and G2500 PWXL
(7.8 mm × 300 mm, 6 μm) connected in series with a TSK-Gel guard
column (6.0 mm × 400 mm) (Tosoh Bioscience, Stuttgart, Germany).
The HPSEC-ELSD analysis was carried out on a LC chromatograph
Agilent Technologies 1220 Infinity and a detector ELSD 1260 Infinity
(Agilent Technologies, Boeblingen, Germany). Samples (50 μL) were
eluted with 0.01 M NH4Ac at a flow rate of 0.5 mL/min for 50 min at
30 ◦ C.
geometry used was a double-cone and plate system with a truncated
cone with an angle of 2◦ and a diameter of 60 mm. The apparent vis
cosity and steady shear rate measurement were fitted to the HerschelBulkley model, according to the following equation:
σ = σ0 + k⋅γ˙ n
(3)
being σ the shear stress, σ0 the yield point, γ the shear rate and k and n
adimensinal constants.
2.5.2. Neutral sugars and galacturonic acid analysis
The extracted pectins were hydrolyzed and derivatized, forming
their thimethylsilyl oximes before GC-FID analysis following the method
˜ oz-Almagro et al. (2020). Analyses were carried out using a DBof Mun
5HT capillary column (30 m × 0.32 mm × 0.10 μm) (J&W Scientific,
Folson, California, USA). Oven temperature program was increased from
150 ◦ C to 165 ◦ C at 1 ◦ C/min, then increased at a rate of 10 ◦ C/min to
200 ◦ C and up to 380 ◦ C at a heating rate of 50 ◦ C/min. Quantitation was
carried out using the internal standard method, being β-phenyl-gluco
side (0.05% w/v) the standard. The response factors were calculated
after the analysis of standard solutions (glucose, mannose, rhamnose,
arabinose, galactose, GalA and xylose), over the expected concentration
range in samples (0.01–5 mg/mL).
2.9. Rheological properties
Storage modulus (G′ ) and loss modulus (G′′ ) of NAS and AS pectins
obtained from peel, pulp and whole fruit, were determined using the
same rheometer described above operating under oscillation mode, with
a circulating bath at 25 ◦ C, using also a double cone-plate sensor (DC60/
2◦ ) and a solvent trap to avoid evaporation effects and programmed
using Rheo Win 4 Job Manager (Thermo Fisher Scientific Inc.). Fre
quency sweeps were recorder over the range 1–10 Hz at a controlled
stress of 5 Pa and at a temperature of 23 ◦ C.
3. Results and discussion
3.1. Physicochemical characterization of persimmon fruits
2.5.3. Determination of the degree of methyl esterification (DM)
All astringent and non-astringent persimmon pectins obtained from
three tissues (whole fruit, pulp and peel) were analyzed by FT-IR ac
˜ oz-Almagro et al. (2020). The
cording to the method described by Mun
DM of pectin was determined as the average of the ratio of the peak area
at 1739 cm− 1 (COO-R) over the sum of the peak areas of 1739 cm− 1
(COO-R) and 1637 cm− 1 (COO− ).
Prior to proceed with pectin extractions it was necessary to carry out
a global characterization of persimmon fruits to know their maturity
stage. The results of the physicochemical analysis are shown in Table 1.
The pH values were very similar in AS and NAS fruits (5.58, 5.49,
respectively), in line with data of Prusky and Yakoby (2003) (5.8–6) and
Eshel et al. (2002) (5.6). The same tendency was observed in the acidity
determination of persimmon fruits. However, Veberic et al. (2010)
found a wide diversity of values (0.20–0.37) in NAS persimmons, but the
studied persimmon varieties were different to the Spanish Rojo Bril
lante. Humidity was in both persimmon samples greater than 83%, in
accordance with the values reported by Clark and MacFall (2003) in
non-astringent persimmon “Fuyu” (87.5%). With respect to the content
of soluble solids (◦ Brix), the data observed in AS (17.93%) and NAS
fruits (15.56%) were also in line with previous authors (17.3% for AS
(Sugiura et al., 1983) and 14.02% for NAS (Jannok et al., 2014)
persimmon fruits).
The physicochemical data obtained for both persimmon fruits, AS
and NAS, were in accordance with the commercial maturity stage IV
defined by Salvador et al. (2007).
2.6. Zeta potential (ζ)
Zeta potential (ζ) of NAS and AS pectins obtained from peel, pulp and
whole fruit in aqueous dilution was determined according to the method
described by Pacheco et al. (2019), with some modifications using a
Malvern Zeta sizer Nano ZS instrument (Malvern Instruments Ltd.,
Worcestershire, UK). A volume of 250 mL of pectin suspension was
prepared by dissolving the extracted pectin in KCl 0.1 M (1 mg/mL). The
suspension was shaken using a magnetic stirrer, and its pH was
measured. Briefly, the sample was injected into the clear disposable zeta
cell and the ζ was measured. The procedure for the preparation of
mixtures was repeated, in order to obtain dilutions at different pH values
(3, 5 and 6) by adding HCl 0.1 M or KOH 0.01 M drops, and their
respective ζ values were measured. The measuring cell was carefully
washed after each reading, using deionized water and the next dilution,
avoiding bubbles inside to evade measurement errors.
3.2. Optimization of the pectin extraction from persimmon
To investigate the influence of extraction conditions on the yield of
persimmon pectin, a CCOD was carried out, using astringent persimmon
whole fruit sample. Table 2 shows that there was a wide variability in
the yields of pectin extraction, ranging from 0.2 to 6.27%. The yields
obtained in assays corresponding to the central point were very close
(0.99, 1.35 and 1.2%), indicating the good accuracy of the design.
For assays 13 and 17, the time and concentration of extraction agent
were the same, but the temperature at which the extractions were
around 55 and 85 ◦ C, respectively. The results of these two extraction
processes showed that an increase in temperature causes a significant (p
≤ 0.05) increase in yield (2.3% vs 4.7%). In a similar way, the time of the
extraction process had a positive effect on yield.
For instance, an increase in pectin yield was found prolonging only
the extraction time from 2.41% (8.85 min) (assay 15) to 4.5% (141.15
min) (assay 6). Similarly, under the same temperature and time process
conditions (i.e. 60 ◦ C, 30 min), the higher extracting agent concentration
was employed, the higher the pectin yield was reached. This tendency
can be observed in the assays 4 (0.3% sodium citrate; 1.8% pectin yield)
and 3 (1.5% sodium citrate; 4.12% pectin yield).
2.7. Particle size
Particle size of pectins extracted from different tissues (peel, pulp,
whole fruit) of NAS and AS persimmon var. Rojo brillante were deter
mined at room temperature using a Malvern Zeta sizer Nano ZS instru
ment (Malvern Instruments Ltd., Worcestershire, UK). 200 mg of pectin
solution (2% w/v) was mixed with 20 mL of deionized water. Then, the
solution of each sample was put into a measurement cell and its particle
size was measured with a scattering angle of 173◦ .
2.8. Apparent viscosity
Following the method described by Huang et al. (2017), extracted
pectin was dispersed in deionized water (20 mg/mL) using a magnetic
stirrer at ambient temperature during 1 h. The apparent viscosity of the
sample was determined using a Modular Advanced Rheometer System
(MARS) (Thermo Fisher Scientific Inc., Waltham, MA, USA). Flow curves
over the shear rate (1–1000 s− 1) were measured at 25 ◦ C. The measuring
3
N. Mu˜
noz-Almagro et al.
Carbohydrate Polymers 272 (2021) 118411
obtained from the different persimmon tissues studied in this work
(whole fruit, peel and pulp) of both AS and NAS fruits were structurally
characterized. The yields for pectin from both types of peel (Table 3)
were the highest, especially in the case of NAS peel (9.1%), as compared
to the rest of the studied samples (pulp and whole fruit tissues) which
presented a content of pectin around 5%.
The monomeric composition of carbohydrates is shown in Table 3.
As expected, the most abundant monosaccharide in all samples of
persimmon tissues in astringent and non-astringent fruits, was gal
acturonic acid (GalA) with percentages higher than 78% of total car
bohydrates. This result supports the usefulness of this pectin as food
˜ oz-Almagro,
ingredient (E-440), according to FAO indications (Mun
Montilla, & Villamiel, 2020). Despite all AS tissues presented a high
content of rhamnose, the pectin extracted from persimmon pulp reached
the highest levels of this monosaccharide indicating its enrichment in
rhamnogalacturonan-I, as compared to the other two tissues (peel and
whole fruit). On the contrary, this behavior only was found in the pectin
extracted from NAS peel. In general, the structure of all persimmon
pectins showed an abundant presence of arabinans (≥6.6%). It has been
shown that higher arabinose content can give better biological proper
ties to the pectin, such as prebiotic functions (Ferreira-Lazarte et al.,
2019). Furthermore, in NAS and AS persimmon samples the ratios GalA/
Rha (indicator of the predominance of the homogalacturonan domain
versus ramnogalacturonan I) and the corresponding relationships (Ara
+ Gal)/Rha and GalA/Rha, corroborated that the structure of all
persimmon pectins consisted mainly of a domain of homogalacturonan
and a part of ramnogalacturonan I. Ali Asgar et al. (2004) studied the
pectin of fresh and sun-dried Japanese persimmon (D. kaki, cv. Ijiraomi)
and they only reported neutral sugars, being arabinose and galactose the
most abundant. These authors found important modifications in their
contents during the sun-drying process due to variations in the enzy
matic activity of α-arabinosidases and β-galactosidases due to the high
temperatures of drying process. Jiang et al. (2020) extracted pectin from
“Mirror persimmon” peel, that was previously dried at 60 ◦ C for 24 h and
they reported a higher abundance of homogalacturonan and a lower
proportion of neutral sugars in pectins, when the extraction from fruit
peels was conducted at pH 2, using citric acid at 90 ◦ C for 120 min.
Both glucose (derived from cellulose, hemicellulose) and mannose
(derived from mannans) are monosaccharides belonging to the cell wall,
so they can be considered impurities of pectin (Cutillas-Iturralde et al.,
1994); these polysaccharides could co-precipitated during the extraction
of pectin. Moreover, the presence of glucose and mannose can also come
from remaining soluble sugars that were not completely eliminated
˜ oz-Almagro, Prodanov, et al., 2020;
during pectin purification (Mun
Wang et al., 2016; Yapo, 2009). As observed in Table 3, pectins obtained
from AS and NAS persimmon pulps revealed the highest levels of
mannose and glucose, indicating lower purity as compared to those
extracted from the other samples. Remarkably, a significant higher
amount of glucose than mannose was observed in all samples. These
results could suggest that a greater extraction of cellulose than of
mannans occurred during the pectin obtainment process.
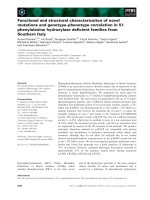
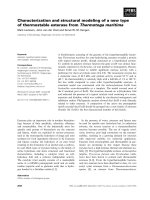
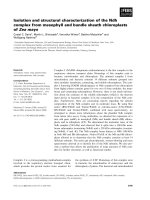
Fig. 2 shows the profile of the estimation of Mw of the different
pectin fragments (a) and their corresponding relative abundances (%)
(b) of three types of AS and NAS persimmon tissues. Regardless the type
of persimmon fruit (AS or NAS) and type of tissue, a bimodal Mw dis
tribution was found in all extracted pectins. Remarkably, the first frag
ment presented the highest Mw and abundance. The highest Mw (503
kDa) of the first fragment was found in the pectin from whole fruit and
the lowest (328 kDa) in the peel, both in persimmon astringent samples.
In the case of the second pectic fragment, the estimated Mw was in the
range 35–66 kDa. With respect to the abundance of both fragments,
hardly any differences were observed between AS and NAS persimmon
samples.
Jiang et al. (2020) extracted pectin from “Mirror persimmon” with 1
M citric acid at 90 ◦ C for 120 min and found a Mw for this fragment of
228 kDa. These differences can be ascribed to the different varieties,
Table 2
Central composite design with independent variables, temperature (◦ C, X1), time
(min, X2) and extracting agent concentration and yield of pectin as dependent
variable in astringent whole fruit persimmon.
Assays
1
2
3
4
5
6
7
8
9
10
11
12
13
14
15
16
17
Extracting
concentration
(%)
Pectin
yield
(%)
30.0
1.5
4.32
80.0
120.0
0.3
4.2
60.0
30.0
1.5
4.12
60.0
30.0
0.3
1.8
80.0
30.0
0.3
2.2
70.0
141.5
0.9
4.5
60.0
120.0
0.3
4.07
70.0
75.0
1.78
2.9
70.0
75.0
0.018
0.2
70.0
75.0
0.9
1.2
60.0
120.0
1.5
5.63
70.0
75.0
0.9
1.35
55.3
75.0
0.9
2.3
80.0
120.0
1.5
6.27
0.9
2.41
Design
points
Temperature
(◦ C)
Factorial
point
Factorial
point
Factorial
point
Factorial
point
Factorial
point
Axial (star)
point
Factorial
point
Axial (star)
point
Axial (star)
point
Centre
(middle)
point
Factorial
point
Centre
(middle)
point
Axial (star)
point
Factorial
point
Axial (star)
point
Centre
(middle)
point
Axial (star)
point
80.0
70.0
Time
(min)
8.85
70.0
75.0
0.9
0.99
84.7
75.0
0.9
4.68
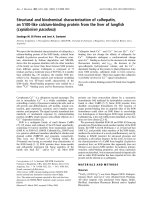
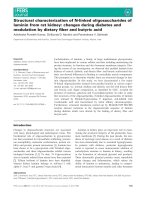
The optimal process conditions to reach the highest extraction re
covery of pectin from astringent persimmon were: time 120 min, tem
perature 80 ◦ C and a concentration of sodium citrate of 1.5%, with a
desirability of 0.977. These process conditions were coincident with
those employed in the assay 14 (Table 2). The mean experimental pectin
yield in this case was 6.27%, very close to the predicted value (6.13%),
demonstrating the validation of the optimized conditions. It is note
worthy that the optimal values found for these experiments were located
in the centre of the response surface plots for all evaluated variables
(Fig. 1), which suggests that optimal region might be located at higher
temperatures, longer times and higher concentration of extracting
agents. Despite this fact, it is necessary to take into account that severe
extraction conditions can cause the breakdown of pectin (Abid et al.,
2016).
According to ANOVA results exposed in Table 1S, the temperature
and time of extraction process and the concentration of extracting agent
had significant effect (p < 0.05) for linear and quadratic parameters.
These process variables demonstrated to have a crucial role in the pectin
extraction from persimmon fruit tissues. The adequacy of the model R2
was above 95%, indicating a good fit of data to the model. R2-adjusted
values were close to R2, which is desired for the model. On the contrary,
the interaction between the different parameters was not significant.
3.3. Characterization of extracted persimmon pectin under optimal
conditions
Once the optimal extraction conditions were selected, pectins
4
N. Mu˜
noz-Almagro et al.
Carbohydrate Polymers 272 (2021) 118411
Fig. 1. Response surface (three-dimensional) plots of extraction process conditions (time, temperature and concentration of extracting agent).
5
N. Mu˜
noz-Almagro et al.
Carbohydrate Polymers 272 (2021) 118411
ability to form gels without requiring the presence of sucrose (e.g., in
low dietetic foods) but also for its stabilizing properties in yoghurt
drinks (Han et al., 2017). This is of particular relevance in the control of
˜ oz-Almagro, Montilla, & Villamiel, 2020) and
sugars consumption (Mun
in the potential of persimmon fruits and by-products as source pectin.
Table 3
Yield and molecular parameters of pectin extracted from astringent and nonastringent persimmon (peel, pulp and whole fruit) under optimal conditions
(80 ◦ C, 120 min and 1.5% extracting agent).
Astringent
Yield (%)
Monosaccharides
composition (%)
GalA
Rha
Gal
Ara
Man
Glc
GalA/Rha
Ara + Gal/Rha
DM (%)
Non-astringent
Peel
Pulp
Whole
fruit
Peel
Pulp
Whole
fruit
7.2 ±
0.4b
6.2 ±
0.3c
5.0 ±
0.4d
9.1 ±
0.6a
4.7 ±
0.2d
4.6 ±
0.1d
80.8
±
5.8a
3.8 ±
0.0c
1.1 ±
0.0b
7.5 ±
0.0b
1.5 ±
0.0a
5.4 ±
0.5b
21.3
±
1.6b
2.2 ±
0.0b
12
78.1
± 6.4a
84.5 ±
7.6 a
4.3 ±
0.0b
1.9 ±
0.0a
6.6 ±
0.0d
1.4 ±
0.0a
1.3 ±
0.0c
19.8 ±
1.2b
0.7 ±
0.0e
6
1.9 ±
0.1c
4
81.2
±
7.6a
2.9 ±
0.0d
0.8 ±
0.0d
7.8 ±
0.0a
1.0 ±
0.0b
6.2 ±
0.0b
27.3
±
1.4a
2.9 ±
0.0a
5
83.9 ±
6.6a
4.9 ±
0.01a
0.9 ±
0.0c
2.7 ±
0.0f
1.9 ±
0.0a
11.3
± 0.9a
15.8
± 0.7c
84.9
±
8.2a
4.3 ±
0.0b
0.8 ±
0.0d
4.7 ±
0.0e
1.1 ±
0.0b
4.0 ±
0.1b
20.0
±
0.1b
1.3 ±
0.0d
5
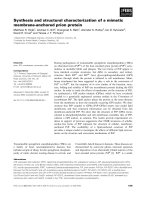
3.4. Zeta potential (ζ), particle size and apparent viscosity (η)
The electrostatic repulsive force (zeta potential) could predict the
potential stability of the hydrocolloid systems and also help provide
stable formulations. The zeta potential (ζ) of persimmon pectins
extracted from three different AS and NAS tissues (peel, pulp and whole
fruit) is displayed in Fig. 4. In spite of the fact that the isoelectric point
was not reached in any of the samples, the tendency seems to indicate
that it should occur at pH values lower than 1.5. On the other hand, all
samples regardless persimmon tissue used for pectin extraction, showed
a higher stability at pH range from 3 to 6.5, highlighting the NAS pectins
that reached higher absolute values of ζ (− 20 to − 35 mV) as compared
to the AS samples (− 10 to − 25 mV). This could indicate that pectin
extracted in NAS tissues presented higher stability in aqueous dispersion
that those obtained from AS persimmon tissues.
Regarding the particle size of pectins extracted from astringent and
non-astringent persimmon (peel, pulp and whole fruit) samples, it is
shown in Table 4. In general terms, this parameter was higher in the AS
than in NAS, in agreement with the results of the ζ. Thus, the higher
stability found in NAS pectin could be related to the smaller particle size,
particularly in peel and whole fruit tissues.
As it is depicted in Fig. 5, in general, the apparent viscosity of the
pectin solutions decreased when the shear rate increased, which is
indicative of a pseudoplastic (shear-thinning) flow behaviour probably
due to a decrease of entanglements of their structure (Lin et al., 2021).
All types of AS persimmon pectins exhibited higher apparent viscosity
values than the NAS samples, in agreement with lower zeta potential.
Regarding the astringent pectin, the extracted from whole fruit reached
the highest final viscosity, followed by the pectin obtained from peel. In
the case of NAS samples, peel was the tissue whose pectins were more
viscous than those from whole fruit. Remarkably, pectins obtained from
pulp exhibited the lowest apparent viscosity values in both astringency
cases.
2.6 ±
0.0e
0.7 ±
0.0e
6.7 ±
0.0c
0.9 ±
0.0b
2.8 ±
0.0c
32.9 ±
2.4a
2.9 ±
0.2a
7
Averages with the same letter in the same line (a–d) indicate there is no sig
nificant difference between the samples (p < 0.05) in Tukey's test.
degree of maturity and experimental conditions.
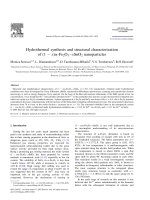
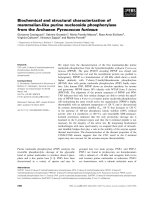
In order to deepen the characterization of persimmon pectin, a
spectroscopic analysis by FT-IR (Fig. 3) was used to know the degree of
methyl esterification of the persimmon pectin extracted from different
tissues of astringent and non-astringent fruits to explore their potential
applications according to the classification of low-methoxyl (LM,
0–50%) or high methoxyl (HM, 51–100%) (Chan et al., 2017).
The wide and marked IR band at 3415 cm− 1 which corresponds to
–
O H stretching vibration of hydroxyl groups was observed in the FT-IR
spectra. On the other hand, the band that appears on 2925 cm− 1
assigned to the vibrations of C–H (–CH, –CH2, –CH3), exhibited the
same area in all, demonstrating that the main linear domain of the pectin
did not suffer any depolymerisation during the extraction. The band
around 1739 cm− 1 of strong intensity, related to the vibration of
asymmetric tension of methylesters of the carbonyl groups, showed area
inferior to the signal near 1637 cm− 1, belonging to the vibration of
symmetrical tension of the carboxylate ions, as a result of the variation
of the methoxylation degree (DM). The reduction of the peaks 1102 and
1057 cm− 1 corresponding to the stretching vibrations C–OH side
groups and the C–O–C glycosidic bond vibration, could be due to the
minor presence of glycosidic linkages between sugar units (Zhang et al.,
2018). Other bands were maintained regardless of the part of
persimmon used for the pectin extraction such as 921 cm− 1 (rocking
mode of -CH3), and 819 cm− 1, (–CCH and –COH bending at the C-6
position) (Wang et al., 2014).
The bands mentioned previously were more intense in the pectins
extracted from AS persimmon fruits in comparison to the NAS ones. In
the analyzed samples, these qualitative changes resulted in slight
quantitative changes in the DM, as illustrated in Table 3. All samples
analysed were low-methoxyl pectins with values of DM ranging between
4 and 12%, in the pectin extracted from AS peel and whole fruit,
respectively. These results indicated that all pectins regardless the
persimmon tissue of which came from, were almost entirely demethy
lesterified during extraction process, without observing any significant
differences between pectins obtained from AS and NAS persimmon
fruits. LM pectin is used in a wide variety of food products not only for its
3.5. Rheological properties
Fig. 6 shows the rheological data of the oscillatory measurements,
recording the evolution of storage (G′ ) and loss (G′′ ) modules of the
persimmon pectins extracted from the three different AS and NAS tissues
(peel, pulp and whole fruit). This kind of analysis determines the relative
elastic/viscous nature of the different persimmon pectins, both astrin
gent and non-astringent. When G′ > G′′ the sample exhibits a semi-solid
behavior, it means that is more elastic than viscous, which is a typical gel
behavior. When G′ is equal to G′′ the sample behaves like a concentrated
solution. On the other hand, if the sample is semi-liquid G′′ will be higher
than G′ . As it is displayed in Fig. 6, G′ is higher than G′′ at low fre
quencies, indicating that all persimmon pectins extracted both AS and
NAS tissues exhibit an elastic behavior. On the contrary, pectin obtained
from NAS peel highlighted for being viscous at higher frequencies, being
G′′ higher than G′ .
4. Conclusions
In conclusion, an optimization of pectin extraction from astringent
and non-astringent persimmon fruits, cv. Rojo Brillante, from different
fruit tissues was performed in the present study. It was found that the
pectin extraction with sodium citrate (1.5%) at 80 ◦ C for 120 min gave
rise to the highest yield, being the persimmon peel the tissue with the
utmost value, particularly in the non-astringent fruits. In all persimmon
samples, the most important monosaccharide was GalA with values
6
N. Mu˜
noz-Almagro et al.
Carbohydrate Polymers 272 (2021) 118411
Fig. 2. Pectins extracted at optimal conditions (120 min, 80 ◦ C and 1.5% sodium citrate) from three different astringent and non-astringent persimmon tissues (pulp,
peel and whole fruit). a) HPSEC-ELSD profiles, b) Estimation of Mw (kDa) and main fragments formed (%).
Fig. 3. FTIR spectra of pectins extracted under optimal conditions (120 min, 80 ◦ C and 1.5% sodium citrate) from three different astringent and non-astringent
persimmon tissues (pulp, peel and whole fruit).
7
N. Mu˜
noz-Almagro et al.
Carbohydrate Polymers 272 (2021) 118411
Fig. 4. Zeta Potential (ζ) of curves of persimmon pectins extracted under optimal conditions (120 min, 80 ◦ C and 1.5% sodium citrate) from three different astringent
and non-astringent persimmon tissues (pulp, peel and whole fruit).
persimmon samples. In addition to the structural study, an evaluation
of the zeta potential, particle size, apparent viscosity and gelation
properties was carried out. The obtained results of the six extracted
pectins pointed out a good stability, particularly in the case of nonastringent samples, and a pseudoplastic behaviour in all of them, indi
cating their application in a wide range of foodstuffs. All pectins were
able to form gels, astringent tissues being the samples with better
gelation capacity, namely the whole fruit. To the best our knowledge,
hardly any investigation has been don on the extraction of pectin from
persimmon; no previous studies have been carried out on the structural
and techno-functional characteristics of pectin from peel, pulp and
whole fruit considering both types of fruits, astringent and nonastringent. Although more investigation is needed, the results here ob
tained show the usefulness of persimmon as an alternative source of
pectin extraction. This is of particular relevance in the case of whole
fruits that are usually discarded due to their elevated astringency or
other non-astringent that are rejected by the consumers by their defects.
Moreover, the valorization of persimmon by-products (peels or derived
products from industry) for the extraction of high quality pectin open
new routes in the sustainability of industries focused on persimmon
processing. Thus, this information represents a valuable piece of
knowledge for different industries such as those of food and
Table 4
Particle size (μm) of pectin extracted from astringent and non-astringent
persimmon (peel, pulp and whole fruit) at room temperature with a scattering
angle of 173.
Particle size (μm)
Peel
Astringent
Non-astringent
Pulp
c
1.03 ± 0.04
0.60 ± 0.05b
Whole fruit
a
0.51 ± 0.04
0.54 ± 0.00a
0.80 ± 0.03b
0.57 ± 0.03ab
Averages with the same letter in the same line (a–c) indicate there is no signif
icant difference between the samples (p < 0.05) in Tukey's test.
around 80%, indicating the predominance of the homogalacturonan
domain in the molecule of pectin. Comparing astringent and nonastringent persimmon fruit tissues, the higher content of rhamnose
and the lower GalA/Rham the in the former, concretely in the
persimmon pulp and whole fruit tissues, pointed out a higher presence of
the rhamnogalacturonan I domain in these samples. It is noteworthy the
elevated content of arabinose in all tissues of persimmon underlining the
usefulness of persimmon pectin as a soluble fiber with prebiotic poten
tial. In the case of the other molecular parameters, Mw and DM, hardly
any differences were found between astringent and non-astringent
Fig. 5. Apparent viscosity (η) of persimmon pectins extracted under optimal conditions (120 min, 80 ◦ C and 1.5% sodium citrate) from three different astringent and
non-astringent persimmon tissues (pulp, peel and whole fruit).
8
N. Mu˜
noz-Almagro et al.
Carbohydrate Polymers 272 (2021) 118411
Fig. 6. Changes in the storage modulus (G′ ) and loss modulus (G′′ ) of persimmon pectins extracted under optimal conditions (120 min, 80 ◦ C and 1.5% sodium
citrate) from three different astringent and non-astringent persimmon tissues (pulp, peel and whole fruit).
pharmaceutical sectors.
Supplementary data to this article can be found online at https://doi.
org/10.1016/j.carbpol.2021.118411.
CRediT authorship contribution statement
˜ oz-Almagro: Methodology, Validation, Formal analysis,
Nerea Mun
Investigation, Writing - Original Draft, Writing - Review & Editing,
Visualization.
9
N. Mu˜
noz-Almagro et al.
Carbohydrate Polymers 272 (2021) 118411
Mario Vendrell-Calatayud: Methodology, Validation, Formal
analysis, Investigation, Visualization.
´ndez-Albin
˜ ana: Methodology, Validation, Formal anal
Pablo Me
ysis, Investigation, Visualization.
Rodrigo Moreno: Validation, Formal analysis, Investigation,
Writing, Visualization.
Pilar Cano: Conceptualization, Writing - Review & Editing, Super
vision, Project administration, Funding acquisition.
Mar Villamiel: Conceptualization, Writing - Review & Editing, Su
pervision, Project administration, Funding acquisition.
vivo in humans. European Journal of Nutrition, 38(6), 278–285. />10.1007/s003940050078
Huang, X., Li, D., & Wang, L. (2017). Characterization of pectin extracted from sugar beet
pulp under different drying conditions. Journal of Food Engineering, 211, 1–6.
Jannok, P., Kamitani, Y., & Kawano, S. (2014). Development of a common calibration
model for determining the brix value of intact apple, pear and persimmon fruits by
near infrared spectroscopy. Journal of Near Infrared Spectrosccopy, 22(5), 367–373.
Jiang, Y., Xu, Y., Li, F., Li, D., & Huang, Q. (2020). Pectin extracted from persimmon peel:
A physicochemical characterization and emulsifying properties evaluation. Food
Hydrocolloids, 101, Article 105561. />foodhyd.2019.105561
Kang, J. Q., Hua, X., Yang, R. J., Chen, Y., & Yang, H. (2015). Characterization of natural
low-methoxyl pectin from sunflower head extracted by sodium citrate and purified
by ultrafiltration. Food Chemistry, 180, 98–105. />foodchem.2015.02.037
Lin, Y., An, F., He, H., Geng, F., Song, H., & Huang, Q. (2021). Structural and rheological
characterization of pectin from passion fruit (Passiflora edulis f. flavicarpa) peel
extracted by high-speed shearing. Food Hydrocolloids, 114, 106555.
Liu, Z., Yao, L., & Fan, C. (2015). Optimization of fermentation conditions of pectin
production from Aspergillus terreus and its partial characterization. Carbohydrate
Polymers, 134, 627–634. />Munera, S., Aleixos, N., Besada, C., G´
omez-Sanchis, J., Salvador, A., Cubero, S.,
Talens, P., & Blasco, J. (2019). Discrimination of astringent and deastringed hard
‘Rojo Brillante’ persimmon fruit using a sensory threshold by means of hyperspectral
imaging. Journal of Food Engineering, 263, 173–180. />jfoodeng.2019.06.008
Mu˜
noz-Almagro, N., Montilla, A., & Villamiel, M. (2020). Role of pectin in the current
trends towards low-glycaemic food consumption. Food Research International,
(October), Article 109851. />Mu˜
noz-Almagro, N., Prodanov, M., Wilde, P. J., Villamiel, M., & Montilla, A. (2020).
Obtainment and characterisation of pectin from sunflower heads purified by
membrane separation techniques. Food Chemistry, 318, Article 126476. https://doi.
org/10.1016/j.foodchem.2020.126476
Mu˜
noz-Almagro, N., Rico-Rodriguez, F., Villamiel, M., & Montilla, A. (2018). Pectin
characterisation using size exclusion chromatography: A comparison of ELS and RI
detection. Food Chemistry, 252, 271–276. />foodchem.2018.01.087
Pacheco, M. T., Villamiel, M., Moreno, R., & Moreno, F. J. (2019). Structural and
rheological properties of pectins extracted from industrial sugar beet by-products.
Molecules, 24(3), 392. />Plaza, L., Colina, C., De Ancos, B., S´
anchez-Moreno, C., & Cano, M. P. (2012). Influence
of ripening and astringency on carotenoid content of high-pressure treated
persimmon fruit (Diospyros kaki L.). Food Chemistry, 130, 591–597.
Prusky, D., & Yakoby, N. (2003). Pathogenic fungi: Leading or led by ambient pH?
Molecular Plant Pathology, 4(6), 509–516. />Riedl, J., Linseisen, J., Hoffmann, J., & Wolfram, G. (1999). Some dietary fibers reduce
the absorption of carotenoids in women. The Journal of Nutrition, 129(12),
2170–2176. />Salvador, A., Arnal, L., Besada, C., Larrea, V., Quiles, A., & P´erez-Munuera, I. (2007).
Physiological and structural changes during ripening and deastringency treatment of
persimmon fruit cv. ‘Rojo Brillante’. Postharvest Biology Technology, 46, 181–188.
/>Sugiura, A., Kataoka, I., & Tomana, T. (1983). Use of refractometer to determine soluble
solids of astringent fruits of Japanese persimmon (Diospyros kaki L.). Journal of
Horticultural Science, 58(2), 241–246. />00221589.1983.11515116
Veberic, R., Jurhar, J., Mikulic-Petkovsek, M., Stampar, F., & Schmitzer, V. (2010).
Comparative study of primary and secondary metabolites in 11 cultivars of
persimmon fruit (Diospyros kaki L.). Food Chemistry, 119(2), 477–483. https://doi.
org/10.1016/j.foodchem.2009.06.044
Wang, W., Ma, X., Jiang, P., Hu, L., Zhi, Z., Chen, J., Ding, T., Ye, X., & Liu, D. (2016).
Characterization of pectin from grapefruit peel: A comparison of ultrasound-assisted
and conventional heating extractions. Food Hydrocolloids, 61, 730–739. https://doi.
org/10.1016/j.foodhyd.2016.06.019
Wang, X., Chen, Q., & Lü, X. (2014). Pectin extracted from apple pomace and citrus peel
by subcritical water. Food Hydrocolloids, 38, 129–137. />foodhyd.2013.12.003
Yapo, B. M. (2009). Biochemical characteristics and gelling capacity of pectin from
yellow passion fruit rind as affected by acid extractant nature. Journal of Agricultural
and Food Chemistry, 57(4), 1572–1578. />Zhang, H., Chen, J., Li, J., Yan, L., Li, S., Ye, X., … Chen, S. (2018). Extraction and
characterization of RG-I enriched pectic polysaccharides from mandarin citrus peel.
Food Hydrocolloids, 79, 579–586. />
Declaration of competing interest
The authors declare not conflict of interest.
Acknowledgements
This work has been funded by the Spanish Ministry of Science and
Innovation through projects AGL2014-53445-R, and project INIA
RTA2015-00044-C02-02.
References
Abid, M., Renard, C. M. G. C., Watrelot, A. A., Fendri, I., Attia, H., & Ayadi, M. A. (2016).
Yield and composition of pectin extracted from Tunisian pomegranate peel.
International Journal of Biological Macromolecules, 93(A), 186–194. />10.1016/j.ijbiomac.2016.08.033
Ali Asgar, M., Yamauchi, R., & Kato, K. (2004). Structural features of pectins from fresh
and sun-dried Japanese persimmon fruit. Food Chemistry, 87(2), 247–251. https://
doi.org/10.1016/j.foodchem.2003.11.016
Cano, M. P., G´
omez-Maqueo, A., Fern´
andez-L´
opez, R., Welti-Chanes, J., & GarcíaCayuela, T. (2019). Impact of high hydrostatic pressure and thermal treatment on
the stability and bioaccessibility of carotenoid and carotenoid esters in astringent
persimmon (Diospyros kaki Thunb, var. Rojo Brillante). Food Research International,
123(March), 538–549. />Chan, S. Y., Choo, W. S., Young, D. J., & Loh, X. J. (2017). Pectin as a rheology modifier:
Origin, structure, commercial production and rheology. Carbohydrate Polymers, 161,
118–139. />Clark, C. J., & MacFall, J. S. (2003). Quantitative magnetic resonance imaging of “Fuyu”
persimmon fruit during development and ripening. Magnetic Resonance Imaging, 21
(6), 679–685. />Cutillas-Iturralde, A., Zarra, I., Fry, S. C., & Lorences, E. P. (1994). Implication of
persimmon fruit hemicellulose metabolism in the softening process. Importance of
xyloglucan endotransglycosylase. Physiologia Plantarum, 91(2), 169–176. https://
doi.org/10.1111/j.1399-3054.1994.tb00415.x
Eshel, D., Miyara, I., Ailing, T., Dinoor, A., & Prusky, D. (2002). ph regulates
endoglucanase expression and virulence of Alternaria alternata in persimmon fruit.
Molecular Plant-Microbe Interactions, 15(8), 774–779. />MPMI.2002.15.8.774
Ferreira-Lazarte, A., Moreno, F. J., Cueva, C., Gil-S´
anchez, I., & Villamiel, M. (2019).
Behaviour of citrus pectin during its gastrointestinal digestion and fermentation in a
dynamic simulator (simgi®). Carbohydrate Polymers, 207, 382–390. />10.1016/j.carbpol.2018.11.088
Ge, Z., Zhang, M., Deng, X., Zhu, W., Li, K., & Li, C. (2017). Persimmon tannin promoted
macrophage reverse cholesterol transport through inhibiting ERK1/2 and activating
PPARγ both in vitro and in vivo. Journal of Functional Foods, 38, 338–348. https://
doi.org/10.1016/j.jff.2017.09.023
George, A. P., & Redpath, S. (2008). Health and medicinal benefits of persimmon fruit: A
review. Advances in Horticultural Science, 22(4), 244–249. />100649
Gu, H.-F., Li, C.-M., Xu, Y., Hu, W., Chen, M., & Wan, Q. (2008). Structural features and
antioxidant activity of tannin from persimmon pulp. Food Research International, 41
(2), 208–217. />Han, W., Meng, Y., Hu, C., Dong, G., Qu, Y., Deng, H., & Guo, Y. (2017). Mathematical
model of Ca2+ concentration, pH, pectin concentration and soluble solids (sucrose)
on the gelation of low methoxyl pectin. Food Hydrocolloids, 66, 37–48. https://doi.
org/10.1016/j.foodhyd.2016.12.011
Hoffmann, J., Linseisen, J., Riedl, J., & Wolfram, G. (1999). Dietary fiber reduces the
antioxidative effect of a carotenoid and α-tocopherol mixture on LDL oxidation ex
10