Mapping the surface potential, charge density and adhesion of cellulose nanocrystals using advanced scanning probe microscopy
Bạn đang xem bản rút gọn của tài liệu. Xem và tải ngay bản đầy đủ của tài liệu tại đây (2.22 MB, 8 trang )
Carbohydrate Polymers 246 (2020) 116393
Contents lists available at ScienceDirect
Carbohydrate Polymers
journal homepage: www.elsevier.com/locate/carbpol
Mapping the surface potential, charge density and adhesion of cellulose
nanocrystals using advanced scanning probe microscopy
T
Ankur Goswamia,b,**, Kazi M. Alama, Pawan Kumara, Piyush Kara, Thomas Thundatc,d,
Karthik Shankara,*
a
Department of Electrical and Computer Engineering, University of Alberta, Edmonton, T6G 1H9, Canada
Department of Materials Science and Engineering, Indian Institute of Technology (IIT) Delhi, New Delhi, 11016, India
c
Department of Chemical and Materials Engineering, University of Alberta, Edmonton, T6G 1H9, Canada
d
Department of Chemical and Biological Engineering, University at Buffalo, The State University of New York, Buffalo, NY, 14260, USA
b
A R T I C LE I N FO
A B S T R A C T
Keywords:
Cellulose nanocrystal
Surface charge
KPFM
EFM
Polysaccharides
Nanofibers
Cellulose nanocrystals (CNC) are the focus of significant attention in the broad area of sustainable technologies
for possessing many desirable properties such as a large surface area, high strength and stiffness, outstanding
colloidal stability, excellent biocompatibility and biodegradability, low weight and abundance in nature. Yet, a
fundamental understanding of the micro- and nanoscale electrical charge distribution on nanocellulose still
remains elusive. Here we present direct quantification and mapping of surface charges on CNCs at ambient
condition using advanced surface probe microscopy techniques such as Kelvin probe force microscopy (KPFM),
electrostatic force microscopy (EFM) and force-distance (F–D) curve measurements. We show by EFM measurements that the surface charge in the solid-state (as contrasted with liquid dispersions) present at ambient
condition on CNCs provided by Innotech Alberta is intrinsically negative and the charge density is estimated to
be 13 μC/cm2. These charges also result in CNCs having two times the adhesive force exhibited by SiO2 substrates in adhesion mapping studies. The origin of negative surface charge is likely due to the formation of CNCs
through sulfuric acid hydrolysis where sulfate half esters groups remained on the surface (Johnston et al., 2018).
1. Introduction
industry group in several major economies of the world (Brinchi,
Cotana, Fortunati, & Kenny, 2013; Eichhorn, 2011).
Nanocelluloses (NCs) are semicrystalline polysaccharide fibers isolated from wood pulp, bagasse, hemp and other natural cellulose-rich
sources by mechanical and chemical treatments (Capron, Rojas, &
Bordes, 2017; Kargarzadeh et al., 2018; Sofla, Brown, Tsuzuki, &
Rainey, 2016). These treatments include chemical hydrolysis, mechanical exfoliation and enzymatic approaches (Tan, Heo, Foo, Chew, &
Yoo, 2019). Depending on the preparation methods a significant variation in the crystallinity, hydrophilicity, surface charge, elastic modulus and other physico-chemical properties are observed in the NCs,
based on which they can be categorized in two groups. For instance,
longer semi-crystalline fibrillar structures are called cellulose nanofibers (CNF) whereas the highly crystalline structures are called cellulose
nanocrystals (CNCs). CNFs are flexible, micron-long nanofibers with
widths of 5−20 nm whilst CNCs are 100−500 nm in length and 4−10
nm in diameter (Kafy et al., 2017).
A key potential application area for CNCs and CNFs involves their
Products based on sustainable manufacturing processes and earth
abundant renewable materials have become increasingly important in
the last couple of decades due to concerns related to biodegradability,
environmental pollution, and toxicity risks related to animal and
human health. Cellulose is the most abundant biopolymer in the planet
which is produced at a scale of 1.5 × 10¹² tonnes per year (Klemm,
Heublein, Fink, & Bohn, 2005). In its native form it has been used for
thousands of years in cotton, wood, etc. which directly contributed to
human civilization and cultures. On the other hand, there exist a wide
variety of applications such as food additives, pharmaceuticals, paper
production and construction, where cellulose and its derivatives have
been used for more than a century (Habibi, Lucia, & Rojas, 2010; Ilyas,
Sapuan, Sanyang, Ishak, & Zainudin, 2018; Mariano, El Kissi, &
Dufresne, 2014; Osong, Norgren, & Engstrand, 2016; Zhang, Lin, & Yao,
2015). Therefore, the extraction and manufacture of forest-based products such as textiles, paper, wood and furniture constitutes a major
⁎
Corresponding author.
Corresponding author at: Department of Electrical and Computer Engineering, University of Alberta, Edmonton, T6G 1H9, Canada.
E-mail addresses: (A. Goswami), (K. Shankar).
⁎⁎
/>Received 2 July 2019; Received in revised form 26 April 2020; Accepted 29 April 2020
Available online 04 May 2020
0144-8617/ © 2020 Published by Elsevier Ltd.
Carbohydrate Polymers 246 (2020) 116393
A. Goswami, et al.
surface charge behavior of CNCs synthesized by Innotech Alberta, Canada. Our study had three specific objectives. First, to understand the
surface potential of CNCs, which necessarily derives from the work
function difference, static charge and applied bias of the system using
the KPFM technique. Secondly, to quantify the amount of native charge
present on the surface under ambient condition and map the intrinsic
charges by measuring the frequency shift in EFM technique. Thirdly, to
assess the type of charges prevalent on the surface by injecting additional charge and measuring the resulting frequency shift using the EFM
technique.
incorporation in reinforced polymeric composites and nanocomposites
(Mariano et al., 2014; Miao & Hamad, 2013). CNCs are known to have a
high strength (∼7.6 GPa) as well as a high stiffness (∼130 GPa) (Lee,
Clancy, Kontturi, Bismarck, & Shaffer, 2016), a combination of properties that makes them particularly desirable for use in polymer composites (Dufresne, 2013). While strength measures the total stress that
can be borne by the material before failure, the stiffness is the slope of
the stress-strain curve and measures the resistance of the material to
elastic deformation. The surfaces of CNCs have been chemically modified by techniques such as polymer chain grafting, radical-mediated
surface oxidation and surface esterification (Tang, Sisler, Grishkewich,
& Tam, 2017). Both bare CNCs and surface-functionalized CNCs have
been blended/cross-linked with a variety of hydrophilic and hydrophobic polymers including, but not limited to, poly(lactic acid), polyurethane, poly(ε-caprolactone), poly(vinylcetate), poly(vinylalcohol),
polyethylene, poly(acrylic acid), polyacrylamide, poly(methylmethacrylate) and poly(acrylonitrile). Such CNC-polymer nanocomposites
have been studied for use in light-weight, high strength biodegradable
structural materials (Geng, Haque, & Oksman, 2016), adaptive mechanical and optical components (Fallon, Kolb, Herwig, Foster, &
Bortner, 2019; Ko, Kim, Kim, Lee, & Kim, 2018), gas separation membranes (Jahan, Niazi, Hägg, & Gregersen, 2018), electrically conductive
membranes (Alam et al., 2019; Xiong et al., 2016), proton exchange
membranes (Ni et al., 2018), epoxy resins (Trinh & Mekonnen, 2018)
and stimulus-responsive hydrogels (Kelly et al., 2013). All these applications demand the mixing of both bare and chemically modified
CNCs with diverse solvents, polymers and other additives which in turn,
depends on the interfacial interactions of CNCs. The interfacial properties of CNCs in blends depend on their surface charge density, state of
aggregation, size distribution, etc. In a recent paper, Jakubek et al.
(Jakubek et al., 2018) point out that there exist a number of characterization challenges related to CNCs that are not satisfactorily addressed by currently used techniques such as dynamic light scattering
and electron microscopy. In this work, we use advanced scanning probe
microscopic techniques such as electrostatic force microscopy (EFM)
and scanning Kelvin probe microscopy (KPFM) to measure the surface
charge and charge-redistribution of CNCs.
The colloidal stability of CNC-containing dispersions in solvents and
polymer gels is significantly influenced by the high surface charge
density of CNCs. The bulk properties of nanocellulose gels and suspensions, involving charges, were studied using several rheological
measurements in the past (Li et al., 2015; Shafiei-Sabet, Hamad, &
Hatzikiriakos, 2012). However, the surface charge measurement of
CNCs remained elusive as most of the measurements are carried out
using indirect techniques such as zeta potential measurements
(Prathapan, Thapa, Garnier, & Tabor, 2016) and conductometric titration experiments (Beck, Méthot, & Bouchard, 2015). Zeta potential
depends on the electrostatic potential measurement at the shear plane
which separates the Gouy-Chapman and the Stern layers of the electrostatic double layer (EDL). Hence, this potential is a measurement of
surface charge of the object screened by the tightly bound inner Stern
layer of counterions (Hunter, 1981). On the other hand, conductometric
titration depends on the replacement of ions resulting from a change in
ionic conductivity (Mendham, Denney, Barnes, & Thomas, 2000). In
both these techniques, the measured surface charge of the CNCs depends on the type of solvents used, ionic strength (in case of conductometric titration) and their interaction with the solvent. These
techniques are less relevant when native surface charge in the solidstate is required. Moreover, the surface charge measured by the abovementioned techniques is only an estimate of the gross charge of the
system, and does not allow measurement and mapping of the surface
charge of individual CNCs.
Recently EFM and KPFM were used by some of the co-authors of this
work to estimate the native surface charge of asphaltene and clay
(Gaikwad, Hande, Das, Mitra, & Thundat, 2015; Liu, Gaikwad, Hande,
Das, & Thundat, 2015). Here we extend these techniques to estimate the
2. Experimental section
2.1. Materials
Cellulose nanocrystals were supplied by Innotech Alberta
(Edmonton, Canada). These CNCs were H2SO4 hydrolyzed and extracted from wood pulp. Elemental analysis using CHNS testing indicated that C, H and S content are 40.88, 6.11 and 1.17 wt.% respectively (Alam et al., 2019). There were, as expected, no measurable
quantities of nitrogen. The XRD and Raman spectra of CNCs are shown
in Figs. S1 and S2 respectively (see supporting information).
2.2. Sample preparation
CNC whiskers were obtained from Alberta Innovates in solid form. A
clear non-turbid suspension of CNCs was prepared by dispersing the
CNCs in deionized water using probe sonication for 2 h. Once the
suspension was prepared, a 30 μL droplets from diluted and non-diluted
suspensions were drop casted on a piranha cleaned 500 nm thick
thermally grown silicon oxide wafer (SiO2/Si) and also on a 50 nm Au
coated silicon oxide wafer (SiO2/Si). By baking the wafer at 100 °C on a
hot plate for 3 h, the deposited CNC sample was dried and prepared for
peak force KPFM and EFM measurements (Fig. 1). Thermally grown
oxide wafer was used for EFM measurement whereas Au coated wafer
was used for KPFM measurement. Both these wafers also dried at 100 °C
on a hot plate for 3 h to remove surface water.
2.3. AFM, KPFM and EFM measurements
In order to carry out the AFM, KPFM and EFM measurements, the
samples were grounded by connecting them to the AFM chuck holder
using conductive copper tape. All the surface probe related
Fig. 1. Schematic illustration of sample preparation prior to scanning probe
microscopy.
2
Carbohydrate Polymers 246 (2020) 116393
A. Goswami, et al.
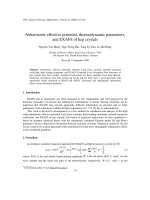
Fig. 2. (a) Topography of NC and its (b) corresponding phase images.
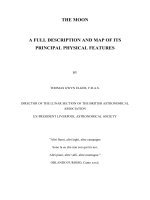
measure the surface potential of the same. Fig. 3a and b show topography and the corresponding surface potential of a CNC layer on top of
gold substrate. However, the scan area of these images (20 × 5 μm2) is
significantly larger than the previous one (1 × 1 μm2). This allows one
to visualize the clear contrast of surface potential of CNC and the gold
substrate. The topography of the magnified region of Fig. 3a is shown in
Fig. 3c, and its corresponding surface potential is shown in Fig. 3d. It is
evident that the surface potential of the CNC is 100 mV negative w.r.t.
the Au substrate.
In order to measure the surface charge distribution, EFM technique
was adopted. In EFM measurement, two major signals are normally
detected. One is surface topography during the trace and the other is
change in frequency or phase of the AFM tip during retrace at a given
constant lift height (z). The conductive AFM tip is sensitive enough to
detect the charges on the surface by measuring the force gradient in the
vertical direction i.e. F ′ (z ) ≡ ∂F / ∂z . The force gradient is due to
Coulombic forces F (z ) generated between the stored charges on the
sample and its image charges on the tip. Therefore, the shift in frequency of the cantilever Δf with respect to the original resonance frequency f0 can be expressed by the following equation at a specific lift
height z = z 0 .
measurements were carried out using a Bruker Icon AFM system (Santa
Barbara, CA). Electrically conducting SCN-PIT probes (App Nano, CA)
with a resonance frequency of 73.8 kHz, quality factor of ∼ 150 with a
30 nm diameter tip were used. There were four cantilevers used in the
entire study and their spring constant were 4.1, 4.2, 4.7 and 4.8 N/m. In
order to image the surface topography and phase response of the CNCs,
tapping mode was adopted. Subsequently, peak force KPFM was conducted in order to image the surface potential of the CNCs. EFM was
carried out to quantify the type and quantity of the native or fundamental charges on the surface. In order to measure the charges on the
surface, EFM scan was performed at various lift heights of the probe
which varied from 40 to 200 nm. Additionally, the tip bias was also
varied from -5 to +5 V DC at an interval of 1 V at individual lift height.
The analyses of the images were performed using Nanoscope analysis
software (V1.40, Bruker). All the experiments were performed at room
temperature (25 °C) and ambient atmosphere at 30–35 % humidity.
3. Results and discussion
The topographical and corresponding phase images of CNC aggregates are shown in Fig. 2a and b. From the height profile in Fig. 2a,
the measured height of individual CNCs is of the order of 8–10 nm (see
Fig. S3 in supporting information) whereas the roughness of the sample
was found to be 3.5 nm (Foster et al., 2018). Parameters describing the
average size of the CNC measured from different AFM images are found
to be 143 ± 20 nm (length) and 18 ± 2 nm (cross section). The average
aspect ratio of individual CNCs is found to be 8 which is seen to be
lower than the literature (Reid, Villalobos, & Cranston, 2017).
The phase image of CNCs as shown in Fig. 2b clearly indicates the
interwoven structure of CNC films which also depicts the variation of
qualitative stiffness of the sample. This qualitative variation of stiffness
across the phase image arises due to the variation in the semicrystalline
nature of the sample. KPFM of CNCs was carried out in order to
Δf
1 ∂F / ∂z (z 0)
=−
f0
2
k
(1)
where f0 = 72 kHz is the resonant frequency and k= 4.2 N/m is the
stiffness of the cantilever used in this study.
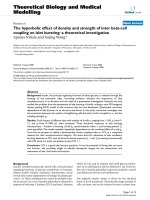
Before performing EFM, a topographic image of one portion of CNC
was chosen. The topographic image (Fig. 4a) indicates the chosen region to be comprised of a bunch of CNCs forming a layer. Fig. 4a and b
show the topography of CNCs while Fig. 4c is the corresponding frequency map of the same taken from the yellow square region of Fig. 4a.
The thickness of the CNC layer and corresponding frequency gradient is
shown in Fig. 4d at 0 V tip bias and 50 nm lift height. Further scanning
Fig. 3. (a) Topography and (b)
Corresponding surface potential measured from KPFM of CNC aggregates on
Au coated SiO2/Si wafer; (c), (d) are
topography and surface potential of
CNCs in the magnified yellow square
region of image (a); (e) shows height
and corresponding surface potential
variation across the red marked line in
images (a) and (b).
3
Carbohydrate Polymers 246 (2020) 116393
A. Goswami, et al.
Fig. 4. (a) Topography of CNC sample (b) Shows the topography of the magnified square area and (c) corresponding frequency mapping at Vtip = 0 V (d) Variation of
height and frequency shift of the CNC sample as compared to the Si/SiO2 wafer (e) shows the topography of the CNC sample taken from the magnified red square area
of Fig. 4(b) and its corresponding frequency mapping in EFM scan (g) and (h) show the height and frequency variation inside the CNC sample through the marked
white line.
the square area marked in red in Fig. 4b, the topography of individual
CNCs can be seen which are entangled with each other (Fig. 4e). The
corresponding frequency map in Fig. 4f depicts the variation in frequencies of the entangled CNCs due to the local variation of charges
present on the surface. Fig. 4g and h show the height of individual CNCs
and the fluctuation of frequencies respectively across the white line
marked on Fig. 4e and f.
In order to measure the charge stored in the entangled CNC layer
(Fig. 4b) we used a parallel plate capacitor model developed by Schaadt
et al. (Schaadt, Yu, Sankar, & Berkowitz, 1999). By considering the CNC
layer as a charged plate with a surface charge density of σ and using the
above parallel plane capacitor model, the force F (z ) exerted on the
cantilever due to the Coulombic interaction is given by the following
expression
F (z ) =
(t *)2σ 2
A
⎡
× −
+
*)2
(z + t */ ε *)2 ⎢
⎣ 2ε0 (ε
2t *Vtip σ
ε*
2
ε0 Vtip
⎤
+
2 ⎥
⎦
is the tip-sample separation or in other words the lift height and VEFM is
the voltage applied to the tip during the EFM scan(tip bias). It is imperative from the first term of the parentheses that its contribution
should be assuming no charge on the native minimal at Vtip = 0 and
therefore, minimum contrast should be observed at zero tip bias provided surface charge is also nearly negligible. However, higher native
surface charge would enhance the contrast at Vtip = 0 which we observe
in Fig. 4c and f. The second term is more pronounced with higher Vtip
and therefore the contrast of the image improves with higher tip bias.
The last term is independent of the native or stored charge of CNCs
which instead contributes to the background frequency shift of the
whole frequency images of EFM measurement. By combining Eqs. (1)
and (2), the following expression can be derived
Δf =
(2)
2
ε0 Vtip
2t *Vtip σ
f0 A
⎡ (t *)2σ 2
⎤
× ⎢−
+
+
3
2
⎥
*)
*
k (z + t */ ε *)
2
ε
(
ε
ε
2
0
⎣
⎦
(3)
The EFM measurements were taken at the same location at +1 V tip
bias by changing the lift height (z), as shown in the Fig. S4 (see supporting information). Fig. 5 shows the variation of Δf with the function
where A is the surface area of the charged region, t * = tsio2 + tCNC is the
thickness of the capacitive layer, ε* is the effective dielectric constant, z
4
Carbohydrate Polymers 246 (2020) 116393
A. Goswami, et al.
Fig. 5. Variation of frequency shift as a function of lift height. The blue curve
shows the fitted plot as per Eq. (3) considering parallel plate EFM model.
Fig. 6. Frequency shift in EFM experiment of CNC particle using various tip bias
under lift mode by injecting no charge and +5 and −5 V charge.
of z and fitted to Eq. (3). The error bar indicates the variation of frequency has been taken from different parts of the plateau area. As expected from Eq. (3), Δf varies inversely with the lift height as the
electrostatic force becomes weaker with increasing tip-sample distance.
A = 1.63 × 10⁻¹³m2 ,
k = 4.2 N/m ,
f0 = 72 kHz ,
Considering
t *=tSiO2 + tCNC = (500 + 67) nm , ε* = 11.1, ε0 = 8.85 × 10⁻¹²
and
Vtip = +1 V , estimated charge density is obtained to be 13 μC/cm2 using
Eq. (2). The regression coefficient is 0.91 implying a good fit of the
analytical model equation to the experimental data of the surface
charge using the existing theoretical model. The estimated charge from
this model matches quite well with the charge measurement on CNC
(0.1–1 e/nm2) performed by conductometric titration or zeta potential
measurements as reported in literature (Reid et al., 2017; Vanderfleet,
Osorio, & Cranston, 2018). Although the above model quantifies the
native permanent charge on the CNC layer, it does not indicate the type
of surface charge (positive or negative), on the sample. In order to find
out the type of charge, the following experiments were performed.
While conducting EFM experiments the major force that the cantilever
can experience depends on the electrical field across which the cantilever is moving. Assuming no charge on the native substrate and on the
particles spread on the substrate, the force gradient on the tip can be
expressed as (Thierry Mélin, Zdrojek, & Brunel, 2010)
∂F
1 ∂ 2C
(z 0) =
(Vtip − VS )2
∂z
2 ∂z 2
frequency only while scanning over the dielectric layer but it is imperative that it is sign insensitive.
Considering Eqs. (4) and (5) above, the following EFM experiments
were carried out and shown in Figs. S5–S7 (see supporting information). In the first case the EFM experiments were conducted on CNC
layer on Si/SiO2 substrate by varying tip bias from −5 V to +5 V at an
interval of +1 V. This experiment results in a parabolic response of
frequency shift with the function of tip bias as shown in Fig. 6 (black
curve). After injecting positive (Vinj= +5 V) and negative charge
(Vinj= −5 V) from the tip to the sample for 5 min by contact mode, the
subsequent EFM experiments were conducted in lift mode. The subsequent EFM experiments at different bias were performed immediately
after the charge injection and the whole experimental time scale was
within 5 min in order to ensure that the dissipation of injected charges
is not significant. It is observed from Fig. 6 that after injecting both
types of charges the parabola becomes clearly asymmetric and is shifted
either to the positive or negative side depending on the charge injection. However, due to negative charge injection the shifting of the
parabola is more towards negative side and shows more asymmetry
compared to the positive charge injection which confirms that the existing charges are negative (Mélin et al., 2004a).
The reason for this asymmetry is explained in the following discussion. Fig. 7(a)–(e) shows EFM images of CNC sample taken at different tip bias with and without charge injection. Fig. 7(f) shows the
corresponding height of the CNC sample. It is observed from Fig. 7(g)
that at zero tip bias when no charge is injected there is no change in
frequency shift from the EFM data. However, at +5 V tip bias a large
frequency shift is observed due to tip substrate capacitance response. As
a result, over all baseline shift of the frequency ( Δft − s )of 145 Hz is
observed. However, while moving through the CNC sample the tip
experiences additional capacitive force because of the native charge of
the CNC sample which results in a further frequency shift ( Δfε ) as shown
in Fig. 7(h), the magnified part of Fig. 7(g). Subsequent to when charge
is injected by setting tip bias to +5 V, the shift of frequency is not
significant as compared to the case without charge injection. However,
when charge is injected by setting tip bias to −5 V, a large frequency
shift is observed. This explains that the CNC material possesses already
negative native charge which gets more influenced when additional
negative charge injection takes place. Therefore, when positive tip bias
is used to measure EFM frequency, the existing negative charge become
more pronounced because of the strong dipole formation. This results in
more Coulombic attraction and thus shows a larger frequency shift.
In order to verify the presence of surface charges in the CNC samples, another indirect method was also adopted using adhesion mapping by employing quantitative nanomechanical analysis (QNM)
(4)
where C (z ) is the tip substrate capacitance and Vs represents the tipsubstrate work function difference. Intuitively capacitive forces exerted
on the cantilever lead to a frequency shift towards the negative end that
varies as a square function of (Vtip − VS ) . However, after introducing or
injecting Q charge from the tip to the substrate and on the CNC sample
rested on the substrate, an effective built-in potential VQ develops at the
tip-substrate and tip-sample interfaces which results in the following
effective force gradient.
∂F
1 ∂ 2C
(z 0) =
[(Vtip − VS )2 − 2(Vtip − VS ) VQ + VQ2]
∂z
2 ∂z 2
(5)
From Eq. (5) it is discernible that because of the introduction of the
charges, there are two additional components added as compared to Eq.
(4) which contribute to the additional force gradient i.e. (Vtip − VS ). VQ
and VQ2 . The first term i.e. (Vtip − VS ). VQ allows us to determine the sign
of the native charges, as depending on the sign of VQ (injected charge)
the first term can alter its sign, and the second term i.e. VQ2 contributes to
the image charge effect which always contribute to a larger negative
frequency shift because of the attractive force gradient (Mélin,
Diesinger, Deresmes, & Stiévenard, 2004; Mélin, Diesinger, Deresmes, &
Stiévenard, 2004). However, the second term (VQ2 ) amplifies the EFM
5
Carbohydrate Polymers 246 (2020) 116393
A. Goswami, et al.
Fig. 7. (a)–(e) show EFM images of the CNC samples. (a) Topography of the CNC samples, EFM frequency images (b) at no charge injection (Q = 0 V) and Vtip = 0 V,
(c) at Q = 0 V, Vtip= +5 V, (d) Q=+5 V, Vtip= +5 V, (e) Q= −5 V, Vtip= +5 V. (f) Height profile of the CNC samples, (g) frequency shift across the CNC sample
at different condition. Applied +5 V tip bias shifts the base line frequency due to tip-sample capacitive force. (h) shows magnified image of square area of (g).
Fig. 8. (a) and (b) show the topography and adhesion mapping of CNC sample respectively. (c) and (d) depicts the topography and adhesion mapping of cleaned Si/
SiO2 wafer respectively. (e) show the comparative histogram of the entire adhesion map images of (b) and (d). The F-D curve measurement (shown in Fig. S8(a) and
(b) (see supporting information)) were done on the small white square mark showed in image (a) and (c) for CNC and Si/SiO2 respectively.
Cleaver, & Hodges, 2002). Therefore, while measuring adhesive force,
the major contribution is from the charges on the CNC surface. The
negative charges originate from residual sulfate groups on the surface of
CNCs obtained from Innotech Alberta that are synthesized through the
hydrothermal sulfuric acid hydrolysis of wood pulp (Johnston et al.,
2018).
(Azzam et al., 2017; Smolyakov et al., 2017; Zhu, Soldatov, & Mathew,
2017). In addition, the force of adhesion is also measured using forceseparation (F-D) curve in contact mode technique. Fig. 8(a) and (b)
show the topography and corresponding adhesion mapping of the CNC
samples while Fig. 8(c) and (d) show the piranha cleaned Si/SiO2 wafer’s topography and its corresponding adhesion map in order to compare two different systems. The adhesion maps clearly indicate that
CNC samples possess a large distribution of the adhesive force as
compared to Si/SiO2 wafer which is likely due to the abundant surface
charge on the former. From the histogram plot of the adhesive mapping
of both SiO2 and CNC surface (as shown in Fig. 8(e)) it is clear that CNC
possesses much more adhesive force than SiO2 which is mostly generated due to the charges present on the CNC surface. From the F-D curve
data on CNC grains and on Si/SiO2 wafer as shown in Fig. S8(a) and (b)
respectively, it is observed that CNC sample has two times higher adhesive force than the Si/SiO2 wafer which signifies the presence of
charges that creates more pull-in force on the tip. It is important to note
that in this case we believe the capillary forces exerted on the tip by
both silicon and CNC surfaces are very minimal as the relative humidity
was maintained at 30–35 % as mentioned before (Jones, Pollock,
4. Conclusions
Here we present mapping and estimation of native surface charge on
CNC sample synthesized by acid hydrolysis method using KPFM and
EFM method at ambient condition. Using a parallel plate model, we are
able to estimate the native surface charge of CNC to be 13 μC/cm2 in its
solid-state form, whereas most of the reports till date are focused on
charge measurement of CNC in liquid suspensions measured by zeta
potential and conductometric titration. By injecting positive and negative charge into the CNC sample and measuring the EFM frequency
shift with different tip bias we found that CNC sample is intrinsically
negative charge which is due to the attachment of SO42− counterions as
sulfate half esters on to the sample. Our KPFM results show that the
6
Carbohydrate Polymers 246 (2020) 116393
A. Goswami, et al.
surface potential of the sample is positive which indicates its work
function is more that Pt/Ir tip and in the order of 5.15 eV∼5.25 eV. The
adhesive mapping and F-z curve shows CNC possesses huge adhesive
force at the surface which is twice the magnitude of clean Si/SiO2
substrate due to the abundant of negative surface charge. This work
showcases the power of advanced SPM techniques in performing noncontact characterization of the physicochemical properties of CNCcontaining films. The native charge detection can provide better
quantitative metrics for blends of CNC with polymers and other functional materials in the development of value added products based on
CNCs.
assembly, and applications. Chemical Reviews, 110(6), 3479–3500.
Hunter, R. J. (1981). Chapter 2 - Charge and potential distribution at interfaces. In R. J.
Hunter (Ed.). Zeta potential in colloid science (pp. 11–58). Academic Press.
Ilyas, R., Sapuan, S., Sanyang, M. L., Ishak, M. R., & Zainudin, E. (2018). Nanocrystalline
cellulose as reinforcement for polymeric matrix nanocomposites and its potential
applications: A review. Current Analytical Chemistry, 14(3), 203–225.
Jahan, Z., Niazi, M. B. K., Hägg, M.-B., & Gregersen, Ø. W. (2018). Cellulose nanocrystal/
PVA nanocomposite membranes for CO2/CH4 separation at high pressure. Journal of
Membrane Science, 554, 275–281.
Jakubek, Z. J., Chen, M., Couillard, M., Leng, T., Liu, L., Zou, S., & Johnston, L. J. (2018).
Characterization challenges for a cellulose nanocrystal reference material: dispersion
and particle size distributions. Journal of Nanoparticle Research, 20(4), 98.
Johnston, L. J., Jakubek, Z. J., Beck, S., Araki, J., Cranston, E. D., Danumah, C., ... Mester,
Z. (2018). Determination of sulfur and sulfate half-ester content in cellulose nanocrystals: An interlaboratory comparison. Metrologia, 55(6), 872.
Jones, R., Pollock, H. M., Cleaver, J. A. S., & Hodges, C. S. (2002). Adhesion forces between glass and silicon surfaces in air studied by AFM: Effects of relative humidity,
particle size, roughness, and surface treatment. Langmuir, 18(21), 8045–8055.
Kafy, A., Kim, H. C., Zhai, L., Kim, J. W., Hai, L. V., Kang, T. J., ... kim, J. (2017). Cellulose
long fibers fabricated from cellulose nanofibers and its strong and tough characteristics. Scientific Reports, 7(1), 17683.
Kargarzadeh, H., Mariano, M., Gopakumar, D., Ahmad, I., Thomas, S., ... Lin, N. (2018).
Advances in cellulose nanomaterials. Cellulose, 25(4), 2151–2189.
Kelly, J. A., Shukaliak, A. M., Cheung, C. C. Y., Shopsowitz, K. E., Hamad, W. Y., &
MacLachlan, M. J. (2013). Responsive photonic hydrogels based on nanocrystalline
cellulose. Angewandte Chemie International Edition, 52(34), 8912–8916.
Klemm, D., Heublein, B., Fink, H. P., & Bohn, A. (2005). Cellulose: Fascinating biopolymer and sustainable raw material. Angewandte Chemie International Edition, 44(22),
3358–3393.
Ko, H.-U., Kim, H. C., Kim, J. W., Lee, J., & Kim, J. (2018). Cellulose nanocrystal based
transparent electroactive polyurethane for active lens application. SPIE.
Lee, W. J., Clancy, A. J., Kontturi, E., Bismarck, A., & Shaffer, M. S. P. (2016). Strong and
stiff: high-performance cellulose nanocrystal/poly(vinyl alcohol) composite fibers.
ACS Applied Materials & Interfaces, 8(46), 31500–31504.
Li, M.-C., Wu, Q., Song, K., Lee, S., Qing, Y., & Wu, Y. (2015). Cellulose nanoparticles:
Structure–Morphology–Rheology relationships. ACS Sustainable Chemistry &
Engineering, 3(5), 821–832.
Liu, J., Gaikwad, R., Hande, A., Das, S., & Thundat, T. (2015). Mapping and quantifying
surface charges on clay nanoparticles. Langmuir, 31(38), 10469–10476.
Mariano, M., El Kissi, N., & Dufresne, A. (2014). Cellulose nanocrystals and related nanocomposites: Review of some properties and challenges. Journal of Polymer Science
Part B, Polymer Physics, 52(12), 791–806.
Mélin, T., Zdrojek, M., & Brunel, D. (2010). Electrostatic force microscopy and kelvin
force microscopy as a probe of the electrostatic and electronic properties of carbon
nanotubes. In B. Bhushan (Ed.). Scanning probe microscopy in nanoscience and nanotechnology (pp. 89–128). Berlin, Heidelberg: Springer Berlin Heidelberg.
Mélin, T., Diesinger, H., Deresmes, D., & Stiévenard, D. (2004a). Electric force microscopy
of individually charged nanoparticles on conductors: An analytical model for quantitative charge imaging. Physical Review B, Condensed Matter, 69(3), 035321.
Mélin, T., Diesinger, H., Deresmes, D., & Stiévenard, D. (2004b). Probing nanoscale dipole-dipole interactions by electric force microscopy. Physical Review Letters, 92(16),
166101.
Mendham, J., Denney, R. C., Barnes, J. D., & Thomas, K. (2000). Vogel`s textbook of
quantitative chemical analysis. England: Prentice Hall.
Miao, C., & Hamad, W. Y. (2013). Cellulose reinforced polymer composites and nanocomposites: A critical review. Cellulose, 20(5), 2221–2262.
Ni, C., Wei, Y., Zhao, Q., Liu, B., Sun, Z., Gu, Y., ... Hu, W. (2018). Novel proton exchange
membranes based on structure-optimized poly(ether ether ketone ketone)s and nanocrystalline cellulose. Applied Surface Science, 434, 163–175.
Osong, S. H., Norgren, S., & Engstrand, P. (2016). Processing of wood-based microfibrillated cellulose and nanofibrillated cellulose, and applications relating to papermaking: A review. Cellulose, 23(1), 93–123.
Prathapan, R., Thapa, R., Garnier, G., & Tabor, R. F. (2016). Modulating the zeta potential
of cellulose nanocrystals using salts and surfactants. Colloids Surface A: Colloids and
Surfaces A, 509, 11–18.
Reid, M. S., Villalobos, M., & Cranston, E. D. (2017). Benchmarking cellulose nanocrystals: From the laboratory to industrial production. Langmuir, 33(7), 1583–1598.
Schaadt, D. M., Yu, E. T., Sankar, S., & Berkowitz, A. E. (1999). Charge storage in Co
nanoclusters embedded in SiO2 by scanning force microscopy. Applied Physics Letters,
74(3), 472–474.
Shafiei-Sabet, S., Hamad, W. Y., & Hatzikiriakos, S. G. (2012). Rheology of nanocrystalline cellulose aqueous suspensions. Langmuir, 28(49), 17124–17133.
Smolyakov, G., Pruvost, S., Cardoso, L., Alonso, B., Belamie, E., & Duchet-Rumeau, J.
(2017). PeakForce QNM AFM study of chitin-silica hybrid films. Carbohydrate
Polymers, 166, 139–145.
Sofla, M. R. K., Brown, R. J., Tsuzuki, T., & Rainey, T. J. (2016). A comparison of cellulose
nanocrystals and cellulose nanofibres extracted from bagasse using acid and ball
milling methods. Advances in Natural Sciences: Nanoscience and Nanotechnology, 7(3),
035004.
Tan, K., Heo, S., Foo, M., Chew, I. M., & Yoo, C. (2019). An insight into nanocellulose as
soft condensed matter: Challenge and future prospective toward environmental sustainability. The Science of the Total Environment, 650, 1309–1326.
Tang, J., Sisler, J., Grishkewich, N., & Tam, K. C. (2017). Functionalization of cellulose
nanocrystals for advanced applications. Journal of Colloid and Interface Science, 494,
397–409.
Trinh, B. M., & Mekonnen, T. (2018). Hydrophobic esterification of cellulose nanocrystals
CRediT authorship contribution statement
Ankur Goswami: Conceptualization, Methodology, Validation,
Formal analysis, Investigation, Writing - original draft, Visualization.
Kazi M. Alam: Investigation. Pawan Kumar: Formal analysis, Writing review & editing, Visualization. Piyush Kar: Methodology, Formal
analysis. Thomas Thundat: Resources. Karthik Shankar:
Conceptualization, Visualization, Supervision, Project administration,
Funding acquisition, Resources.
Acknowledgements
This work was made possible through direct and indirect funding
support from NSERC, Alberta Innovates, FP Innovations, CMC
Microsystems and NRC-NINT. The cellulose nanocrystal samples were
provided by Innotech Alberta. We thank Dr. Wadood Hamad and his
team at FP Innovations for constructive discussions. AG thanks Dr. Jun
Liu from The State University of New York, Buffalo and Ms. Rosmi
Abraham from CME, University of Alberta for helpful discussions on
EFM data analysis.
Appendix A. Supplementary data
Supplementary material related to this article can be found, in the
online version, at doi: />References
Alam, K. M., Kar, P., Thakur, U. K., Kisslinger, R., Mahdi, N., Mohammadpour, A., &
Shankar, K. (2019). Remarkable self-organization and unusual conductivity behavior
in cellulose nanocrystal-PEDOT: PSS nanocomposites. Journal of Materials Science
Materials in Electronics, 30(2), 1390–1399.
Azzam, F., Chaunier, L., Moreau, C., Lourdin, D., Bertoncini, P., & Cathala, B. (2017).
Relationship between Young’s Modulus and film architecture in cellulose nanofibrilbased multilayered thin films. Langmuir, 33(17), 4138–4145.
Beck, S., Méthot, M., & Bouchard, J. (2015). General procedure for determining cellulose
nanocrystal sulfate half-ester content by conductometric titration. Cellulose, 22(1),
101–116.
Brinchi, L., Cotana, F., Fortunati, E., & Kenny, J. (2013). Production of nanocrystalline
cellulose from lignocellulosic biomass: Technology and applications. Carbohydrate
Polymers, 94(1), 154–169.
Capron, I., Rojas, O. J., & Bordes, R. (2017). Behavior of nanocelluloses at interfaces.
Current Opinion in Colloid & Interface Science, 29, 83–95.
Dufresne, A. (2013). Nanocellulose: A new ageless bionanomaterial. Materials Today,
16(6), 220–227.
Eichhorn, S. J. (2011). Cellulose nanowhiskers: Promising materials for advanced applications. Soft Matter, 7(2), 303–315.
Fallon, J. J., Kolb, B. Q., Herwig, C. J., Foster, E. J., & Bortner, M. J. (2019). Mechanically
adaptive thermoplastic polyurethane/cellulose nanocrystal composites: Processdriven structure–property relationships. Journal of Applied Polymer Science, 136(4),
46992.
Foster, E. J., Moon, R. J., Agarwal, U. P., Bortner, M. J., Bras, J., Camarero-Espinosa, S., ...
Youngblood, J. (2018). Current characterization methods for cellulose nanomaterials.
Chemical Society Reviews, 47(8), 2609–2679.
Gaikwad, R., Hande, A., Das, S., Mitra, S. K., & Thundat, T. (2015). Determination of
charge on asphaltene nanoaggregates in air using electrostatic force microscopy.
Langmuir, 31(2), 679–684.
Geng, S., Haque, M. M.-U., & Oksman, K. (2016). Crosslinked poly(vinyl acetate) (PVAc)
reinforced with cellulose nanocrystals (CNC): Structure and mechanical properties.
Composites Science and Technology, 126, 35–42.
Habibi, Y., Lucia, L. A., & Rojas, O. J. (2010). Cellulose nanocrystals: Chemistry, self-
7
Carbohydrate Polymers 246 (2020) 116393
A. Goswami, et al.
conductivity. Advanced Materials, 28(7), 1501–1509.
Zhang, Q., Lin, D., & Yao, S. (2015). Review on biomedical and bioengineering applications of cellulose sulfate. Carbohydrate Polymers, 132, 311–322.
Zhu, C. T., Soldatov, A., & Mathew, A. P. (2017). Advanced microscopy and spectroscopy
reveal the adsorption and clustering of Cu(II) onto TEMPO-oxidized cellulose nanofibers. Nanoscale, 9(22), 7419–7428.
for epoxy reinforcement. Polymer, 155, 64–74.
Vanderfleet, O. M., Osorio, D. A., & Cranston, E. D. (2018). Optimization of cellulose
nanocrystal length and surface charge density through phosphoric acid hydrolysis.
Philosophical Transactions Mathematical Physical and Engineering Sciences, 376(2112),
20170041.
Xiong, R., Hu, K., Grant, A., M, Ma, R., Xu, W., ... Tsukruk, V. V. (2016). Ultrarobust
transparent cellulose nanocrystal-graphene membranes with high electrical
8