The level and distribution of methyl-esters influence the impact of pectin on intestinal T cells, microbiota, and Ahr activation
Bạn đang xem bản rút gọn của tài liệu. Xem và tải ngay bản đầy đủ của tài liệu tại đây (2.82 MB, 12 trang )
Carbohydrate Polymers 286 (2022) 119280
Contents lists available at ScienceDirect
Carbohydrate Polymers
journal homepage: www.elsevier.com/locate/carbpol
The level and distribution of methyl-esters influence the impact of pectin on
intestinal T cells, microbiota, and Ahr activation
´ Jermendi b, M.M.P. Oerlemans a, M.J. Logtenberg b, R. Akkerman a, R. An c, M.
M. Beukema a, *, E.
A. van den Berg d, E.G. Zoetendal c, T. Koster a, C. Kong a, M.M. Faas a, H.A. Schols b, P. de Vos a
a
Immunoendocrinology, Division of Medical Biology, Department of Pathology and Medical Biology, University Medical Center Groningen, Hanzeplein 1, 9713 GZ
Groningen, the Netherlands
Laboratory of Food Chemistry, Wageningen University, Bornse Weilanden 9, 6708 WG Wageningen, the Netherlands
c
Laboratory of Microbiology, Wageningen University & Research, Stippeneng 4, 6708 WE Wageningen, the Netherlands
d
DSM Biotechnology Center, Alexander Fleminglaan 1, 2613 AX Delft, the Netherlands
b
A R T I C L E I N F O
A B S T R A C T
Keywords:
Pectin
Degree of methyl-esterification
Degree of blockiness
T cell
Aryl-hydrocarbon receptor
Microbiota
Short-chain fatty acids
Pectins are dietary fibres that modulate T cell immunity, microbiota composition, and fermentation profiles, but
how this is influenced by the degree of methyl-esterification (DM) and degree-of-blockiness (DB) of pectin is
unknown. Here, we demonstrate that supplementation of DM19(high-DB), DM49(low-DB) and DM43(high-DB)
pectins at a low dose increased the frequencies of intestinal T-helper (Th)1 and Th2 cells after 1 week of pectin
supplementation in mice, whereas DM18(low-DB) did not. After 4 weeks of supplementation with those pectins,
Th1 and Th2 frequencies returned to control levels, whereas Rorγt+ regulatory T-cell frequencies increased.
These structure-dependent effects could derive from induced shifts in microbiota composition that differed be
tween DM18(low-DB) pectin and the other pectins. T-cell-modulating effects were not short-chain-fatty aciddependent, but rather through an increase in Aryl-hydrocarbon-receptor-activating components. Thus, pectins
with a specific combination of DM and DB have an impact on intestinal T cell-immunity in mice, when sup
plemented at a low dose.
1. Introduction
Low dietary fibre intake in the western industrialized countries has
been linked to an increased prevalence of immune-related disorders,
such as inflammatory bowel disease, allergies and autoimmune disor
ders (Berer et al., 2018; Maki & Phillips, 2015; Oliveira et al., 2013;
Sonnenburg & Sonnenburg, 2014; Van Itallie, 1978). These diseases
occur at very low frequencies in more traditional societies that consume
higher fibre diets (Burkitt, Walker, & Painter, 1972; Sonnenburg &
Sonnenburg, 2014). The exact mechanisms explaining how dietary fi
bres prevent the development of these immune-related disorders are not
fully understood. It is believed that a low dietary fibre diets alters gut
microbiota composition and its metabolism that consequently disturbs
host-microbiota interactions (Sonnenburg & Sonnenburg, 2014). Suffi
cient intake of dietary fibre can however influence the intestinal
microbiota composition, which in turn may beneficially stimulate in
testinal immunity (Makki, Deehan, Walter, & Bă
ackhed, 2018).
Recent research showed that the intestinal microbiota modulates T
cell responses that play a central role in intestinal immunity (Pezoldt,
Yang, Zou, & Huehn, 2018). T cell immunity can be influenced by the
intestinal microbiota after recognition of microbiota derived-antigens
that are presented by antigen presenting cells (Pezoldt et al., 2018) or
through the secretion of microbial metabolites, such as short-chain fatty
acids (SCFAs) (Smith et al., 2013) or tryptophan metabolites (Ye et al.,
Abbreviations: Ara, arabinose; Ahr, aryl hydrocarbon receptor; DB, degree of blockiness; DM, degree of methyl-esterification; Gal, galactose; GalA, galacturonic
acid; Glc, glucose; MLN, mesenteric lymph nodes; Mw, molecular weight; Rha, rhamnose; rRNA, ribosomal RNA; SCFA, short-chain fatty acids; Th, T helper cell; TLR,
Toll-like receptor; Treg, regulatory T cell; UA, Uronic acid.
* Corresponding author.
´ Jermendi), (M.M.P. Oerlemans), madelon.
E-mail addresses: (M. Beukema), (E.
(M.J. Logtenberg), (R. Akkerman), (R. An), (M.A. van den Berg), erwin.
(E.G. Zoetendal), (T. Koster), (C. Kong), (M.M. Faas),
(H.A. Schols), (P. de Vos).
/>Received 25 November 2021; Received in revised form 4 February 2022; Accepted 19 February 2022
Available online 23 February 2022
0144-8617/© 2022 The Author(s). Published by Elsevier Ltd. This is an open access article under the CC BY license ( />
M. Beukema et al.
Carbohydrate Polymers 286 (2022) 119280
2017). In particular, the intestinal microbiota can activate effector cells
which are defined by the transcription factors T-bet (T helper 1; Th1),
GATA3 (Th2), and RORγt (Th17) (Eberl, 2016). These effector cells
protect against microbial threats, but excessive responses of these cells
may also lead to the development of inflammatory or autoimmune
diseases, or allergy (Josefowicz, Lu, & Rudensky, 2012; Van Wijk &
Cheroutre, 2010). To maintain intestinal homeostasis, Foxp3 expressing
regulatory T cells (Tregs) balance these exacerbated immune responses
(Josefowicz et al., 2012). The intestinal microbiota may, therefore, be an
effective target to influence T cell immunity and prevent the develop
ment of immune-related disorders (Siracusa, Schaltenberg, Villablanca,
Huber, & Gagliani, 2019).
Pectin is a dietary fibre molecule that has been demonstrated to
modulate T cell responses in a microbiota-dependent manner (Bernard
et al., 2015; Wu et al., 2019). Beneficial effects of pectins depend on its
chemical structure (Chen et al., 2006; Ishisono, Yabe, & Kitaguchi, 2017;
Popov et al., 2013; Sahasrabudhe et al., 2018; Sun et al., 2017; Vogt
et al., 2016). Commercial pectins consist mainly (≥ 70%) of linear 1,4-Dgalacturonic acid (GalA) (homogalacturonan) segments and branched
rhamnogalacturonan segments (Caffall & Mohnen, 2009). The homo
galacturonan backbone can be methyl-esterified (Supplementary Fig. 1),
and the percentage of methyl-esterified GalA residues on the pectin is
determined by the degree of methyl-esterification (DM) (Thakur et al.,
1997). These methyl-esters can also be differently distributed over the
pectin backbone, which is determining the degree of blockiness (DB).
The DB is a structural parameter for the distribution of non-esterified
GalA residues in a pectin. Pectins with a high DB have a more block
wise distribution of non-esterified GalA residues, whereas pectins with a
low DB have a more random distribution of non-esterified GalA residues
(Daas, Meyer-Hansen, Schols, De Ruiter, & Voragen, 1999).
Pectins have anti-inflammatory effects on immunity by direct effects
on Toll-Like-Receptor (TLR) 2–1 signaling or by supporting production
of beneficial microbial products by gut microbiota. The extent to which
pectins have these beneficial effects seem to be dependent on the
structural characteristics of pectin such as the DM and DB (Beukema
et al., 2021; Beukema et al., 2021; Sahasrabudhe et al., 2018). Sahas
rabudhe et al., 2018 demonstrated in vitro that pectins with a low DM
inhibit TLR2–1 signaling stronger than pectins with a high DM (Sahas
rabudhe et al., 2018). Moreover, our group also showed in TLR2
expressing cell-lines that high DM pectins combined with a high DB can
still have TLR2–1 inhibiting capacity despite its high DM (Beukema,
Jermendi, Koster, et al., 2021). Additionally, the DM does also influence
the utilization of pectin by microbiota and the production of metabolic
products as pectins with a different DM induce different effects (Don
gowski, Lorenz, & Proll, 2002; Larsen et al., 2019; Tian et al., 2016; Tian
et al., 2016).
Pectins can modulate microbiota composition, microbial fermenta
tion, and T cell responses (Bernard et al., 2015; Wu et al., 2019), but to
what extent this is influenced by DM and DB is unknown. We hypoth
esized that pectin influences T cell immunity in a DM and DB dependent
manner through modulation of the intestinal microbiota. To investigate
this, healthy mice were supplemented with pectins which differ in DM
and DB at a dose of 3 mg/day. Mice were supplemented for 1–4 weeks to
determine the short and long term effects of pectin supplementation. We
determined the impact on intestinal and systemic T cell frequencies,
microbiota composition, and fermentation profiles of four structurally
different pectins after administration in mice: two low DM pectins and
two high DM pectins and within each DM-group a low DB pectin and a
high DB pectin.
study. Molecular weight, monosaccharide content, the DM, and the DB
were determined as previously described (Beukema, Jermendi, Koster,
et al., 2021).
2. Material and method
2.4. Flow cytometry of T cells
2.1. Pectins
FACSverse flow cytometer system was used to analyze samples (BD
Biosciences Franklin Lakes, USA), using the FACSsuite software. Anal
ysis was performed by FCS Express software version 6 (De Novo Soft
ware, Pasadena, USA).
2.2. Mice
C57BL6 female mice (10 weeks old) were obtained from Janvier
Laboratories, Le Genest-Saint-Isle, France. The experimental use of an
imals was approved by the Animal Ethical Committee of the University
of Groningen (CCD application number AVD1050020171487). All mice
were acclimatized for 1.5 weeks before the start of the experiment.
Animals were cohoused with a total number of 4 mice in individual
ventilated cages. Mice were given ad libitum access to sterilized water
from the tap and RMH-B food (AB Diets, Woerden, The Netherlands)
(Sahasrabudhe et al., 2018). The basal of level of pectin in the diet was
minimal (Tian et al., 2019).
After 1.5 weeks of acclimatization in our facility, mice were fed with
pectins for 1 or 4 weeks. Pectins were administered twice a day through
oral gavage in a volume of 250 μL per gavage (6 mg/mL). Oral admin
istration of this pectin dose was previously determined to induce mini
mal discomfort to animals (Sahasrabudhe et al., 2018). Control mice
received 250 μL of sterile water. Each experimental group contained 8
mice. Mice were anesthetized using isoflurane/O2 and sacrificed by
cervical dislocation. Digesta from caecum was collected for the deter
mination of microbiota composition, fermentation profiles and Aryl
hydrocarbon receptor (Ahr) activating components. Spleen was
collected as representative of systemic immunity (Bronte & Pittet, 2013)
and mesenteric lymph nodes (MLN) were also collected to study the
impact of pectin supplementation on intestinal immunity (Spahn et al.,
2002).
2.3. Isolation of immune cells and flow cytometry of T cells
Cells were isolated from the spleen or MLN for immune cell staining
as previously described (Faas et al., 2020). To stain T cell subsets, 1 ×
106 spleen or MLN cells were transferred to a 96 well plate and centri
fuged at 600 xg for 5 min. at 4 ◦ C. The cells were washed with PBS
(Lonza, Basel, Switzerland) and incubated for 15 min. with ZombieNIR
(Supplementary Tables 1 and 2). Next the cells were washed with FACS
buffer (PBS + 2% dFCS (Sigma Aldrich)) and incubated for 10 min. with
50 μL extracellular blocking buffer (20% (v/v) rat serum (Jackson,
Newmarket, UK), 78% (v/v) FACS buffer and 2% (v/v) FC block (eBio
science, Vienna, Austria) to prevent non-specific binding of antibodies.
This was followed by an incubation of 30 min. with 25 μL extracellular
antibody mix (Supplementary Tables 1 and 2). Then the cell suspension
was washed with FACS buffer and fixed for 30 min. in FACS lysing buffer
(BD Biosciences, Breda, the Netherlands). Next, the cells were washed
twice with permeabilization buffer (Demi water +5% (v/v) PERM
(Invitrogen by Thermo Fisher Scientific, Eugene, OR, USA). Then the
cells were intracellularly blocked for 10 min. with intracellular blocking
buffer (normal rat serum (20% (v/v) in permeabilization buffer). After
this step, the cells were incubated for 30 min. with 50 μL intracellular
antibody mix (Supplementary Tables 1 and 2). Then, the cells were
washed twice with permeabilization buffer. Finally, the cells were
resuspended in 100 μL FACS buffer and stored at 4 ◦ C until analysis
within 16 h. Washing steps included centrifugation at 600 xg for 5 min.
at 4 ◦ C. FMO controls were used to set the gates (Supplementary Fig. 2).
Commercially extracted pectins from lemons (CP kelco, Copenhagen,
Denmark) with DM of 18, 19, 43, and 49% were used in the current
2
M. Beukema et al.
Carbohydrate Polymers 286 (2022) 119280
2.5. Ahr activation assays
Dionex Ultimate 3000 HPLC (Thermo Scientific, Dionex, Sunnyvale, CA,
USA). 10 μL sample was injected to an ion-exclusion Aminex HPX-87H
column (7.8 × 300 mm) combined with a guard column (Bio-Rad,
Hercules CA, U.S.A.). The elution was monitored by refractive index
detection (Shodex RI 101; Showa Denko K.K., Tokyo, Japan). The col
umn temperature was kept at 65 ◦ C. Elution was done with a flow rate of
0.6 mL/min. using 5.0 mM H2SO4 (Ladirat et al., 2014). Standard so
lutions of lactic acid, succinic acid, acetic acid, propionic acid, and
butyric acid were prepared in concentrations of 0.05–3 mg/mL. Data
were processed using Chromeleon 7.2 (Thermo Scientific). SCFA con
centrations were expressed in μmol mg− 1 dry matter to correct for the
potential impact of digest consistency. Dry matter content was deter
mined by drying the samples in an oven overnight at 60 ◦ C.
To study whether caecal digesta samples contained Aryl hydrocar
bon receptor (Ahr) activating components, Ahr activation assay was
performed using HT29-Lucia™ AhR Cells (Invivogen, Toulouse, France)
expressing endogenous Ahr. These reporter cell lines express the
secreted Lucia luciferase reporter gene. The Lucia luciferase reporter
gene is placed under the control of an Ahr-Ahr nuclear transporter
responsive promotor. Upon activation of the Ahr by Ahr-activating
components, high levels of intracellular Ahr will dimerize with Ahr
nuclear translocator which will lead to the secretion of the Lucia lucif
erase reporter protein which can be quantified by LuciaGold substrate
(Invivogen). Ahr-expressing cells were cultured in DMEM culture media
(Lonza) containing 10% dFCS, 50 U/mL Penicillin (Sigma, St. Louis, MO,
USA), 50 μg/mL Streptomycin (Sigma), 100 μg/mL Normocin (Inviv
ogen). The reporter cells were cultured for three passages before they
were maintained in a selection medium containing 100 μg/mL Zeocin
(Invivogen).
Cells were seeded at a density of 50.000 cells/well in a 96 well plate
(Costar) and incubated for 24 h. Next, cells were stimulated with caecal
digesta samples (20 μg/ml). FITZ (50 μg/mL) was used as positive
control and unstimulated cells were used as negative control. After 24 h
of incubation, 20 μL of supernatant was added to 50 μL of LuciaGold
substrate, and bioluminescence (488 nm) was directly measured after
addition using a bioluminometer (Varioskan, Thermo Fisher Scientific).
Experiments were performed at 37 ◦ C and 5% CO2.
2.8. Statistics
Statistical analysis on results was performed using Graphpad Prism
program (La Jolla, CA, USA). Normal distribution of immune and mi
crobial metabolite data was confirmed using the Kolmogorov-Smirnov
test. Data that were not normally distributed were log-transformed
before analysis. Values that are normally distributed, are expressed as
mean ± standard deviation (SD). Statistical comparisons were per
formed using two-way ANOVA. Post-testing between control and
different pectins was performed with Tukey post-test (Statistical differ
ences were indicated with *). Post-testing between week 1 and week 4
was performed with Sidak post-test (Statistical differences were indi
cated with #). Significant correlation between the relative abundance of
genera and the mean of Th1, Th2, or Rorγt+ Treg levels was determined
with Spearman’s rank correlation test. Correlation was considered sig
nificant when the absolute value of Spearman’s rank correlation coef
ficient (Spearman’s r) was >0.6 and statistically significant when p <
0.05. P-values of correlation data were corrected for multiple testing by
the false discovery rate (FDR) of Benjamini–Hochberg (FDR < 0.05).
2.6. Microbiota analysis
Mice digests from caecum were collected from 200 animals, and
immediately stored at − 80 ◦ C. Microbiota composition was determined
by sequencing barcoded 16S ribosomal RNA (rRNA) gene amplicons
while using Illumina Hiseq2500 (2 × 150 bp). DNA was isolated using
Repeated-Bead-Beating (Salonen et al., 2010) and purified using the
Maxwell® 16Tissue LEV Total RNA purification Kit Cartridge
(XAS1220). The V4 region of 16S rRNA gene was amplified in triplicate
using primers and isolated DNA as template. Each 35 μL reaction con
tained 0.7 μL 20 ng/μL DNA template, 7 μL 5 × HF buffer (Thermo Fisher
Scientific, Vilnius, Lithuania), 0.7 μL of 10 mM dNTPs (Thermo Fisher
Scientific), 0.35 μL DNA polymerase (2 U/μL) (Thermo Fisher Scienti
fic), 25.5 μL nuclease free water (Promega, Madison, WI, USA), and 0.7
μL 10 μM of sample-specific barcode-tagged primers. Cycling conditions
were as follows: 98 ◦ C for 30 s, followed by 25 cycles of 98 ◦ C for 10 s,
50 ◦ C for 10 s, 72 ◦ C for 10 s, with a final extension of 7 min. at 72 ◦ C.
Subsequently, the triplicate PCR products were pooled for each sample,
purified with the CleanPCR kit (CleanNA, The Netherlands), and quan
tified using the QubitTM dsDNA BR Assay kit (Invitrogen). An equimolar
mix of purified PCR products was prepared and sent for sequencing
(GATC-Biotech, Konstanz, Germany, now part of Eurofins Genomics
Germany GmbH). Raw sequence reads were subsequently processed
while using NG-Tax 2.0 (Poncheewin et al., 2020) with default settings
and R version 4.0.3. Amplicon sequence variants (ASVs) with less than
0.1% relative abundance were removed. The taxonomic assignment was
performed with a threshold of 80% using the SILVA reference database
release 132 (Quast et al., 2012). Relative abundances of bacteria at
genus and phylum level were calculated using the functions tax_glom and
transform in the phyloseq (McMurdie & Holmes, 2013) and microbiome
(Lahti & Shetty, 2017) R package respectively.
3. Results
3.1. Characterization of pectin
Four pectins that have been demonstrated to induce DM and DB
dependent effects on TLR2 signaling were used in the current study
(Beukema, Jermendi, van den Berg, et al., 2021). The degree (percent) of
methyl-esterification (DM), degree of blockiness (DB), molecular weight
and sugar composition was previously characterized for these pectins
(Table 1; (Beukema, Jermendi, van den Berg, et al., 2021)). The pectins
were homogalacturonan pectins that showed minor differences in sugar
composition. The pectins did however differ in DM or DB. The pectins
can be grouped into two levels of similar DM of ≈19% (DM18 and
DM19) and ≈46% (DM43 and DM49). For each DM group, there was a
pectin with a lower DB (DM18, DM49) and a pectin with a higher DB
(DM19 and DM43). Lower DB pectins with DM18 and DM49 had a
respective DB of 86 and 33, and higher DB pectins with DM19 and DM43
had a DB of 94 and 60, respectively. As low DM pectins have a high
number of non-esterified GalA residues, the DM18 and DM19 pectins
have a high DB, but DM19 has a higher DB than the DM18.
3.2. Pectin supplementation influenced intestinal Th cell subsets more
than systemic Th cell subsets
To study the effect of the structurally different pectins on immuno
logical changes, mice were sacrificed after 1 week and 4 weeks of pectin
administration for the collection of spleens and MLNs. These organs
were used to quantify T cell subsets at systemic and intestinal level,
respectively.
As shown in Fig. 1, splenic T cells and splenic cytotoxic T cell fre
quencies did not change by administration of any of the four pectin
structures neither after 1 nor after 4 weeks of pectin administration. This
2.7. Organic acids profiling
SCFAs were measured in the pooled mice digests from caecum. Be
tween 20 and 150 mg pooled digesta was dissolved in 200 μL nuclease
free water, mixed, and consequently centrifuged (20,000 ×g for 10 min.
on 4 ◦ C). After mixing and centrifugation, 100 μL supernatant was
transferred to vials and used for analysis. SCFAs were quantified using a
3
M. Beukema et al.
Carbohydrate Polymers 286 (2022) 119280
Table 1
Structural characteristics of the pectins. Pectins were characterized for the degree of methyl-esterification (DM), degree of blockiness (DB), molecular weight (Mw),
rhamnose (Rha), arabinose (Ara), galactose (Gal), glucose (Glc), and uronic acid (UA). (Beukema, Jermendi, van den Berg, et al., 2021).
Pectin
DM18
DM19
DM43
DM49
Origin
Lemon
Lemon
Lemon
Lemon
DB (%)
86
94
60
33
Mw
78,000
75,000
79,000
114,000
Sugar composition (mol%)
Carbohydrate content (%)
Rha
Ara
Gal
Glc
UA
1
1
0
0
0
1
0
1
2
3
0
2
0
0
0
0
97
95
99
96
was different for splenic Th cells which did increase after administration
of the different pectins. Most pectins induced a significant increase in
splenic CD4+ T cells after 1 week. The DM18 (low DB) pectin was an
exception as only at 4 weeks and not at 1 week increased CD4+ cells
frequencies were observed. The frequencies of the different CD4+ sub
sets (Th1, Th2, Th17, and Treg) in the spleen from pectin treated mice
did not differ from control mice.
In the MLNs more changes in T cell subsets were observed. Each
specific pectin structure induced distinct changes in the frequencies of
Th1, Th2, Th17, and Treg subsets after 1 or 4 weeks of pectin supple
mentation (Fig. 2) despite unchanged frequencies of Th cells and cyto
toxic T cells. Th1 frequencies significantly increased after 1 week of
supplementation with 51.0% (p < 0.05) in DM19 (high DB) pectin
supplemented mice, with 37.8% (p < 0.001) in DM49 (low DB) pectin
supplemented mice or with 60.3% (p < 0.0001) in DM43 (high DB)
pectin supplemented mice. However, after 4 weeks of supplementation
with these pectins, Th1 frequencies significantly decreased to similar
levels as control mice. Supplementation with DM18 (low DB) pectin
induced a different effect compared to the other pectins, as Th1 fre
quencies were unchanged after 1 week but increased instead of
decreasing after 4 weeks of pectin supplementation. Th2 cells were also
impacted by the three pectins that influenced Th1 as an increase in Th2
was observed after 1 week supplementation of DM19 (high DB) pectin
(53.4%, p < 0.05), DM49 (low DB) pectin (49.5%, p < 0.05) and DM43
(high DB) pectin (65.0%, p < 0.05). In addition, the effects of DM18 (low
DB) pectin were different here, as it did not increase Th2 frequencies.
These increased Th2 frequencies went back to control numbers after 4
weeks supplementation of DM19 (high DB) and DM49 (low DB) pectin
but remained significantly increased with 1.08% (p < 0.05) after DM43
(high DB) pectin supplementation. Moreover, Th17 and Treg fre
quencies were unaffected by DM19 (high DB), DM49 (low DB), and
DM43 (high DB) pectins but did change after DM18 (low DB) pectin
supplementation. Th17 cells were increased with 41.1% (p < 0.05) after
1 week of DM18 (low DB) pectin treatment, but these frequencies
dropped after 4 weeks of pectin supplementation. Treg cells were
enhanced with 25% (p < 0.001) between 1 and 4 weeks of DM18 (low
DB) supplementation, but these frequencies of Tregs were not signifi
cantly different from control mice after 1 or 4 weeks of pectin supple
mentation. Together, the data suggest that each pectin structure
distinctly and specifically impacts T cell immunity in the intestine.
Pectins impact Th cell subsets more in the MLN than in the spleen.
62
63
77
73
for DM43 (high DB) pectin with 4.31% (p < 0.01) after 4 weeks. The
DM43 (high DB) pectin was the only pectin that also increased the fre
quencies of pTregs after 1 week of pectin supplementation (3.41%, p <
0.05). This was specific for the MLN as splenic pTregs and tTregs did not
change after pectin supplementation.
These pTregs and tTregs can be further distinguished by the
expression of specific transcription factors that are also expressed on
Th1 (Tbet), Th2 (GATA3), or Th17 cells (Rorγt) (Koizumi & Ishikawa,
2019). Tbet+ Tregs can be both thymus-derived and peripherally
induced Tregs, GATA3+ Tregs are thymus-derived Tregs, and Rorγt+
Tregs are peripherally induced Tregs (Koizumi & Ishikawa, 2019). Only
Rorγt+ Tregs were increased after supplementation with pectins (Fig. 3).
Rorγt+ Tregs already increased after 1 week supplementation with
23.9% for DM49 (low DB) pectin (p < 0.01) and with 24.5% for DM43
(high DB) pectins (p < 0.01). Effects were more pronounced after 4
weeks of pectin supplementation as Rorγt+ Tregs were significantly
increased with 35.5% (p < 0.01) for DM19 (high DB) pectin, with 37.9%
for DM49 (low DB) pectin (p < 0.01) and with 44.3% for DM43 (high
DB) pectin (p < 0.01). DM18 (low DB) pectin showed only a trend to
wards increased frequencies of Rorγt+ Tregs after 4 weeks of supple
mentation. This implies that DM19 (high DB), DM49 (low DB) and
DM43 (high DB) pectin structures increase peripherally induced Rorγt+
Tregs in the MLN in mice.
3.4. Pectins supplementation did not increase organic acid levels in
caecum, whereas specific pectins enhanced Ahr activating components
Pectins can stimulate the production of organic acids, including
SCFAs which are known to influence T cell immunity (Smith et al.,
2013). Therefore, organic acid concentrations in pooled caecal digesta
were measured from control or pectin supplemented mice (Fig. 4). After
1 week of pectin supplementation, total organic acids levels were lower
in caecal digesta from pectin treated mice compared to control mice
(control: 106 μmol mg− 1; DM18: 50.1 μmol mg− 1; DM19: 48.5 μmol
mg− 1; DM49: 42.7 μmol mg− 1 and DM43: 72 μmol mg− 1). After 4 weeks,
control mice and pectin supplemented mice showed minor changes in
total organic acid content compared to 1 week of pectin supplementa
tion. Control mice showed a total organic acid content of 72.4 μmol
mg− 1, DM18 (low DB) pectin supplemented mice 48 μmol mg− 1, DM19
(high DB) pectin supplemented mice 41.9 μmol mg− 1, DM49 (low DB)
pectin supplemented mice 48.1 μmol mg− 1 and DM43 (high DB) pectin
supplemented mice 43.9 μmol mg− 1. There were no differences
observed in organic acid composition between control and pectin
treated mice after 1 or 4 weeks of pectin supplementation. These results
indicate that the pectin supplementation does not enhance the produc
tion of succinic acid, lactic acid or the SCFAs acetate, butyrate, or pro
pionate in the caecum.
In addition to SCFAs, other microbial-derived metabolites such as
tryptophan metabolites (indole derivatives) can enhance T cell immu
nity by activating the aryl hydrocarbon receptor (Ahr) (Lamas, Nativi
dad, & Sokol, 2018; Ye et al., 2017). Therefore, the Ahr activating
properties of caecal samples from mice supplemented with different
pectins were measured using a reporter cell line that expresses Ahr. As
shown in Fig. 5, Ahr was only activated by caecal digesta from mice
supplemented with specific pectin structures. After 1 week of pectin
3.3. The different pectins increase specific regulatory T cell subsets in the
MLN
The effect of pectin supplementation was further studied by inves
tigating effects on Treg subsets as these may be influenced despite the
absence of effect on total frequencies of Tregs in the MLN. Tregs can be
derived from the thymus (tTreg) or they can be peripherally induced
(pTreg) from naïve CD4+ T cells after antigen stimulation (Koizumi &
Ishikawa, 2019). As shown in Fig. 3A-C, all four tested pectins did in
crease pTregs frequencies in the MLN after four weeks of supplemen
tation but not of tTregs in the MLN. pTregs were enhanced for DM18
(low DB) pectin with 4.43% (p < 0.01), for DM19 (high DB) pectin with
4.31% (p < 0.01), for DM49 (low DB) pectin with 3.40% (p < 0.01) and
4
M. Beukema et al.
Carbohydrate Polymers 286 (2022) 119280
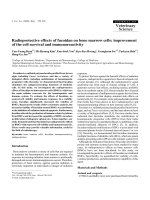
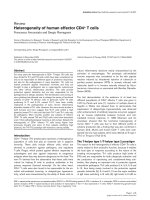
Fig. 1. T cell frequencies of the spleen after 1 and 4 weeks of pectin supplementation. Frequencies of T cells (A), helper T cells (B), cytotoxic T cells (C), Th1 cells (D),
Th2 cells (E), Th17 (F), and regulatory T cells (G) in the spleen of control or pectin supplemented mice. Significant differences between week 1 control and pectin
treated mice or week 4 control and pectin treated mice are indicated by * (* p < 0.05, ** p < 0.01, *** p < 0.001, and **** p < 0.0001). (n = 8 per experi
mental group).
supplementation, a significant increase in Ahr activation was measured
after stimulation with digesta from DM19 (high DB) pectin (47.36% vs.
control, p < 0.0001) and DM49 (low DB) pectin (36.72% vs. control, p <
0.05) supplemented mice. In addition, Ahr was also activated after
stimulation with caecal digesta samples from mice that were supple
mented with DM19 (high DB), DM49 (low DB) and DM43 (high DB)
pectins for 4 weeks (DM19: 56.86% vs. control, (p < 0.0001); DM49:
49.72% vs. control, (p < 0.01); DM43: 45.0% vs. control, (p < 0.05)).
Together these results suggest that pectin supplementation in the
current study does not enhance SCFA production, but that DM19 (high
DB), DM49 (low DB) and DM43 (high DB) pectin structures enhance
Ahr-activation in the caecum of mice.
3.5. The impact of pectin supplementation on the caecal microbiota
composition
To study the impact of the different pectin structures on the intestinal
microbiota composition, 16S rRNA gene amplicon sequencing was
5
M. Beukema et al.
Carbohydrate Polymers 286 (2022) 119280
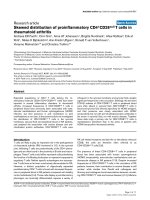
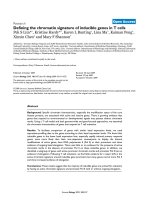
Fig. 2. T cell frequencies of the MLN after 1 and 4 weeks of pectin supplementation. Frequencies of T cells (A), helper T cells (B), cytotoxic T cells (C), Th1 cells (D),
Th2 cells (E), Th17 (F), and regulatory T cells (G) in the MLN of control or pectin supplemented mice. Statistically significant differences between week 1 control and
pectin treated mice or week 4 control and pectin treated mice are indicated by * (* p < 0.05, ** p < 0.01, *** p < 0.001, and **** p < 0.0001). Statistical differences
between week 1 and week 4 within control or pectin groups are indicated by # (# p < 0.05, ## p < 0.01, ### p < 0.001).
performed. Some genera were influenced by all pectins, whereas other
genera were changed by specific pectins (Fig. 6, Supplementary
Table 3). The DM19 (high DB), DM49 (low DB), and DM43 (high DB)
pectins supplementation lead to a relatively similar microbiota compo
sition in mice after 1 and 4 weeks of pectin supplementation, but this
was different from the microbiota composition of control mice or mice
supplemented with the DM18 (low DB) pectin (Fig. 6, Supplementary
Table 3). After 1 week of pectin supplementation, the relative abun
dance of Muribaculaceae spp. was 3.66% lower for DM19 (high DB),
7.93% for DM49 (low DB), and 13.58% for DM43 (high DB) pectins
compared to control mice, whereas the relative abundance of this genus
was 1.62% higher by DM18 (low DB) supplementation. The 4 weeks of
pectin supplementation led to even more differences in microbiota
composition between DM19 (high DB), DM49 (low DB), DM43 (high
DB) pectins and the DM18 (low DB) pectin. Compared to control mice,
the relative abundance of the genera Lachnospiraceae NK4A136, Desul
fovibrionaceae spp., and Alloprevotella were strongly increased by DM19
(high DB) pectin with a respective 12.25%, 3.58%, and 2.57%, DM49
(low DB) pectin with a respective 9.34%, 1.44%, and 1.23%, and DM43
(high DB) pectin with a respective 11.58%, 1.17%, and 0.85%. However,
6
M. Beukema et al.
Carbohydrate Polymers 286 (2022) 119280
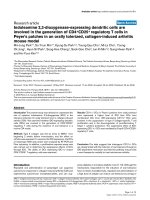
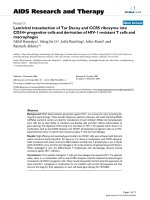
Fig. 3. Regulatory T cell frequencies of the MLN after 1 and 4 weeks of pectin supplementation. Peripheral induced Tregulatory cells (pTreg) and Thymus derived
Tregulatory cells (tTreg) were selected by plotting Foxp3 and Helios from CD3+CD4+ T cells (A). Frequencies of pTregs (B), tTregs (C), Foxp3+Tbet+ Tregs (D),
Foxp3+GATA3+ Tregs (E), and Rorγt+ Tregs (F) within CD4+ population in the MLN of control or pectin supplemented mice. Statistical significant differences
between week 1 control and pectin treated mice or week 4 control and pectin treated mice are indicated by * (* p < 0.05, ** p < 0.01, *** p < 0.001, and **** p <
0.0001). Statistical differences between week 1 and week 4 within control or pectin groups are indicated by #.
On the contrary, the relative abundance of the genera of Lactobacillus
and Lachnospiraceae spp. were respectively 4.21% and 5.2% higher in
DM18 (low DB) pectin supplemented mice, whereas the relative abun
dance was decreased by supplementation of the other pectin structures.
These studies demonstrate, therefore, that the DM19 (high DB), DM49
(low DB), and DM43 (high DB) pectins change the microbiota compo
sition in mice differently than DM18 (low DB) pectin.
To investigate which specific genera may positively correlate to the
pectin-induced increase of Th1 levels, Th2 levels, and Rorγt+ Treg fre
quencies, we performed a Spearman correlation test (Table 2). As the
genus Lachnoclostridium significantly correlated (p < 0.05, FDR < 0.05)
with Th1 and Th2 levels, the increase in the abundance of Lachnoclos
tridium may be responsible for the increase in Th1 and Th2 levels after 1
week of DM19 (high DB), DM49 (low DB), DM43 (high DB) pectin
supplementation. Furthermore, the relative abundance of Lachnospir
aceae NK4A136 (p < 0.01, FDR < 0.05) and Ruminococcaceae UCG-003
(p < 0.05, FDR < 0.05) positively correlated to Rorγt+ Treg levels. The
relative abundance of Lachnospiraceae NK4A136 did also change dras
tically by DM19 (high DB), DM49 (low DB), and DM43 (high DB) pectin
supplementation (Fig. 6), suggesting that the increase in relative abun
dance of Lachnospiraceae NK4A136 may be responsible for the increase
in Rorγt+ Treg frequencies. This was not the case for Ruminococcaceae
UCG-003.
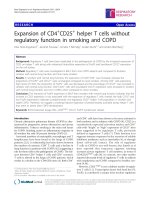
Fig. 4. Amount of organic acid profiles in caecal digesta. The amount of SCFAs
in pooled caecal digesta samples from control mice or from mice supplemented
with DM18, DM19, DM49 or DM43 pectins.
the relative abundance after DM18 (low DB) pectin supplementation
were only 2.52% higher for Lachnospiraceae NK4A136, and respectively
1.32% and 0.65% lower for Desulfovibrionaceae spp. and Alloprevotella.
7
M. Beukema et al.
Carbohydrate Polymers 286 (2022) 119280
The current study shows that supplementation with DM19 (high DB),
DM49 (low DB), and DM43 (high DB) pectins influences Th1, Th2 and
Rorγt+ Treg cell immunity in mice, whereas this was not influenced by
DM18 (low DB) pectins which are known to have inhibiting effects on
innate immune receptors such as TLR2–1 (Beukema, Jermendi, Koster,
et al., 2021; Sahasrabudhe et al., 2018) and induce anti-inflammatory
effects in mice with TLR2-mediated mucositis (Beukema, Jermendi,
van den Berg, et al., 2021). Both DM18 (low DB) pectin and DM19 (high
DB) pectins showed a similar level of TLR2–1 inhibition, which can be
related to the relatively similar DM and DB of these pectins (Beukema,
Jermendi, Koster, et al., 2021). In the current study these pectins
showed, however, a different impact on T cell immunity, which can only
be explained by the small difference (8%) in DB. The DM19 (high DB)
pectin, that had an impact on T cell immunity, has a little more block
wise distribution of non-esterified GalA residues than the DM18 (low
DB) pectin, which had no impact on T cell immunity. This difference in
the number of blockwise distributed non-esterified GalA residues may
however be negligible as both DM18 (DB84%) and DM19 (DB94%)
possess very high level of blockwise distributed non-esterified GalA
residues (Beukema, Jermendi, Koster, et al., 2021). It is more likely that
methyl-esterified GalA residues play a role in the impact on T cell, since
pectins with more methyl-esterified GalA residues (DM49 and DM43)
also show effects on T cell immunity.
Our data demonstrate that the low dose of DM19 (high DB), DM49
(low DB), and DM43 (high DB) pectins specifically induced a different
microbiota composition compared to the DM18 (low DB) pectin after 1
and/or 4 weeks of pectin supplementation. A difference was observed
for Lachnospiraceae NK4A136, Desulfovibrionaceae unidentfied, Allopre
votella, Lactobacillus, and Lachnospiraceae spp.. Microbes from Lachno
spiraceae, Desulfovibrionaceae, Lactobacillus and Alloprevotella are
known to be enhanced after pectin stimulation (Tian, Scholte, et al.,
2016; Zhu et al., 2020), and may utilize pectins using enzymes, such as
pectin lyase, pectin methylesterase, and polygalacturonase that facili
tate the breakdown of pectin molecules (Dongowski et al., 2002). A
difference in structural patterns between the pectins may however be
responsible for the different microbial stimulating effects. Such struc
tural dependent effect of pectins on microbiota composition was also
Fig. 5. Presence of Ahr ligands in caecal digesta. The presence of indole de
rivatives in caecal digesta samples was measured with an aryl hydrocarbonreporter (Ahr) reporter cell line. Caecal digesta from control mice or from
mice supplemented with DM18 (low DB), DM19 (high DB), DM49 (low DB) or
DM43 (high DB) pectins was tested for Ahr activating properties. Statistical
significant differences are indicated by * (* p < 0.05, ** p < 0.01, and **** p
< 0.0001).
4. Discussion
Several studies have demonstrated that pectin beneficially influences
intestinal immunity and prevents intestinal inflammation and diseases
(Ishisono, Mano, Yabe, & Kitaguchi, 2019; Jiang et al., 2016; Sahasra
budhe et al., 2018; Sun et al., 2017; Wu et al., 2019). The exact mech
anisms responsible for these protective effects of pectins are not fully
understood and it is also unknown which structural features of pectins
are responsible for beneficial effects. The current study demonstrates
that beneficial effects are not derived from a general characteristic of
pectins but that pectins with a specific DM and DB are responsible for
distinctive modulation of T cell intestinal immunity in mice.
Fig. 6. Relative abundance genera in the microbiota of mice in the control or pectin groups. The relative abundance of different microbes on genus level was
determined from pooled caecal digesta of control mice or from mice supplemented with DM18 (low DB), DM19 (high DB), DM49 (low DB) or DM43 (high DB) pectins
for 1 or 4 weeks.
8
M. Beukema et al.
Ruminococcaceae
found for the DM difference in low and high DM pectins, where the low
number of methyl-esterified GalA residues in low DM pectins induced
different alterations of specific microbes than pectins with higher
numbers of methyl-esterified GalA residues (Dongowski et al., 2002;
Tian, Scholte, et al., 2016). In the tested pectins, a difference in distri
bution of methyl-esterified GalA residues might be responsible for the
different effects in low DM pectins. The low DM pectins with a high DB
might have a higher level of blockwise distributed methyl-esterified
GalA residues compared to low DB pectins as the blocks of nonesterified GalA residues may also cluster the methyl-esterified GalA
residues (Jermendi et al., 2022). These blocks of methyl-esterified GalA
residues in the high DB pectin may be differently fermented by microbial
derived enzymes compared to the low DB pectin. However, a more indepth analysis to the distribution of methyl-esterified GalA residues
and non-esterified GalA residues (Jermendi et al., 2022) might give
more insight in whether the presence of blockwise distributed methylesterified GalA residues may play a role in the effects on microbiota
composition.
It is however unlikely that the pectins are used to significantly
enhance the growth of the microbes as the dose (3 mg/day) of pectins
constitute 0.1% of the daily food intake of mice (Bachmanov, Reed,
Beauchamp, & Tordoff, 2002), which is much lower than 3% in the
study of Tian et al. (Dongowski et al., 2002; Tian, Scholte, et al., 2016).
It is more likely that the low dose of the specific pectin structures
initially stimulate the growth of these microbes, which further used
other nutritional components in the food, such as arabinoxylan or
β-glucan (Tian et al., 2019), as growth substrate. This can also explain
the lack of SCFA enhancement after pectin supplementation, which was
found after supplementation with a higher dose of pectin (Dongowski
et al., 2002; Tian, Scholte, et al., 2016). Together, these studies suggest
that the supplementation of DM19 (high DB), DM49 (low DB), and
DM43 (high DB) initiates a different microbiota composition compared
to the DM18 (low DB) pectin, which might result in a different stimu
lation of specific microbial communities that may have the ability to
induce T cell immunity.
Supplementation of DM19 (high DB), DM49 (low DB), and DM43
(high DB) pectins for 1 week induced an increase in Th1 and Th2 fre
quencies, which returned to control levels after 4 weeks supplementa
tion of these pectins. These increased frequencies of Th1 and Th2
significantly correlated to an increased level of Lachnoclostridium, which
suggests that microbes from Lachnoclostridium have immune-stimulatory
effects and may be responsible for the Th1 and Th2 inducing effects. The
exact mechanism through which Lachnoclostridium exerts Th1 and Th2stimulating effects need to be further explored, but it may derive from
Lachnoclostridium-derived antigens or metabolic products, as these
compounds were found to enhance Th1 and Th2 responses (Berer et al.,
2018; Eberl, 2016).
Our data demonstrate that supplementation with the DM19 (high
DB), DM49 (low DB), and DM43 (high DB) pectins also increased the
generation of Rorγt+ Tregs in the MLN. The stimulation of the genera
tion of Rorγt+ Tregs is dependent on the intestinal microbiota compo
sition (Yang et al., 2016). Specific microbiota species can enhance the
generation of Rorγt+ Tregs through enhancing the production of
microbial-derived metabolites (Hussein et al., 2020; Lozano-Ojalvo
et al., 2019; Ohnmacht et al., 2015; Song et al., 2020). The microbialderived metabolites that enhance Rorγt+ Tregs are probably not SCFAs
as there was no enhancement of SCFA profiles measured after pectin
treatments in the administered pectin concentrations. This is in line with
previous findings showing no enhancement of SCFAs after pectin sup
plementation in this pectin dose in mice (Sahasrabudhe et al., 2018). It is
more likely that microbial-derived metabolites which activate the
aryl‑hydrogen receptor (Ahr) are responsible for the generation of
Rorγt+ Tregs in these mice, because our data showed high activation of
Ahr after stimulation with digesta from DM19 (high DB), DM49 (low
DB), and DM43 (high DB) pectin supplemented mice. The relative
abundance of genera Lachnospiraceae NK4A136 increased drastically
Significant correlation was determined with Spearman’s rank correlation test. Correlation was considered significant when the absolute value of Spearman’s rank correlation coefficient (Spearman’s r) was >0.6 and
statistically different when p < 0.05 (* p < 0.05; ** p < 0.01 and p < 0.001). Significance was defined by FDR < 0.05. ns = not significantly different.
**
ns
ns
0.40
0.22
0.22
0.00
0.00
0.21
0.19
0.21
0.17
1.34
15.74
Lachnoclostridium
Lachnospiraceae
NK4A136
Ruminococcaceae UCG003
Lachnospiraceae
Lachnospiraceae
0.00
DM49
0.82
13.50
0.98
16.41
DM19
DM18
0.70
6.68
1.44
4.16
Control
2.65
18.43
1.12
13.02
1.26
8.75
DM49
DM19
DM18
1.11
8.03
Week 4
Control
DM43
Week 1
Relative abundance (%)
Taxon genus
Taxon family
Table 2
Relative abundance of genera that positively correlate significantly with Ahr activation or Rorγt+ Treg levels.
1.05
6.45
DM43
*
ns
Correlation with Th1
levels
*
ns
Correlation with Th2
levels
ns
**
Correlation with Rorγt+ Treg
levels
Carbohydrate Polymers 286 (2022) 119280
9
M. Beukema et al.
Carbohydrate Polymers 286 (2022) 119280
and correlated positively to Rorγt+ Treg levels, suggesting that microbes
from these genera may be responsible for the production of molecules
with Ahr activating properties. Microbes from Lachnospiraceae were
correlated before to the production of indole derivatives, which are
tryptophan converted metabolites with Ahr activating properties
(Amaretti et al., 2019; Vacca et al., 2020). These tryptophan metabolites
may stimulate the Ahr on Rorγt+ Tregs, which are highly expressed by
these cells in the intestine (Ye et al., 2017), and stimulate the expansion
of Rorγt+ Tregs as was observed in our study (Ye et al., 2017). Yet, we
did not find a strong correlation between the increase in Ahr activating
components in the cecal digesta and the increase in this Lachnospiraceae
NK4A136. However, the relative abundance does not reveal the absolute
load of Lachnospiraceae NK4A136 in caecal digesta which might
correlate to a significant increase in Ahr activation. Future studies
should therefore focus on the absolute abundance of microbiota
composition besides the relative abundance. Collectively, our findings
suggest that the 4 weeks of supplementation of DM19 (high DB), DM49
(low DB), and DM43 (high DB) pectins increases the relative abundance
of Lachnospiraceae NK4A136 which may produce large amounts of
indole derivatives which leads to the generation of Rorγt+ Tregs cells
(Amaretti et al., 2019; Vacca et al., 2020).
The current study found that an increase in Rorγt+ Tregs coincides
with a decrease in Th1 and Th2 responses after 4 weeks of pectin sup
plementation. Rorγt+ Tregs play an important role in suppressing im
mune responses of effector T cells and are reported to prevent e.g. the
development of colitis (Britton et al., 2019; Yang et al., 2016). Ohn
macht et al., 2015 demonstrated that Rorγt+ Tregs have suppressive
functions on Th2 cell responses (Ohnmacht et al., 2015). Another study
also showed that lack of Rorγt+ Tregs increases Th1 and Th17 responses
(Sefik et al., 2015). These studies suggest that the increasing frequencies
of Rorγt+ Tregs after supplementation of DM19 (high DB), DM49 (low
DB), and DM43 (high DB) pectins may be responsible for the suppression
of Th1 and Th2 responses after 4 weeks of pectin supplementation,
whereas the 1 week supplementation of the pectins may not sufficiently
increase Rorγt+ Tregs to reduce the pectin-induced increase in Th1 and
Th2 cells. Together, our results suggest that supplementation with DM19
(high DB), DM49 (low DB), and DM43 (high DB) pectins enhances the
generation of Rorγt+ Tregs which may suppress Th1 and Th2 responses
after 4 weeks of pectin supplementation.
Jermendi: Conceptualization, Data curation, Formal analysis, Investi
gation, Writing – original draft. M.M.P. Oerlemans: Data curation,
Formal analysis, Investigation, Writing – review & editing. M.J. Log
tenberg: Data curation, Formal analysis, Investigation, Writing – review
& editing. R. Akkerman: Data curation, Formal analysis, Investigation,
Writing – review & editing. R. An: Data curation, Formal analysis,
Investigation, Writing – review & editing. M.A. van den Berg: Re
sources, Conceptualization, Investigation, Writing – review & editing. E.
G. Zoetendal: Formal analysis, Investigation, Writing – review & edit
ing. T. Koster: Data curation, Formal analysis, Investigation. C. Kong:
Data curation, Formal analysis, Investigation. M.M. Faas: Supervision,
Validation, Writing – review & editing. H.A. Schols: Conceptualization,
Funding acquisition, Supervision, Validation, Writing – review & edit
ing. P. de Vos: Conceptualization, Funding acquisition, Supervision,
Validation, Writing – review & editing.
Declaration of competing interest
The authors declare that they have no known competing financial
interests or personal relationships that could have appeared to influence
the work reported in this paper.
Acknowledgements
Research of Martin Beukema was performed within the publicprivate partnership ‘CarboKinetics’ coordinated by the Carbohydrate
Competence Center (CCC, www.cccresearch.nl). CarboKinetics is
financed by participating industrial partners Agrifirm Innovation Center
B.V., Nutrition Sciences B.V., Cooperatie Avebe U.A., DSM Food Spe
cialties B.V., and VanDrie Holding N.V., and allowances of The
Netherlands Organisation for Scientific Research (NWO).
Appendix A. Supplementary data
Supplementary data to this article can be found online at https://doi.
org/10.1016/j.carbpol.2022.119280.
References
Amaretti, A., Gozzoli, C., Simone, M., Raimondi, S., Righini, L., P´erez-Brocal, V., GarcíaL´
opez, R., Moya, A., & Rossi, M. (2019). Profiling of protein degraders in cultures of
human gut microbiota. Frontiers in Microbiology, 10, 2614. />fmicb.2019.02614
Bachmanov, A. A., Reed, D. R., Beauchamp, G. K., & Tordoff, M. G. (2002). Food intake,
water intake, and drinking spout side preference of 28 mouse strains. Behavior
Genetics, 32, 435–443. />Berer, K., Martínez, I., Walker, A., Kunkel, B., Schmitt-Kopplin, P., Walter, J., &
Krishnamoorthy, G. (2018). Dietary non-fermentable fiber prevents autoimmune
neurological disease by changing gut metabolic and immune status. Scientific Reports,
11(8), 10431. />Bernard, H., Desseyn, J. L., Bartke, N., Kleinjans, L., Stahl, B., Belzer, C., Knol, J.,
Gottrand, F., & Husson, M. O. (2015). Dietary pectin-derived acidic oligosaccharides
improve the pulmonary bacterial clearance of Pseudomonas aeruginosa lung
infection in mice by modulating intestinal microbiota and immunity. Journal of
Infectious Diseases, 11, 156–165. />´ Koster, T., Kitaguchi, K., Haan, B. J., Berg, M. A., Faas, M. M.,
Beukema, M., Jermendi, E.,
Schols, H. A., & Vos, P. (2021). Attenuation of doxorubicin-induced small intestinal
mucositis by pectins is dependent on Pectin’s methyl-ester number and distribution.
Molecular Nutrition & Food Research, 65(18), Article 2100222. />10.1002/mnfr.202100222
´ van den Berg, M. A., Faas, M. M., Schols, H. A., & de Vos, P.
Beukema, M., Jermendi, E.,
(2021). The impact of the level and distribution of methyl-esters of pectins on TLR21 dependent anti-inflammatory responses. Carbohydrate Polymers, 251, Article
117093. />Britton, G. J., Contijoch, E. J., Mogno, I., Vennaro, O. H., Llewellyn, S. R., Ng, R., Li, Z.,
Mortha, A., Merad, M., Das, A., Gevers, D., McGovern, D. P. B., Singh, N., Braun, J.,
Jacobs, J. P., Clemente, J. C., Grinspan, A., Sands, B. E., Colombel, J. F.Faith, J. J., …
(2019). Microbiotas from humans with inflammatory bowel disease Alter the
balance of gut Th17 and RORγt+ regulatory T cells and exacerbate colitis in mice.
Immunity, 50, 212–224. />Bronte, V., & Pittet, M. J. (2013). The spleen in local and systemic regulation of
immunity. Immunity, 39, 806–818. />Burkitt, D. P., Walker, A. R. P., & Painter, N. S. (1972). Effect of dietary fibre on stools
and transit-times, and its role in the causation of disease. The Lancet, 2, 1408–1412.
5. Concluding remarks
In the current study, we hypothesized that pectin influences T cell
immunity in a DM and DB dependent manner through modulation of the
intestinal microbiota. Our study demonstrates that supplementation
with a low dose of DM19 (high DB), DM49 (low DB) or DM43 (high DB)
pectins induces the generation of Th1, Th2, and Rorγt+ Tregs in mice.
This increase in Th1 and Th2 frequencies may be induced by an
increased relative abundance of Lachnoclostridium after 1 week of
pectin supplementation. The increased frequencies of Rorγt+ Tregs may
relate to an enhanced production of Ahr activating metabolites from
Lachnospiraceae NK4A136 and Ruminococcaceae UCG-003 after 4
weeks of pectin supplementation. Besides, these Rorγt+ Tregs may
reduce Th1 and Th2 levels back to control levels after 4 weeks of pectin
supplementation. This knowledge may be important for the design of
functional foods with anti-inflammatory properties. Consumers may
benefit from consuming a low dose of DM19 (high DB), DM49 (low DB)
and DM43 (high DB) as the increased levels of Rorγt+ Tregs may prevent
the development of Th1 and Th2-mediated intestinal diseases, such as
Crohn’s disease and Ulcerative colitis (Britton et al., 2019; Imam et al.,
2018)), and restore intestinal homeostasis (Eberl, 2016).
CRediT authorship contribution statement
M. Beukema: Conceptualization, Data curation, Formal analysis,
´
Investigation, Project administration, Writing – original draft. E.
10
M. Beukema et al.
Carbohydrate Polymers 286 (2022) 119280
Caffall, K. H., & Mohnen, D. (2009). The structure, function, and biosynthesis of plant
cell wall pectic polysaccharides. Carbohydrate Research, 344, 1879–1900.
Chen, C. H., Sheu, M. T., Chen, T. F., Wang, Y. C., Hou, W. C., Liu, D. Z., Chung, T. C., &
Liang, Y. C. (2006). Suppression of endotoxin-induced proinflammatory responses by
citrus pectin through blocking LPS signaling pathways. Biochemical Pharmacology, 72
(8), 1001–1009.
Daas, P. J. H., Meyer-Hansen, K., Schols, H. A., De Ruiter, G. A., & Voragen, A. G. J.
(1999). Investigation of the non-esterified galacturonic acid distribution in pectin
with endopolygalacturonase. Carbohydrate Research, 318, 135–145. />10.1016/S0008-6215(99)00093-2
Dongowski, G., Lorenz, A., & Proll, J. (2002). The degree of methylation influences the
degradation of pectin in the intestinal tract of rats and in vitro. The Journal of
Nutrition, 132, 1935–1944. />Eberl, G. (2016). Immunity by equilibrium. Nature Reviews Immunology, 16, 524–532.
/>Faas, M. M., Liu, Y., Borghuis, T., van Loo-Bouwman, C. A., Harmsen, H., & de Vos, P.
(2020). Microbiota induced changes in the immune response in pregnant mice.
Frontiers in Immunology, 10, 2976. />Hussein, H., Denanglaire, S., Van Gool, F., Azouz, A., Ajouaou, Y., El-Khatib, H.,
Oldenhove, G., Leo, O., & Andris, F. (2020). Multiple environmental signaling
pathways control the differentiation of RORγt-expressing regulatory T cells. In , vol.
10. Frontiers in Immunology (p. 3007). />89/fimmu.2019.03007.
Imam, T., Park, S., Kaplan, M. H., & Olson, M. R. (2018). Effector T helper cell subsets in
inflammatory bowel diseases. Frontiers in Immunology, 9, 1212. />10.3389/fimmu.2018.01212
Ishisono, K., Mano, T., Yabe, T., & Kitaguchi, K. (2019). Dietary fiber pectin ameliorates
experimental colitis in a neutral sugar side chain-dependent manner. Frontiers in
Immunology, 10, 2979. />Ishisono, K., Yabe, T., & Kitaguchi, K. (2017). Citrus pectin attenuates endotoxin shock
via suppression of toll-like receptor signaling in Peyer’s patch myeloid cells. The
Journal of Nutritional Biochemistry, 50, 38–45.
´ Beukema, M., van den Berg, M. A., de Vos, P., & Schols, H. A. (2022).
Jermendi, E.,
Revealing methyl-esterification patterns of pectins by enzymatic fingerprinting:
Beyond the degree of blockiness. Carbohydrate Polymers, 277, 118813. https://doi.
org/10.1016/j.carbpol.2021.118813
Jiang, T., Gao, X., Wu, C., Tian, F., Lei, Q., Bi, J., Xie, B., Wang, H. Y., Chen, S., &
Wang, X. (2016). Apple-derived pectin modulates gut microbiota, improves gut
barrier function, and attenuates metabolic endotoxemia in rats with diet-induced
obesity. Nutrients, 152, s814–s815.
Josefowicz, S. Z., Lu, L.-F., & Rudensky, A. Y. (2012). Regulatory T cells: Mechanisms of
differentiation and function. Annual Review of Immunology, 30, 531–566. https://doi.
org/10.1146/annurev.immunol.25.022106.141623
Koizumi, S., & Ishikawa, H. (2019). In , 8. Transcriptional regulation of differentiation and
functions of effector T regulatory cells (p. 939).
Ladirat, S. E., Schols, H. A., Nauta, A., Schoterman, M. H. C., Schuren, F. H. J., &
Gruppen, H. (2014). In vitro fermentation of galacto-oligosaccharides and its specific
size-fractions using non-treated and amoxicillin-treated human inoculum. Bioactive
Carbohydrates and Dietary Fibre, 3, 59–70. />bcdf.2014.02.002
Lahti, L., & Shetty, S. (2017). Tools for microbiome analysis in R. Version 2.1.26.
Lamas, B., Natividad, J. M., & Sokol, H. (2018). Aryl hydrocarbon receptor and intestinal
immunity review-article. Mucosal Immunology, 11, 1024–1038. />10.1038/s41385-018-0019-2
Larsen, N., Bussolo de Souza, C., Krych, L., Barbosa Cahú, T., Wiese, M., Kot, W.,
Hansen, K. M., Blennow, A., Venema, K., & Jespersen, L. (2019). Potential of pectins
to beneficially modulate the gut microbiota depends on their structural properties.
Frontiers in Microbiology, 10(February), 1–13. />fmicb.2019.00223
Lozano-Ojalvo, D., Martínez-Blanco, M., P´
erez-Rodríguez, L., Molina, E., Pel´aez, C.,
Requena, T., & L´
opez-Fandi˜
no, R. (2019). Egg white peptide-based immunotherapy
enhances vitamin a metabolism and induces RORγt+ regulatory T cells. Journal of
Functional Foods, 52, 204–211. />Maki, K. C., & Phillips, A. K. (2015). Dietary substitutions for refined carbohydrate that
show promise for reducing risk of type 2 diabetes in men and women. The Journal of
Nutrition, 145, 159S–163S.
Makki, K., Deehan, E. C., Walter, J., & Bă
ackhed, F. (2018). The impact of dietary fiber on
gut microbiota in host health and disease. Cell Host and Microbe, 23(6), 705–715.
/>McMurdie, P. J., & Holmes, S. (2013). Phyloseq: An R package for reproducible
interactive analysis and graphics of microbiome census data. PLoS ONE, 8(4), Article
e61217. />Ohnmacht, C., Park, J. H., Cording, S., Wing, J. B., Atarashi, K., Obata, Y., GaboriauRouthiau, V., Marques, R., Dulauroy, S., Fedoseeva, M., Busslinger, M., CerfBensussan, N., Boneca, I. G., Voehringer, D., Hase, K., Honda, K., Sakaguchi, S., &
Eberl, G. (2015). The microbiota regulates type 2 immunity through RORγt+ T cells.
Science, 349, 989–993. />Oliveira, M. C., Menezes-Garcia, Z., Henriques, M. C. C., Soriani, F. M., Pinho, V.,
Faria, A. M. C., Santiago, A. F., Cara, D. C., Souza, D. G., Teixeira, M. M., &
Ferreira, A. V. M. (2013). Acute and sustained inflammation and metabolic
dysfunction induced by high refined carbohydrate-containing diet in mice. Obesity,
21, e396–e406. />Pezoldt, J., Yang, J., Zou, M., & Huehn, J. (2018). Microbiome and gut immunity: T cells.
In D. Haller (Ed.), The gut microbiome in health and disease (pp. 119–140). https://doi.
org/10.1007/978-3-319-90545-7_9
Poncheewin, W., Hermes, G. D. A., van Dam, J. C. J., Koehorst, J. J., Smidt, H., &
Schaap, P. J. (2020). NG-tax 2.0: A semantic framework for high-throughput
amplicon analysis. Frontiers in Genetics, 10. />fgene.2019.01366
Popov, S. V., Markov, P. A., Yu, G., Nikitina, I. R., Efimova, L., & Ovodov, Y. S. (2013).
Anti-inflammatory activity of low and high methoxylated citrus pectins. Biomedicine
& Preventive Nutrition, 3, 59–63.
Quast, C., Pruesse, E., Yilmaz, P., Gerken, J., Schweer, T., Yarza, P., Peplies, J., &
Glă
ockner, F. O. (2012). The SILVA ribosomal RNA gene database project: Improved
data processing and web-based tools. Nucleic Acids Research, 41(D1), D590–D596.
/>Sahasrabudhe, N. M., Beukema, M., Tian, L., Troost, B., Scholte, J., Bruininx, E.,
Bruggeman, G., van den Berg, M., Scheurink, A., Schols, H. A., Faas, M. M., & de
Vos, P. (2018). Dietary fiber pectin directly blocks toll-like receptor 2–1 and prevents
doxorubicin-induced ileitis. Frontiers in Immunology, 9, 383. />10.3389/fimmu.2018.00383
Salonen, A., Nikkilă
a, J., Jalanka-Tuovinen, J., Immonen, O., Rajili´c-Stojanovi´c, M.,
Kekkonen, R. A., Palva, A., & de Vos, W. M. (2010). Comparative analysis of fecal
DNA extraction methods with phylogenetic microarray: Effective recovery of
bacterial and archaeal DNA using mechanical cell lysis. Journal of Microbiological
Methods, 81, 127–134. />Sefik, E., Geva-Zatorsky, N., Oh, S., Konnikova, L., Zemmour, D., Manson McGuire4, A.,
Burzyn1, D., Ortiz-Lopez, A., Lobera, M., Yang, J., Ghosh, S., Earl, A., Snapper, S. B.,
Jupp, R., Kasper, D., Mathis, D., & Benoist, C. (2015). Individual intestinal symbionts
induce a distinct population of RORγ+ regulatory T cells. Science, 349(6251),
993–997.
Siracusa, F., Schaltenberg, N., Villablanca, E. J., Huber, S., & Gagliani, N. (2019). Dietary
habits and intestinal immunity: From food intake to CD4+ TH cells. In , Vol. 9.
Frontiers in immunology (p. 3177). />89/fimmu.2018.03177.
Smith, P. M., Howitt, M. R., Panikov, N., Michaud, M., Gallini, C. A., Bohlooly-Y, M.,
Glickman, J. N., & Garrett, W. S. (2013). The microbial metabolites, short-chain fatty
acids, regulate colonic T reg cell homeostasis. Science, 341, 569–573.
Song, X., Sun, X., Oh, S. F., Wu, M., Zhang, Y., Zheng, W., Geva-Zatorsky, N., Jupp, R.,
Mathis, D., Benoist, C., & Kasper, D. L. (2020). Microbial bile acid metabolites
modulate gut RORγ(+) regulatory T cell homeostasis. Nature, 577(7790), 410–415.
/>Sonnenburg, E. D., & Sonnenburg, J. L. (2014). Starving our microbial self: The
deleterious consequences of a diet deficient in microbiota-accessible carbohydrates.
Cell Metabolism, 20, 779–786. />Spahn, T. W., Weiner, H. L., Rennert, P. D., Lgering, N., Fontana, A., Domschke, W., &
Kucharzik, T. (2002). Mesenteric lymph nodes are critical for the induction of highdose oral tolerance in the absence of Peyer’s patches. European Journal of
Immunology, 32, 1109–1113. />4<1109::AID-IMMU1109>3.0.CO;2-K
Sun, Y., He, Y., Wang, F., Zhang, H., de Vos, P., & Sun, J. (2017). Low-methoxyl lemon
pectin attenuates inflammatory responses and improves intestinal barrier integrity in
caerulein-induced experimental acute pancreatitis. Molecular Nutrition & Food
Research, 61(4), Article 1600885. />Thakur, B. R., Singh, R. K., Handa, A. K., Rao, M. A., Thakur, B. R., Singh, R. K.,
Handa, A. K., Rao, M. A., Thakur, B. R., Singh, R. K., & Handa, A. K. (1997).
Chemistry and uses of pectin — A review. In , 37. Chemistry and uses of pectin — A
review (pp. 47–73).
Tian, L., Bruggeman, G., van den Berg, M., Borewicz, K., Scheurink, A. J. W., Bruininx, E.,
de Vos, P., Smidt, H., Schols, H. A., & Gruppen, H. (2016). Effects of pectin on
fermentation characteristics, carbohydrate utilization, and microbial community
composition in the gastrointestinal tract of weaning pigs. Molecular Nutrition and
Food Research. , Article 1600186. />Tian, L., Scholte, J., Borewicz, K., van den Bogert, B., Smidt, H., Scheurink, A. J. W.,
Gruppen, H., & Schols, H. A. (2016). Effects of pectin supplementation on the
fermentation patterns of different structural carbohydrates in rats. Molecular
Nutrition and Food Research, 60, 2256–2266.
Tian, L., Scholte, J., Scheurink, A. J. W., van den Berg, M., Bruggeman, G., Bruininx, E.,
de Vos, P., Schols, H. A., & Gruppen, H. (2019). Effect of oat and soybean rich in
distinct non-starch polysaccharides on fermentation, appetite regulation and fat
accumulation in rat. International Journal of Biological Macromolecules, 140, 515–521.
/>Vacca, M., Celano, G., Calabrese, F. M., Portincasa, P., Gobbetti, M., & De Angelis, M.
(2020). The controversial role of human gut lachnospiraceae. Microorganisms, 8, 573.
/>Van Itallie, T. B. (1978). Dietary fiber and obesity. American Journal of Clinical Nutrition,
31, s43–s52. />Van Wijk, F., & Cheroutre, H. (2010). Mucosal T cells in gut homeostasis and
inflammation. Expert Review of Clinical Immunology, 6(4), 559–566. />10.1586/eci.10.34
Vogt, L. M., Sahasrabudhe, N. M., Ramasamy, U., Meyer, D., Pullens, G., Faas, M. M.,
Venema, K., Schols, H. A., & de Vos, P. (2016). The impact of lemon pectin
characteristics on TLR activation and T84 intestinal epithelial cell barrier function.
Journal of Functional Foods, 22, 398–407. />Wu, C., Pan, L.-L., Niu, W., Fang, X., Liang, W., Li, J., Li, H., Pan, X., Chen, W., Zhang, H.,
Lakey, J. R. T., Agerberth, B., de Vos, P., & Sun, J. (2019). Modulation of gut
microbiota by low methoxyl pectin attenuates type 1 diabetes in non-obese diabetic
mice. Frontiers in Immunology, 10, 1733.
Yang, B. H., Hagemann, S., Mamareli, P., Lauer, U., Hoffmann, U., Beckstette, M.,
Fă
ohse, L., Prinz, I., Pezoldt, J., Suerbaum, S., Sparwasser, T., Hamann, A., Floess, S.,
Huehn, J., & Lochner, M. (2016). Foxp3+ T cells expressing RORγt represent a stable
11
M. Beukema et al.
Carbohydrate Polymers 286 (2022) 119280
regulatory T-cell effector lineage with enhanced suppressive capacity during
intestinal inflammation. Mucosal Immunology, 9, 444–457. />mi.2015.74
Ye, J., Qiu, J., Bostick, J. W., Ueda, A., Schjerven, H., Li, S., … Chen, Z.m. E. (2017). The
aryl hydrocarbon receptor preferentially marks and promotes gut regulatory T cells.
Cell Reports, 21(8), 2277–2290. />
Zhu, K., Mao, G., Wu, D., Yu, C., Cheng, H., Xiao, H., Ye, X., Linhardt, R. J., Orfila, C., &
Chen, S. (2020). Highly branched RG-I domain enrichment is indispensable for
pectin mitigating against high-fat diet-induced obesity. Journal of Agricultural and
Food Chemistry, 68, 8688–8701. />
12