Feasibility study on the use of ATR-FTIR spectroscopy as a tool for the estimation of wine polysaccharides
Bạn đang xem bản rút gọn của tài liệu. Xem và tải ngay bản đầy đủ của tài liệu tại đây (1.38 MB, 6 trang )
Carbohydrate Polymers 287 (2022) 119365
Contents lists available at ScienceDirect
Carbohydrate Polymers
journal homepage: www.elsevier.com/locate/carbpol
Feasibility study on the use of ATR-FTIR spectroscopy as a tool for the
estimation of wine polysaccharides
Berta Baca-Bocanegra a, Leticia Martínez-Lapuente b, Julio Nogales-Bueno a, *, Jos´e
´ndez-Hierro c, Rẳl Ferrer-Gallego d
Miguel Herna
a
Department of Analytical Chemistry, Facultad de Farmacia, Universidad de Sevilla, 41012 Sevilla, Spain
Institute of Vine and Wine Sciences, ICVV (University of La Rioja, Government of La Rioja and CSIC), Finca La Grajera, Logro˜
no, Spain
Food Colour and Quality Laboratory, Department of Nutrition and Food Science, Facultad de Farmacia, Universidad de Sevilla, 41012 Sevilla, Spain
d
VITEC-Centro Tecnol´
ogico del Vino, Ctra. Porrera Km.1, 43730 Falset (Tarragona), Spain
b
c
A R T I C L E I N F O
A B S T R A C T
Keywords:
ATR-FTIR
Polysaccharides
Wine
Chemometrics
GC–MS
Polysaccharides are the main macromolecules of colloidal nature in wines. These compounds play a critical role
in stabilizing other molecules in solution and thus modifying the wine processing and organoleptic properties.
Different analytical techniques have been proposed for their determination. However, most of them are
complicated and time-consuming. To overcome these drawbacks, Fourier transform infrared spectroscopy (FTIR)
has been evaluated in this study for the estimation of wine polysaccharides in a fast and non-destructive way.
Spectral data have been correlated with wine polysaccharide contents by modified partial least squares
regression (MPLS) using different spectral pretreatments. MPLS models developed have revealed the potential of
FTIR analysis for the routine screening of polysaccharides rich in arabinose and galactose (PRAG), rhamnoga
lacturonans types II (RG-II), mannoproteins (MP) and total soluble polysaccharides (TSP) in wine samples,
obtaining standard errors of prediction from 6.07 to 8.44%. Monitoring the wine polysaccharides can assist in the
elaboration of the wines according to their requirements and improving quality to satisfy consumer preferences.
1. Introduction
Wine represents a complex matrix of molecules with valuable bio
logical and organoleptic properties (Boulet et al., 2016; Quijada-Morin
et al., 2014). Among them, polysaccharides coming mainly from grapes,
but also from yeasts and bacteria during winemaking, are the main
macromolecules of colloidal nature in wines (Apolinar-Valiente et al.,
2013). Different factors such as grape variety, stage of maturity, agro
nomic treatment, or wine-making techniques affect both the profiles and
content of these compounds in grape and therefore in wine (JonesMoore et al., 2021). The main polysaccharides present in wine can be
divided into two groups according to their origin. The first of them,
originated from grape berry cell walls, comprises polysaccharides rich in
arabinose and galactose (PRAG), homogalacturonans (HG) and rham
nogalacturonans types I and II (RG-I and RG-II). The second group of
polysaccharides is given to the wine by yeast during the stages of
fermentation and aging of wines on lees (Ayestaran et al., 2004; Vidal
et al., 2003). Mannoproteins (MP) and glucans (GL) are its main
constituents. Different authors have reported in their research the varied
and interesting properties of wine polysaccharides. These compounds
have the property of being able to stabilize other molecules in solution
and therefore modify the wine processing and organoleptic properties. It
has been demonstrated that the effect on wine properties depends on the
quantity but also on the type of polysaccharide (Guadalupe et al., 2015).
Several analytical techniques have been reported for the determi
nation of wine polysaccharides (Arnous & Meyer, 2009; Ayestaran et al.,
2004; Boulet et al., 2007; Coimbra et al., 2005; Doco et al., 1999; Doco
et al., 2001; Guadalupe et al., 2012). Gas chromatography coupled with
mass spectrometry (GC–MS) after hydrolysis and monosaccharide sily
lation is reported in the bibliography as one of the most used methods
for the determination of individual wine polysaccharides. Moreover,
high performance liquid chromatography (HPLC) is widely used for the
determination of monosaccharides composition. The high sensitivity of
these techniques and their ability to adequately separate complex
samples justify the extent of its use. However, they are complicated,
demanding expensive and time-consuming techniques because of the
* Corresponding author.
E-mail addresses: (B. Baca-Bocanegra), (L. Martínez-Lapuente), (J. Nogales-Bueno), jmhhierro@us.
es (J.M. Hern´
andez-Hierro), (R. Ferrer-Gallego).
/>Received 17 January 2022; Received in revised form 2 March 2022; Accepted 14 March 2022
Available online 17 March 2022
0144-8617/© 2022 The Authors. Published by Elsevier Ltd. This is an open access article under the CC BY license ( />
B. Baca-Bocanegra et al.
Carbohydrate Polymers 287 (2022) 119365
high number of operations, equipment and reagents that they demands.
To overcome these drawbacks, analysis by FTIR has been proposed as an
important technique for a fast evaluation of wine components. FTIR is a
non-destructive technique that supplies information about the structural
features of a wide range of compounds. Its main advantages include
response speed, high degree of automation, good resolution, environ
mentally friendly and cost-effectiveness (Bokobza, 1998). These char
acteristics, together with the improvements experienced by
chemometrics, provide an interesting analytical tool for the routine
qualitative and quantitative analysis widely used in many industrial
sectors during control processes. In fact, FTIR has proven to be useful
and reliable technique in the analysis of a high diversity of samples in
different industrial sectors including the agro-food sector (Baca-Boca
negra et al., 2019; Han et al., 2019; Li et al., 2015; Lucarini et al., 2018).
In the oenological industry, FTIR analysis has been reported as a
routine procedure for the determination of classical oenological pa
rameters (Cozzolino et al., 2011), organic acids (Mato et al., 2005),
aroma precursors (Schneider et al., 2004) and phenolic compounds
(Edelmann et al., 2001; Passos et al., 2010; Silva et al., 2014) in grape
and wines. In addition, FTIR analyses have been successfully applied to
correlate the more characteristic features to phenolic extractability
levels in grapes seeds and skins (Nogales-Bueno et al., 2017a; NogalesBueno et al., 2017b).
However, although FTIR spectroscopy is widely used in the oeno
logical industry, its use for the analysis of wine polysaccharides has been
relatively scarce and mainly restricted for identification. For that matter,
Coimbra et al. (2002) described the potential of FTIR to discriminate
polysaccharides in purified white wine extracts, allowing the quantifi
cation of mannose from MP in the samples. Following the work afore
mentioned, Coimbra et al. (2005) improved the predictive ability of the
developed FTIR model for more complex matrices, such as the whole
polymeric material, and from red wine.
The objective of this study is to evaluate the use of FTIR as an
analytical technique for the estimation of major wine polysaccharides
families in a fast and non-destructive way. To the best of our knowledge,
no reference addressing this goal has yet been reported. An under
standing of the polysaccharide composition of wines is an important
issue in the oenological sector. The quality of wine depends mostly on
this aspect either for their role in wine organoleptic properties and their
impact on different stages of the winemaking process such as fermen
tation, filtration and stabilization.
2.3. Polysaccharides content
The content of the main polysaccharide families in the wine samples
was determined following the procedure previously reported by Gua
dalupe et al. (2012) and Martinez-Lapuente et al. (2013). In detail, the
monosaccharide composition was determined by GC–MS of their
trimethylsilyl-ester O-methyl glycolsyl-residues obtained after acidic
methanolysis and derivatization. GC was controlled by ChemStation
software and equipped with a 7653B automatic injector consisting of an
Agilent 7890A gas chromatograph (Agilent Technologies, Waldbronn,
Germany) coupled to a 5975C VL quadrupole mass detector (MS).
Samples were injected in duplicate. The content of each polysaccharide
family in the wine samples was estimated from their concentration of
individual glycosyl residues which are characteristic of structurally
identified wine polysaccharides. PRAGs, representing mainly
arabinogalactan-proteins and arabinans in wines, were estimated from
the sum of galactosyl, arabinosyl, rhamnosyl and glucuronosyl residues.
All the mannose content was attributed to yeast MPs, and all the glucose
content was attributed to yeast GLs. The RG-II content was calculated
from the sum of its diagnostic sugars (apiose, 2-O-methyl-l-fucose, 2-Omethyl-dxylose, aceric acid (3-c-carboxy-5-deoxy-l-xylose), Kdo (3deoxy octulosonic acid), and Dha (3-deoxy-D-lyxo heptusolaric acid)),
which represent approximately 25% of the RG-II molecule. For one
residue of 2-O-methyl fucose, RG-II contains 3.5 rhamnosyl, 2 arabino
syl, 2 galactosyl, 1 glucuronosyl and 9 galacturonosyl residues. Taking
into account these molar ratios, it was possible to estimate their
respective amounts in the RG-II. The remaining part was attributed to
the presence of PRAG in the case of rhamnose, arabinose and galactose;
and the remaining galacturonosyl residues was used to estimate the
content of oligomers of HG. The content of total polysaccharides was
estimated from the sum of PRAG, MP, GL, RG-II and HG.
2.4. Data analysis
Wine spectra were randomly divided into calibration and validation
groups by allocating, respectively, 75% and 25% of the total set of
samples.
In a first step, a principal component analysis (PCA) was used to
explore the latent structure of the spectral matrix constituted for the
samples belonging to the calibration set. This method provides infor
mation about the spectral outliers evaluating the differences between
the spectra of the different samples, the position of samples in the newlycreated space but also it is a significant source of information to generate
cross-validation groups used in the calibration process (Brereton, 2003;
Shenk & Westerhaus, 1995).
After that, a calibration procedure was carried out by modified
partial least squares regression (MPLS) to get quantitative prediction
models for the evaluated reference parameters. For it, the corresponding
GL, HG, MP, PRAG, RG-II and TSP wine content were assigned to the raw
spectral data of each sample belonging to the calibration set, and then
different spectral pre-treatments were evaluated to try to remove or
reduce scattering effects (Dhanoa et al., 1995; Geladi et al., 1985). For
each polysaccharide family, the best model was selected. Standard
normal variate (SNV), multiplicative scatter correction (MSC), detrend,
different derivatives and none pre-treatments were applied in this work.
Identification and removal of chemical outliers was carried out using the
T ≥ 2.5 criterion according to which the samples that are predicted with
a high residual value are not considered in the MPLS regression. The
standard error of cross-validation (SECV) was generated by the combi
nation of the validation errors.
Finally, the goodness of the best MPLS model obtained for each
reference parameter was evaluated. For it, the models generated in the
calibration process were applied to the samples belonging to the vali
dation set. The results obtained in this way for each evaluated parameter
were compared to the reference values obtained by gas chromatography
coupled with mass spectrometry to generate the standard error of
2. Materials and methods
2.1. Wine samples
Red wines from unknown origin, wine-making technique and grape
varieties, among others, have been used in this study. The used samples
have been analyzed in Instituto de Ciencias de la Vid y del Vino (ICVV)
for VIETEC for other confidential purposes and have been provided
using blinded codes. A total of 81 wine samples were studied. The het
erogeneity found for each polysaccharide family in terms of their con
tents justifies the usefulness of these samples for the stated objective.
2.2. FTIR data collection
FTIR spectra were recorded using a Cary 600 FTIR (Agilent Tech
nologies, Inc., USA) spectrometer with Attenuated Total Reflectance
(ATR) and the Agilent Resolutions Pro as control software. Spectral data
were registered using a zinc selenide crystal accessory in absorbance
mode from 1 mL of wine. Three spectra were recorded for each sample in
the 4000–600 cm− 1 infrared region, at 2 cm− 1 resolution and by 16
average scans. Background spectra were acquired in air and automati
cally subtracted by the software.
2
B. Baca-Bocanegra et al.
Carbohydrate Polymers 287 (2022) 119365
prediction (SEP) in external validation.
Data pretreatment, principal components analysis and MPLS models
(development and testing) were carried out using the software Win ISI®
(v1.50) (Infrasoft International, LLC, Port. Matilda, PA, USA).
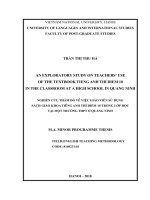
3.2. Exploratory Analysis of Spectra
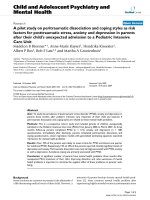
Raw average spectrum of analyzed wine in the region of 500–4000
cm− 1 is shown in Fig. 1. It can be seen that the spectrum shows high
absorbance at wavenumbers around 3400 cm− 1, 1600 cm− 1 and
1200–900 cm− 1 related to OH, carboxylate and carbohydrate respec
tively and characteristic of cell-wall polysaccharides (Coimbra et al.,
1998; Coimbra et al., 1999). The broad wavenumber region between
2900 and 3700 cm− 1 with very high absorbance intensity could be
associated with the absorbance of water. The abundant presence of
water in the wine suggests that the absorbance of the OH group will not
be very useful to develop a calibration model for polysaccharides
quantification. For this reason, only the region between 1900 and 900
cm− 1, containing information about polysaccharide features, has been
taken into account for multivariate analysis purposes (Boulet et al.,
2007).
In order to explore the structure of the calibration spectral matrix, a
SNV pretreatment was applied to the calibration spectra and, after that,
a principal component analysis was performed. A spectral variability
greater than 95% was explained using 13 principal components.
Mahalanobis distance (H) was determined for each spectrum, samples
were ordered according to their H distance with respect to the mean
spectrum of the full sample set, and the samples with H > 3 were
identified as spectral outliers and, therefore, eliminated. No samples
were identified as spectral outlier in this study and, then, the 61 samples
belonging to the calibration set were used in the calibration procedure.
3. Results and discussion
3.1. Polysaccharides contents in wine samples
In this study, RG-II, PRAG, HG, MP, GL and TSP have been evaluated
as reference parameters. The content of each wine polysaccharide family
was obtained from their concentration of individual glycosyl residues
determined by GC–MS after hydrolysis, reduction and acetylation. The
sum of all of them was estimated as total soluble polysaccharides.
Table 1 shows the main statistical parameters for RG-II, PRAG, HG, MP,
GL and TSP content of all wine samples and the samples belonging to the
validation and calibration sets.
The average content of PRAG and GL in the studied wines were
comparable, being the polysaccharides families with the highest repre
sentation in this study (mean value of 35.4% and 33.4% respectively)
followed by MP (13.2%), RG-II (12.9%) and HG (10.7%). The profile
and content of these compounds in grapes and, therefore, in wine
depend on factors like grape variety, stage of maturity, agronomic
treatment or wine-making techniques (Jones-Moore et al., 2021). So,
even though, a similar trend has been reported in the literature for the
evaluated parameters, significant differences have been found between
the polysaccharide contents in the different published studies depending
on the previously mentioned factors (Apolinar-Valiente et al., 2014;
Ayestaran et al., 2004; Doco et al., 2007; Ducasse et al., 2010; MartinezLapuente et al., 2016). The unknown origin of the wines used in this
work prevents a detailed and justified comparison of the obtained results
with those published by other authors.
Chemical variability of the calibration and validation sets was found
to be homogenous for all parameters. Taking that into account, it can be
assumed that these two new sets generated by a random sample selec
tion procedure properly represent all data variability.
3.3. MPLS regression models
Using the 1900–900 cm− 1 region of the FTIR spectra of wine sam
ples, a MPLS regression procedure were applied for the prediction of the
main families of polysaccharides (PRAG, RG-II, MP, HG and GL) and
TSP. The wine spectra belonging to the calibration set were used as in
dependent variables while reference parameters previously calculated
by CG-MS for wine samples were used as dependent variables. Table 2
shows the main statistical parameters for the obtained models. Pre
treatment applied is the best of the different treatment evaluated;
number of factors generated by the MPLS algorithm (PLS); N is the
number of samples used in the calibration analysis after eliminating
chemical outliers (T criterion); standard deviation (SD) and the appli
cability range of the models (maximum-minimum estimations) allows
defining the data that could be used for the external validation; the
multiple correlation coefficient (RSQ) evaluates how well the calibra
tion fits between spectral and chemical data and, finally, the standard
error of calibration (SEC) and standard error of cross-validation (SECV)
are estimates of the prediction capability of the model.
Good RSQ values were obtained for MP, PRAG, RG-II and TSP.
However, a poor correlation was observed between the GL and HG
content and the FTIR spectrum of the samples. This lack of fit could be
related to the strong differences that exist in these parameters for the
evaluated wines in this study, especially marked for GL (Table 1). The
MPLS models were also evaluated by means of the SECV values. This
confirmed the challenges for predicting GL and HG from their 1900–900
cm− 1 FTIR spectra and the suitability of the models for prediction of the
rest of the evaluated parameter in wine samples.
The robustness of each selected model was evaluated by means of
external validation. MPLS model obtained in the calibration step was
applied to the validation set samples and the predicted values were
compared with the values determined by GC–MS. All samples belonging
to the validation set presented Mahalanobis distances lower than 3 and
adequate reference values to be considered in the obtained models ac
cording to their applicability. Therefore, no sample was considered as
spectral outlier and all of them could be taken into account in the
external validation process. Standard error of prediction (SEP) in
external validation were calculated (Table 2). SEP, expressed as per
centages with respect to the corresponding mean reference values,
Table 1
Main statistical descriptors for reference parameters in calibration and valida
tion sets.
Set
Reference
parameter
Maximum
Mean
Minimum
SDa
All samples
RG-IIb
PRAGc
HGd
MPe
GLf
TSPg
RG-IIb
PRAGc
HGd
MPe
GLf
TSPg
RG-IIb
PRAGc
HGd
MPe
GLf
TSPg
202.28
959.06
327.29
341.16
3771.40
4465.26
202.28
959.06
327.29
341.16
3771.40
4465.26
151.64
824.32
304.42
281.93
714.20
2285.94
117.41
564.89
170.72
210.73
532.08
1595.82
118.98
568.72
171.05
211.59
560.44
1630.78
112.60
553.21
169.69
208.11
445.57
1489.18
2.49
1.74
0.98
0.84
102.36
110.44
2.49
1.74
0.98
0.84
102.36
110.44
5.15
2.90
1.39
18.16
188.21
216.22
43.12
223.48
83.75
70.74
445.87
597.45
44.57
232.19
84.98
72.95
508.42
635.65
39.01
199.61
82.02
65.23
101.52
459.43
Calibration
Validation
All reference parameters are expressed as mg L− 1 of wine.
a
SD: standard deviation.
b
RG-II: rhamnogalacturonans type II.
c
PRAG: polysaccharides rich in arabinose and galactose.
d
HG: homogalacturonans.
e
MP: mannoproteins.
f
GL: glucans.
g
TSP: total soluble polysaccharides.
3
B. Baca-Bocanegra et al.
Carbohydrate Polymers 287 (2022) 119365
Fig. 1. Raw average FTIR spectra of wine samples in the 4000–500 cm−
1
and the magnification of the 1900–900 cm−
1
region.
Table 2
Calibration statistical descriptors for the models developed in the MIR zone close to 1900–900 cm− 1.
Reference parameter
Spectral pretreatment
T outliers
PLS factors
Na
Est. min.
(mg L−
RG-IIg
PRAGh
HGi
MPj
GLk
TSPl
None 2,5,5,1
SNV 1,5,5,1
Standard MSC 2,5,5,1
Detrend 0,0,1,1
Standard MSC 2,5,5,1
None 2,5,5,1
0
3
0
0
4
4
3
2
3
1
1
2
61
58
61
61
57
57
0
0
0
0
112.25
53.80
1
SDb
Est. max.
SECc
RSQd
wine)
44.57
224.35
84.98
72.95
119.13
497.57
SECVe
(mg L−
252.69
1224.25
426.00
430.44
827.02
3039.19
19.23
56.88
51.47
7.36
92.30
237.10
0.91
0.94
0.63
0.99
0.40
0.77
22.46
75.01
56.88
33.45
105.23
247.53
SEPf
1
SEP (%)
wine)
15.33
78.67
54.61
36.33
89.06
188.54
6.07
6.43
12.81
8.44
11.55
6.25
a
N: number of samples (calibration set).
SD: standard deviation.
c
SEC: standard error of calibration.
d
RSQ: coefficient of determination (calibration set).
e
SECV: standard error of cross-validation (7 cross-validation groups).
f
SEP: standard error of prediction (external validation).
g
RG-II: rhamnogalacturonans types II.
h
PRAG: polysaccharides rich in arabinose and galactose.
i
HG: homogalacturonans.
j
MP: mannoproteins.
k
GL glucans.
l
TSP: total soluble polysaccharides.
b
ranged from 6.07 to 12.81% being the most promising values those
obtained for MP, PRAG, TSP and RG-II in decreasing order. Therefore,
results obtained for RSQ, SECV and SEP parameters indicate that FTIR
spectroscopy possess a great potential for a fast and reasonably inex
pensive monitoring of MP, PRAG, RG-II and TSP in wine samples.
Coimbra et al. (2002) reported a regression procedure using FTIR
spectra for the estimation of the mannose content in purified ethanol
polysaccharide fractions from white wines with a good predictive abil
ity. In a later study, Coimbra et al. (2005), improved and successfully
extended the previous model to less purified samples from white wines
and from red wine (polymeric material and ethanol fractions). However,
the studies focused on the estimation of polysaccharides content are very
scarce.
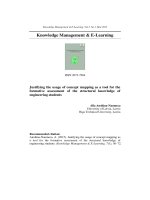
Fig. 2 displays the loadings of the MPLS model that led to charac
terizing the most important wavenumber regarding the prediction of
PRAG, RG-II, MP and TSP. Two, three, one and two PLS factors were
respectively needed to obtain a predictive ability. The spectral region
between 1200 and 900 cm− 1, where the C-O-C and C-O-H link band
positions are found, showed the most important contribution to all
model loadings. The position and intensity of the bands in the 1900–900
cm− 1 region are characteristics of each purified polysaccharide (Boulet
et al., 2007). However, in wine samples it is not easy to assign the
specific wavenumber to specific polysaccharides due to underlying
spectral bands and vibrational coupling from the high diversity of
polysaccharides chemical bonds (Liu et al., 2021). According to the
study carried out by Boulet et al. (2007) in purified polysaccharides, the
three polysaccharides families have a characteristic peak around 1045
cm− 1 with different shoulders at 980, 1130 and 1070 cm− 1 depending
on the family. In aqueous solutions, Kacurakova et al. (2000) described
bands at 1070 and 1043 cm− 1 for rhamnogalacturonan, 1072 cm− 1 for
galactan, and 1039 cm− 1 for arabinan. Two well-defined mannoprotein
peaks at 980 cm− 1 and 1100–1150 cm− 1 are also described in this work.
The discrimination of these compounds could be compromised by their
complicated chemical structure and the proximity of their peaks. The
1900–1200 cm− 1 region is mainly related to minority compounds pre
sent in polysaccharides, proteins and uronic acids. The spectrum of
proteins is characterized by three bands of different intensity around
1650, 1550 and 1400 cm− 1, while uronic acids present three absorbance
peaks around 1750, 1620 and 1420 cm− 1 characteristic of carboxylic
acid functional group (Boulet et al., 2007; Manrique & Lajolo, 2002).
RG-II are rich in uronic acids while PRAG and MP possess proteins in
their composition (Vidal et al., 2003). The presence of these compounds
in the three polysaccharides families is directly related to the impor
tance of this region of the spectrum for the correct prediction of their
content in wine samples. The high ratio mannose/protein in man
noproteins justifies the relevance of the region of the spectrum related to
carbohydrates for the mannoprotein estimation.
4. Conclusions
In this study, FTIR spectroscopy has been evaluated as a technique
for the estimation of major wine polysaccharides families. MPLS models
4
B. Baca-Bocanegra et al.
Carbohydrate Polymers 287 (2022) 119365
Fig. 2. Loadings plots of the MPLS models for polysaccharides rich in arabinose and galactose (PRAG), rhamnogalacturonans types II (RG-II), mannoproteins (MP)
and total soluble polysaccharides (TSP).
Abbreviations
developed have revealed the potential of the FTIR analysis in the 1900
and 900 cm− 1 region as a tool for the daily screening of PRAG, RG-II, MP
and TSP in wine samples based on spectral features. Different spectral
pretreatments and MPLS calibrations were tested in order to obtain
quantitative models for these reference parameters obtaining standard
errors of prediction between 6.07 and 8.44%. Moreover, spectral regions
with high importance in the adequate estimation of each of these pa
rameters have been identified. GC–MS after hydrolysis and mono
saccharide silylation is the most common technique for the
polysaccharides determination. However, this analytical procedure re
quires a great number of operations, equipment and reagents. Taking
that into account, the MPLS models developed in this work acquire
greater importance. Fast, non-pollutant, non-destructive and costeffectiveness are properties of FTIR analysis that accentuate its value
allowing, especially its speed response, a high versatility and efficiency
for the decision-making in the oenological sector. Monitoring the poly
saccharides composition of wines in the different stages of the wine
making process is a very important matter in the oenological industry,
since it can assist in adapting the wines according to the requirements of
the wine and improving quality to satisfy the consumer preferences.
However, more wine samples from different grape varieties, regions,
agronomic treatment or wine-making techniques need to be collected in
order to obtain more reliable and robust methods especially for those
families of polysaccharides that have not been adequately predicted in
this work.
PRAG
RG-I
RG-II
MP
GL
HG
TSP
FTIR
ATR
GC–MS
PCA
MPLS
RSQ
SECV
SEP
SNV
MSC
Polysaccharides rich in arabinose and galactose
Rhamnogalacturonans types I
Rhamnogalacturonans types II
Mannoproteins
Glucans
Homogalacturonans
Total soluble polysaccharides
Fourier transform infrared spectroscopy
Attenuated total reflectance
Gas chromatography coupled with mass spectrometry
Principal component analysis
Modified partial least squares regression
Coefficient of determination
Standard error of cross validation
Standard error of prediction
Standard normal variate
Multiplicative scatter correction
CRediT authorship contribution statement
Berta Baca-Bocanegra: Data curation, Writing – original draft.
Martínez-Lapuente Leticia: Methodology. Julio Nogales-Bueno:
´ Miguel Herna
´ndez-Hierro: Writing –
Writing – review & editing. Jose
review & editing, Supervision. Raúl Ferrer-Gallego: Conceptualization,
Supervision.
5
B. Baca-Bocanegra et al.
Carbohydrate Polymers 287 (2022) 119365
Declaration of competing interest
Doco, T., Williams, P., & Cheynier, V. (2007). Effect of flash release and pectinolytic
enzyme treatments on wine polysaccharide composition. Journal of Agricultural and
Food Chemistry, 55(16), 6643–6649.
Ducasse, M.-A., Canal-Llauberes, R.-M., de Lumley, M., Williams, P., Souquet, J.-M.,
Fulcrand, H., & Cheynier, V. (2010). Effect of macerating enzyme treatment on the
polyphenol and polysaccharide composition of red wines. Food Chemistry, 118(2),
369–376.
Edelmann, A., Diewok, J., Schuster, K. C., & Lendl, B. (2001). Rapid method for the
discrimination of red wine cultivars based on mid-infrared spectroscopy of phenolic
wine extracts. Journal of Agricultural and Food Chemistry, 49(3), 1139–1145.
Geladi, P., Macdougall, D., & Martens, H. (1985). Linearization and scatter-correction for
near-infrared reflectance spectra of meat. Applied Spectroscopy, 39(3), 491–500.
Guadalupe, Z., Ayestar´
an, B., Williams, P., & Doco, T. (2015). Determination of must and
wine polysaccharides by gas chromatography-mass spectrometry (GC-MS) and sizeexclusion chromatography (SEC). Springer.
´ Carrillo, J. D., & Ayestar´
Guadalupe, Z., Martínez-Pinilla, O., Garrido, A.,
an, B. (2012).
Quantitative determination of wine polysaccharides by gas chromatography–mass
spectrometry (GC–MS) and size exclusion chromatography (SEC). Food Chemistry,
131(1), 367–374.
Han, Y., Wang, X., Liu, Y., Han, L., Yang, Z., & Liu, X. (2019). A novel FTIR
discrimination based on genomic DNA for species-specific analysis of meat and bone
meal. Food Chemistry, 294, 526–532.
Jones-Moore, H. R., Jelley, R. E., Marangon, M., & Fedrizzi, B. (2021). The
polysaccharides of winemaking: From grape to wine. Trends in Food Science &
Technology, 111, 731–740.
Kacurakova, M., Capek, P., Sasinkova, V., Wellner, N., & Ebringerova, A. (2000). FT-IR
study of plant cell wall model compounds: Pectic polysaccharides and
hemicelluloses. Carbohydrate Polymers, 43(2), 195–203.
Li, B., Wang, H., Zhao, Q., Ouyang, J., & Wu, Y. (2015). Rapid detection of authenticity
and adulteration of walnut oil by FTIR and fluorescence spectroscopy: A comparative
study. Food Chemistry, 181, 25–30.
Liu, X., Renard, C. M. G. C., Bureau, S., & Le Bourvellec, C. (2021). Revisiting the
contribution of ATR-FTIR spectroscopy to characterize plant cell wall
polysaccharides. Carbohydrate Polymers, 262.
Lucarini, M., Durazzo, A., Sanchez del Pulgar, J., Gabrielli, P., & Lombardi-Boccia, G.
(2018). Determination of fatty acid content in meat and meat products: The FTIRATR approach. Food Chemistry, 267, 223–230.
Manrique, G. D., & Lajolo, F. M. (2002). FT-IR spectroscopy as a tool for measuring
degree of methyl esterification in pectins isolated from ripening papaya fruit.
Postharvest Biology and Technology, 25, 99–107.
Martinez-Lapuente, L., Apolinar-Valiente, R., Guadalupe, Z., Ayestaran, B., PerezMagarino, S., Williams, P., & Doco, T. (2016). Influence of grape maturity on
complex carbohydrate composition of red sparkling wines. Journal of Agricultural and
Food Chemistry, 64(24), 5020–5030.
Martinez-Lapuente, L., Guadalupe, Z., Ayestaran, B., Ortega-Heras, M., & PerezMagari˜
no, S. (2013). Changes in polysaccharide composition during sparkling wine
making and aging. Journal of Agricultural and Food Chemistry, 61(50), 12362–12373.
Mato, I., Suarez-Luque, S., & Huidobro, J. F. (2005). A review of the analytical methods
to determine organic acids in grape juices and wines. Food Research International, 38
(10), 1175–1188.
Nogales-Bueno, J., Baca-Bocanegra, B., Rooney, A., Hernandez-Hierro, J. M.,
Byrne, H. J., & Heredia, F. J. (2017a). Study of phenolic extractability in grape seeds
by means of ATR-FTIR and raman spectroscopy. Food Chemistry, 232, 602–609.
Nogales-Bueno, J., Baca-Bocanegra, B., Rooney, A., Hernandez-Hierro, J. M., Jose
Heredia, F., & Byrne, H. J. (2017b). Linking ATR-FTIR and raman features to
phenolic extractability and other attributes in grape skin. Talanta, 167, 44–50.
Passos, C. P., Cardoso, S. M., Barros, A. S., Silva, C. M., & Coimbra, M. A. (2010).
Application of fourier transform infrared spectroscopy and orthogonal projections to
latent structures/partial least squares regression for estimation of procyanidins
average degree of polymerisation. Analytica Chimica Acta, 661(2), 143–149.
Quijada-Morin, N., Williams, P., Rivas-Gonzalo, J. C., Doco, T., & Escribano-Bailon, M. T.
(2014). Polyphenolic, polysaccharide and oligosaccharide composition of
tempranillo red wines and their relationship with the perceived astringency. Food
Chemistry, 154, 44–51.
Schneider, R., Charrier, F., Moutounet, M., & Baumes, R. (2004). Rapid analysis of grape
aroma glycoconjugates using fourier-transform infrared spectrometry and
chemometric techniques. Analytica Chimica Acta, 513(1), 91–96.
Shenk, J. S., & Westerhaus, M. O. (1995). Routine operation, calibration, development and
network system management manual. Silver Spring, Maryland: NIRSystems.
Silva, S. D., Feliciano, R. P., Boas, L. V., & Bronze, M. R. (2014). Application of FTIR-ATR
to moscatel dessert wines for prediction of total phenolic and flavonoid contents and
antioxidant capacity. Food Chemistry, 150, 489–493.
Vidal, S., Williams, P., Doco, T., Moutounet, M., & Pellerin, P. (2003). The
polysaccharides of red wine: Total fractionation and characterization. Carbohydrate
Polymers, 54(4), 439–447.
None.
Acknowledgments
Funding
This work was supported by Spanish Ministerio de Economía y
Competitividad [grant number AGL2017-84793-C2] and by Junta de
Andalucía [grant number PAIDI-DOCTOR:DOC_00906].
Appendix A. Supplementary data
Supplementary data to this article can be found online at https://doi.
org/10.1016/j.carbpol.2022.119365.
References
Apolinar-Valiente, R., Romero-Cascales, I., Williams, P., Gomez-Plaza, E., LopezRoca, J. M., Ros-Garcia, J. M., & Doco, T. (2014). Effect of winemaking techniques
on polysaccharide composition of cabernet sauvignon, syrah and monastrell red
wines. Australian Journal of Grape and Wine Research, 20(1), 62–71.
Apolinar-Valiente, R., Williams, P., Romero-Cascales, I., G´
omez-Plaza, E., L´
opezRoca, J. M., Ros-García, J. M., & Doco, T. (2013). Polysaccharide composition of
monastrell red wines from four different spanish terroirs: Effect of wine-making
techniques. Journal of Agricultural and Food Chemistry, 61(10), 2538–2547.
Arnous, A., & Meyer, A. S. (2009). Quantitative prediction of Cell Wall polysaccharide
composition in grape (Vitis vinifera L.) and apple (Malus domestica) skins from acid
hydrolysis monosaccharide profiles. Journal of Agricultural and Food Chemistry, 57(9),
3611–3619.
Ayestaran, B., Guadalupe, Z., & Leon, D. (2004). Quantification of major grape
polysaccharides (Tempranillo v.) released by maceration enzymes during the
fermentation process. Analytica Chimica Acta, 513(1), 29–39.
Baca-Bocanegra, B., Nogales-Bueno, J., Gorey, B., Jose Heredia, F., Byrne, H. J., & Miguel
Hernandez-Hierro, J. (2019). On the use of vibrational spectroscopy and scanning
electron microscopy to study phenolic extractability of cooperage byproducts in
wine. European Food Research and Technology, 245(10), 2209–2220.
Bokobza, L. (1998). Near infrared spectroscopy. Journal of Near Infrared Spectroscopy, 6
(1), 3–17.
Boulet, J. C., Trarieux, C., Souquet, J.-M., Ducasse, M.-A., Caille, S., Samson, A., &
Cheynier, V. (2016). Models based on ultraviolet spectroscopy, polyphenols,
oligosaccharides and polysaccharides for prediction of wine astringency. Food
Chemistry, 190, 357–363.
Boulet, J. C., Williams, P., & Doco, T. (2007). A fourier transform infrared spectroscopy
study of wine polysaccharides. Carbohydrate Polymers, 69(1), 79–85.
Brereton, R. G. (2003). Chemometrics: Data analysis for the laboratory and chemical plant.
Chichester, West Sussex, England: J. Wiley.
Coimbra, M. A., Barros, A., Barros, M., Rutledge, D. N., & Delgadillo, I. (1998).
Multivariate analysis of uronic acid and neutral sugars in whole pectic samples by
FT-IR spectroscopy. Carbohydrate Polymers, 37(3), 241–248.
Coimbra, M. A., Barros, A., Rutledge, D. N., & Delgadillo, I. (1999). FTIR spectroscopy as
a tool for the analysis of olive pulp cell-wall polysaccharide extracts. Carbohydrate
Research, 317(1–4), 145–154.
Coimbra, M. A., Barros, A. S., Coelho, E., Goncalves, F., Rocha, S. M., & Delgadillo, I.
(2005). Quantification of polymeric mannose in wine extracts by FT-IR spectroscopy
and OSC-PLS1 regression. Carbohydrate Polymers, 61(4), 434440.
Coimbra, M. A., Gonỗalves, F., Barros, A. S., & Delgadillo, I. (2002). Fourier transform
infrared spectroscopy and chemometric analysis of white wine polysaccharide
extracts. Journal of Agricultural and Food Chemistry, 50(12), 3405–3411.
Cozzolino, D., Cynkar, W., Shah, N., & Smith, P. (2011). Feasibility study on the use of
attenuated total reflectance mid-infrared for analysis of compositional parameters in
wine. Food Research International, 44(1), 181–186.
Dhanoa, M. S., Lister, S. J., & Barnes, R. J. (1995). On the scales associated with nearinfrared reflectance difference spectra. Applied Spectroscopy, 49(6), 765–772.
Doco, T., O’Neill, M. A., & Pellerin, P. (2001). Determination of the neutral and acidic
glycosyl-residue compositions of plant polysaccharides by GC-EI-MS analysis of the
trimethylsilyl methyl glycoside derivatives. Carbohydrate Polymers, 46(3), 249–259.
Doco, T., Quellec, N., Moutounet, M., & Pellerin, P. (1999). Polysaccharide patterns
during the aging of Carignan noir red wines. American Journal of Enology and
Viticulture, 50(1), 25–32.
6