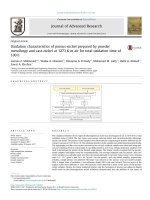
Chitosan characteristics in electrolyte solutions: Combined molecular dynamics modeling and slender body hydrodynamics
Bạn đang xem bản rút gọn của tài liệu. Xem và tải ngay bản đầy đủ của tài liệu tại đây (2.01 MB, 13 trang )
Carbohydrate Polymers 292 (2022) 119676
Contents lists available at ScienceDirect
Carbohydrate Polymers
journal homepage: www.elsevier.com/locate/carbpol
Chitosan characteristics in electrolyte solutions: Combined molecular
dynamics modeling and slender body hydrodynamics
´ ski b, c, Aneta Michna b, *, Monika Wasilewska b,
Dawid Lupa a, Wojciech Płazin
d
Paweł Pomastowski , Adrian Gołębiowski d, e, Bogusław Buszewski d, e, Zbigniew Adamczyk b
a
M. Smoluchowski Institute of Physics, Jagiellonian University, Łojasiewicza 11, 30-348 Krak´
ow, Poland
Jerzy Haber Institute of Catalysis and Surface Chemistry, Polish Academy of Sciences, Niezapominajek 8, PL-30239 Krakow, Poland
Department of Biopharmacy, Medical University of Lublin, ul. Chod´zki 4A, 20-093 Lublin, Poland
d
Centre for Modern Interdisciplinary Technologies, Nicolaus Copernicus University, Wilenska 4, 87-100 Torun, Poland
e
Department of Environmental Chemistry and Bioanalytics, Faculty of Chemistry, Nicolaus Copernicus University, Gagarin 7, 87-100 Torun, Poland
b
c
A R T I C L E I N F O
A B S T R A C T
Keywords:
Chitosan molecule conformations
Chitosan molecule charge
Hydrodynamic diameter
Molecular dynamics modeling
Intrinsic viscosity
Zeta potential
Molecular dynamics modeling was applied to predict chitosan molecule conformations, the contour length, the
gyration radius, the effective cross-section and the density in electrolyte solutions. Using various experimental
techniques the diffusion coefficient, the hydrodynamic diameter and the electrophoretic mobility of molecules
were determined. This allowed to calculate the zeta potential, the electrokinetic charge and the effective ioni
zation degree of the chitosan molecule as a function of pH and the temperature. The chitosan solution density
and zero shear dynamic viscosity were also measured, which enabled to determine the intrinsic viscosity
increment. The experimental results were quantitatively interpreted in terms of the slender body hydrodynamics
exploiting molecule characteristics derived from the modeling. It is also confirmed that this approach can be
successfully used for a proper interpretation of previous literature data obtained under various physicochemical
conditions.
1. Introduction
Chitosan is a linear polysaccharide derived from naturally occurring
chitin – the second most abundant biopolymer (Kaczmarek et al., 2019)
– by its partial deacetylation in enzymatic or base-catalyzed processes. A
backbone of chitosan molecule is composed of randomly distributed Dglucosamine (2-amino-2-deoxy-β-D-glucopyranose, deacetylated unit,
GlcNH2) and N-acetyl-D-glucosamine (2-acetamido-2-deoxy-β-D-gluco
pyranose, acetylated unit, GlcNAc) linked with β-(1 → 4) bonds, as
shown in Fig. 1. Depending on the chitin source and deacetylation
process conditions, the molar mass of chitosan varies from 65 to 25,000
kDa (Errington et al., 1993; Morris et al., 2009; Wang et al., 1991).
Among chitosan applications, especially in the biomedical and food
context, a tendency to form hydrogel seems to be the most important.
Chitosan hydrogels are effective in the targeted adsorption of dyes and
proteins from aqueous solutions as was reported by Boardman et al.
(2017). Furthermore, chitosan itself has also a high impact on the
gelatinization, gel formation, and retrogradation of maize starch as was
proved by Raguzzoni et al. (2016).
Because of its biocompatibility, biodegradability and low toxicity,
chitosan-based materials have been thoroughly investigated as a
component of chitosan-casein hydrophobic peptides nanoparticles, used
as soft Pickering emulsifiers (Meng et al., 2022), for application as
antimicrobial agents (Chien et al., 2016), in 3D printing of biocompat
ible scaffolds (Rajabi et al., 2021; Suo et al., 2021) in wound healing
(Bano et al., 2019); (Patrulea et al., 2015), in cosmetics and food
products as stabilizers (Saha & Bhattacharya, 2010), (Harding et al.,
2017), rheology modifier (thickener), in household and commercial
products (Pini et al., 2020; Wardy et al., 2014), for producing macroion
films in the layer-by-layer processes at various substrates, comprising
targeted drug delivery systems based on nanoparticle cores. Chitosan
and its derivatives have also gained much attention due to their unusual
properties allowing for adsorption and then effective removal of
different types of dyes and heavy metal ions (Wan Ngah et al., 2011;
* Corresponding author.
E-mail addresses: (D. Lupa), (W. Płazi´
nski), (A. Michna), monika.wasilewska@ikifp.
edu.pl (M. Wasilewska), (P. Pomastowski), (A. Gołębiowski),
(B. Buszewski), (Z. Adamczyk).
/>Received 19 March 2022; Received in revised form 11 May 2022; Accepted 27 May 2022
Available online 30 May 2022
0144-8617/© 2022 The Authors. Published by Elsevier Ltd. This is an open access article under the CC BY license ( />
D. Lupa et al.
Carbohydrate Polymers 292 (2022) 119676
Vakili et al., 2014).
The properties of chitosan solutions were widely studied with the
aim to evaluate its molar mass distribution (Hasegawa et al., 1994); the
ălfen et al., 2001); (Weinhold &
radius of gyration and contour length (Co
ăming, 2011), persistence lengths (Berth & Dautzenberg, 2002;
Tho
Morris et al., 2009), the hydrodynamic diameters and the second virial
coefficients (Anthonsen et al., 1993; Berth & Dautzenberg, 2002;
Errington et al., 1993). Furthermore, it was found that the physico
chemical properties of solutions can be modified by controlled chitosan
dispersion in various organic acids (Soares et al., 2019).
A plethora of works was devoted to investigations of rheological
properties of chitosan solutions, especially the intrinsic viscosity [η]
under various physicochemical conditions. An analysis of the available
experimental data is presented in Fig. S1 in Supporting Information.
Many attempts were undertaken in the literature to rationalize these
results characterized by a considerable scatter in terms of the empirical
Mark-Houwink (MH) relationship connecting the intrinsic viscosity [η]
with the molar mass, Mp
[η] = KMpa
transform infrared spectroscopy (FTIR), the dynamic light scattering
(DLS), micro-electrophoresis (LDV), matrix-assisted laser desorption/
ionization coupled to time of flight mass spectrometry (MALDI-TOF/
TOF MS), asymmetric flow field-flow fractionation coupled with multiangle light scattering (AF4-RI-MALS), the optical waveguide lightmode
spectroscopy (OWLS) and the zero shear rate dynamic viscosity mea
surements. As a result, a quantitative information about the physico
chemical properties of chitosan molecule such as the chain
conformations and length, effective ionization degree and the number of
uncompensated charges as a function of pH and the temperature was
acquired.
2. Materials and methods
2.1. Materials
Chitosan sample (lot no. 448869) was supplied by Sigma-Aldrich
(Poland) in the form of powder. The molar mass (determined by the
viscosity method) given by the producer lies in the range of 50 to 190 kg
mol− 1 (kDa) with an average value of 120 kg mol− 1. Detailed charac
terization of obtained chitosan sample is given in Supporting
Information.
NaOH and HCl were analytical grade products of Avantor Perfor
mance Materials Poland S.A. All reagents were used as received. Pure
water of resistivity 18.2 MΩ was obtained using Milli-Q Elix & Simplicity
185 purification system from Millipore SAS Molsheim, France.
(1)
where Mp is expressed in Da, K (usually expressed in dL g − 1) and a
(dimensionless) are empirical constants depending on various parame
ters, primarily on ionic strength and electrolyte composition, pH, the
acetylation degree, the temperature, the molar mass range, the stability
of the chitosan solutions, aggregation degree etc. A significant scatter of
the fitting parameters was reported in the literature, with K varying
between 3 × 10− 7 to 1.115 × 10− 2 dL g − 1 and a ranging between 0.147
and 1.26 (Kasaai, 2007) or even 1.37 for ionic strength of 0.005 M
(Anthonsen et al., 1993). This hinders a proper theoretical interpretation
of experimental data and limits the precision of the MH equation often
used for a facile molar mass determination, especially of commercial
chitosan samples. The parameters of the MH equation reported for
different parameters are collected in Fig. S2.
It should also be mentioned that the experimental intrinsic viscosity
having the dimension of dL g− 1 depends on the density of macroion
molecules ρp. This prohibits its proper physical interpretation in terms of
hydrodynamic models, which postulate that the viscosity of dispersion is
independent of the particulate matter density. As discussed in recent
works (Adamczyk et al., 2018); (Michna et al., 2021), instead of [η], the
intrinsic viscosity increment υexp = ρp[η] (Morris et al., 2009) is the
parameter prone to a sound physical interpretation. However, the
calculation of υexp requires the macroion molecule density to be simul
taneously determined with the viscosity measurements. Unfortunately,
such a procedure was not used in the literature except for the work of
Errington et al. (1993).
Therefore, to increase understanding of chitosan molecule behav
iour, a more quantitative approach was applied in this work, founded on
the combination of molecular dynamics (MD) modeling with low Rey
nolds number hydrodynamics. Performed calculations furnished various
parameters prone to experimental measurements such as the molecule
diffusion coefficient, gyration radius and the intrinsic viscosity incre
ment. The obtained theoretical results were used for the interpretation
of experimental data acquired using various techniques such as Fourier
2.2. Methods
The solutions of chitosan were prepared by dissolving a proper
amount of the powder in 0.01 M HCl. When necessary, the pH of solution
was increased using a proper volume of 1 M NaOH by keeping ionic
strength at a constant level.
Elemental composition of the chitosan sample, especially the C/N
atomic ratio was determined using Thermo Scientific FlashSmart
Elemental Analyzer. Additionally, the presence of characteristic moi
eties and DA value were evaluated using FTIR (FTIR Nicolet 6700
spectrometer, Thermo Scientific). FTIR spectrum was acquired using the
classical KBr pellet method.
The molar mass of chitosan was acquired by AF4-RI-MALS and
MALDI-TOF/TOF MS analysis.
The distribution of molar mass and radius of gyration was also
determined using Postnova AF2000 MultiFlow system (Postnova Ana
lytics GmbH, Landsberg am Lech, Germany). 10 kDa membrane made
out of regenerated cellulose and 350 μm spacer were used in this study.
A RI detector PN3150 (Postnova Analytics GmbH, Landsberg am
Lech, Germany) was applied for determining particle concentration.
MALS detector PN3621 (Postnova Analytics GmbH, Landsberg am
Lech, Germany) collected data at angles from 12◦ to 164◦ ; the temper
ature of the detector cell was set to 35 ◦ C with 80% laser (λ = 532 nm)
power. As a carrier liquid, the 0.01 M HCl solution was used (Merck
KGaA, Darmstadt, Germany) filtered through a 0.1 μm nylon membrane
(Merck Millipore, Warsaw, Poland). The injection volume was 100 μL.
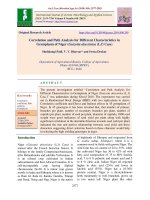
Fig. 1. A schematic representation of the chemical structure of the chitosan molecule with the functionalization motif used in the MD simulations. The acetylation
degree (DA) is 40%. The IUPAC-recommended numbering of some atoms and definition of glycosidic dihedral angles are given as well.
2
D. Lupa et al.
Carbohydrate Polymers 292 (2022) 119676
All fractionation analyses were performed at room temperature.
´lez-Espinosa
The fractionation method was adopted from (Gonza
et al., 2019) with some modifications. The detector flow was 0.5 mL
min− 1. The injection and focusing steps of fractionation consist of 0.2
mL min− 1 injection, 3.3 mL min− 1 focusing and 3.0 mL min− 1 crossflows through 6 min and then 0.2 min of transition to the elution step.
The elution is based on an exponential (0.4) decrease in cross flow to
0.06 mL min− 1value. The constant flows were kept to elute all fractions.
Evaluation of the data was performed using AF2000 Control software
using the Zimm function. Chitosan sample was prepared with a con
centration of 2000 mg L− 1 in 0.01 M HCl, which was dissolved by mixing
for at least 2 h. According to (Czechowska-Biskup et al., 2007) dη/dc
value for chitosan in HCl solution is 0.146 mL g− 1.
A MALDI-TOF/TOF MS instrument equipped with a modified
neodymium-doped yttrium aluminium garnet (Nd: YAG) laser (1-kHz
Smartbeam-II, Bruker Daltonik) operating at the wavelength of 355 nm
was used for all measurements. All spectra were acquired in linear
positive mode using an acceleration voltage of 25 kV within a m/z range
of 30,000 to 500,000 at 50% of laser power and a global attenuator of
30%. All mass spectra were acquired and processed using dedicated
software, flexControl and flexAnalysis, respectively (both from Bruker
Daltonik).
For MALDI-TOF/TOF MS analysis, chitosan solution was prepared in
0.01 M HCl and 0.1% TFA in water. The analysis was performed using
three different matrices – HCCA, DHB and SA. Equal amounts of satu
rated HCCA solution in TA30 and sample were applied to the plate and
allowed to dry. The same protocol was used for DHB (20 mg ml− 1 in
TA30). In contrast, a double layer protocol was used for SA. A saturated
solution of SA in EtOH was applied to the plate and allowed to dry. The
sample solution and saturated SA in TA30 were then applied to the first
layer.
The high-resolution mass spectra of chitosan determined by MALDITOF/TOF MS as well as a molar mass distribution, and radius of gyration
determined by AF4-RI-MALS were presented in Figs. S6–S8 and
Table S3.
The diffusion coefficient and the electrophoretic mobility of chitosan
molecules for various pHs were determined using DLS and LDV,
respectively. Both DLS and LDV experiments were performed using
Malvern Zetasizer Nano ZS apparatus. Chitosan concentration was kept
at 100 and 300 mg L− 1 in the case of the diffusion coefficient and the
electrophoretic mobility determination, respectively. The Ohshima
(2012) and Einstein (1908) equations were applied to calculate the zeta
potentials and the hydrodynamic diameters of chitosan using the elec
trophoretic mobility and the diffusion coefficient data.
Additionally, the hydrodynamic diameter of chitosan molecules was
determined at a low concentration range (typically 5 mg L− 1 inacces
sible to DLS) using the method based on adsorption kinetics measure
ments in a microfluidic flow cell (for details consult Fig. S12).
Accordingly, the chitosan molecule adsorption was measured using the
optical wave-guide spectroscopy (OWLS) according to the procedure
previously described in Refs. Wasilewska et al. (2019) and Michna et al.
(2020). The OWLS 210 instrument (Microvacuum Ltd., Budapest,
Hungary) was used. The apparatus is equipped with a laminar slit shear
flow cell comprising a silica-coated waveguide (OW2400, Micro
vacuum). The adsorbing substrates were planar optical waveguides
made of a glass substrate (refractive index 1.526) covered by a film of
Si0.78Ti0.22O2 (thickness 170 nm, refractive index 1.8). A grating
embossed in the substrate enables the light to be coupled into the
waveguide layer. The sensor surface was coated with an additional layer
(10 nm) of pure SiO2 according to the previous protocol (Wasilewska
et al., 2019). The adsorption kinetic measurements yielded the mass
transfer rate of chitosan molecules, which was converted to the diffusion
coefficient and in consequence to the hydrodynamic diameter using the
Stokes-Einstein relationship (Eqs. S9–S13 in Supporting Information).
The density of chitosan solutions of defined mass fraction (wp) was
determined using the Anton Paar DMA 5000 M densitometer. This
apparatus was coupled with the Anton Paar rolling-ball viscometer Lovis
2000 M/ME equipped with a short capillary tube, which allowed
simultaneous determination of the dynamic viscosity of solutions with a
large precision (0.05%) using relatively small volumes of chitosan so
lutions (0.1 mL). The zero-shear dynamic viscosity was calculated by
extrapolation of dynamic viscosity determined at different shear rates
(capillary tilt angles). A description of measurement principles can be
found elsewhere (Michna et al., 2021). The measurements were carried
out for chitosan mass fractions below 10− 3 (dilute macroion concen
tration limit) and at a fixed ionic strength 0.01 M.
All experiments were performed in triplicates.
2.3. Molecular dynamics modeling
A series of chitosan chains of various lengths, composed of 5, 10, 20
and 40 monosaccharide residues (referred to later on as monomers) was
considered in the molecular dynamics simulations. The acetylation de
gree DA of 40% was reflected by the composition of the chains, which
contain the periodically repeating motif of functionalization: -GlcNH+
3+
GlcNH+
3 -GlcNAc-GlcNH3 -GlcNAc-, see Fig. 1.
The initial configurations of the systems, including the chain solva
tion as well as the addition of co-ions were created using the CHARMMGUI online server (Park et al., 2019). The systems of interest consisted of
cubic boxes of the initial edge dimensions varying from 4.9 to 21.6 nm,
depending on the system. The number of water molecules included in
simulation boxes varied from 3800 to 322,500, respectively. The
appropriate number of Na+ and Cl− ions was added to each system,
accounting for its neutral charge and the desired ionic strength value
(0.01 M).
The all-atom molecular dynamics (MD) modeling were carried out
within the GROMACS 2016.4 package (Abraham et al., 2015). The
CHARMM36 force field (Guvench et al., 2011) was used to describe the
interactions involving chitosan molecules, accompanied by the
CHARMM-compatible explicit TIP3P water model (Jorgensen et al.,
1998). According to the assumed pH conditions, all amine groups in the
chitosan chain were assumed to be protonated and bear a formal posi
tive charge. The parameters describing the protonated amine moieties
were prepared manually and relied on the parameters generated by the
ligand builder module of the CHARMM-GUI server.
The modeling was carried out applying periodic boundary conditions
and in the isothermal-isobaric ensemble. The temperature was main
tained close to its reference value (298 K) by applying the V-rescale
thermostat (Bussi et al., 2007), whereas for the constant pressure (1 bar,
isotropic coordinate scaling) the Parrinello-Rahman barostat (Parrinello
& Rahman, 1981) was used with a relaxation time of 0.4 ps. The
equations of motion were integrated with a time step of 2 fs using the
leap-frog scheme (Hockney, 1970). The hydrogen-containing solute
bond lengths were constrained by the application of the LINCS proced
ure with a relative geometric tolerance of 10− 4 (Hess, 2008). The full
rigidity of the water molecules was enforced by the application of the
SETTLE procedure (Miyamoto & Kollman, 1992). The electrostatic in
teractions were modeled by using the particle-mesh Ewald method
(Darden et al., 1998) with a cut-off set to 1.2 nm, while van der Waals
interactions (LJ potentials) were switched off between 1.0 and 1.2 nm.
The translational center-of-mass motion was removed every timestep
separately for the solute and the solvent.
The systems were subjected to geometry minimization and MD-based
equilibrations in the NPT ensemble, lasting 5–20 ns, depending on the
system size. After equilibration, production simulations were carried out
for a duration of 100–130 ns and the data were saved to trajectory every
2 ps. The end-to-end, persistence length and gyration radius values were
calculated by using the GROMACS routines gmx polystat and gmx mindist.
The anomeric carbon atoms were selected to define the polymer back
bone in the case of the longest chain and calculations aimed at persis
tence length.
The final frames of the equilibration trajectory of the system
3
D. Lupa et al.
Carbohydrate Polymers 292 (2022) 119676
containing decameric chains of chitosan were used to initiate enhancedsampling free energy calculations carried out according to the protocol
described below. The calculation of the 2D free energy maps (FEMs)
relied on an enhanced-sampling scheme combining parallel tempering
(Earl & Deem, 2005) and well-tempered metadynamics (Barducci et al.,
2008) as implemented in the PLUMED 2.3 plug-in (Tribello et al., 2014).
The well-tempered metadynamics simulations involved a 2D space of
collective variables defined by the values of the ϕ and ψ glycosidic
dihedral angles. They were defined by the following quadruplets of
atoms: ϕ = O5-C1-O1-C′ 4, ψ = C1-O1-C′ 4-C′ 3. The parameters of meta
dynamics were set as follows: initial height of bias portion: 0.1 kJ/mol,
bias portion width: 0.314 rad, deposition rate: 0.5 kJ/mol/ps, bias factor
(dependent on the ΔT parameter in Eq. (2), ref. (Barducci et al., 2008)):
10. The parallel-tempering relied on 16 metadynamics simulations
carried out in parallel at different temperatures ranging from 298.0 to
363.2 K in steps of about 4.3 K, along with replica-exchange attempts
performed at 2 ps intervals. All metadynamics simulations were carried
out for 10 ns.
3. Results and discussion
3.1. Theoretical modeling results
As mentioned, the calculations were performed for chitosan chains
composed of 5, 10, 20 and 40 monomers characterized by the average
molar mass 0.179 kg mol− 1. The results of this MD modeling enabled to
determine the molecule conformation, the time-averaged gyration
radius, the end-to-end distance and the extended (contour) length as a
function of the degree of polymerization, denoted by DP. The derivative
parameters such as the persistence length, the extended chain diameter
and the molecule density were also theoretically predicted.
Exemplary snapshots of chitosan chain conformations obtained for
NaCl concentration of 0.01 M and different polymerization degree are
shown in Fig. 2. Qualitatively, one can observe that the chains contain
quasi-rigid fragments, but also some kinks, corresponding to reoriented
glycosidic linkages. This type of conformation can be traced back to the
flexibility of the individual glycosidic linkages between mono
saccharides composing the chain, as studied by the additional, meta
dynamics simulations.
The resulting free energy maps (FEMs, Fig. 3) calculated with respect
to the glycosidic dihedral angle values show that the general landscape
is roughly independent of the monosaccharide functionalization, i.e. the
Fig. 2. Snapshots of chitosan chain conformations for systems composed of 10, 20 and 40 residues, derived from MD modeling. Solvent molecules are omitted for
clarity, 0.01 M NaCl.
4
D. Lupa et al.
Carbohydrate Polymers 292 (2022) 119676
Fig. 3. The free energy maps calculated by metadynamics modeling and illustrating the inherent flexibility of glycosidic linkages between various monosaccharide
+
residues within the chitosan chain: (A) GlcNH+
3 -GlcNAc linkage; (B) GlcNAc-GlcNH3 linkage; (C) GlcNAc-GlcNAc linkage. ϕ and ψ denote glycosidic dihedral angles,
defined according to the IUPAC notation. Energy scale is in [kJ/mol].
location of either the global or local minima on FEM remains unaltered
by the substitution of the neighbouring residues. Moreover, the FEM
area corresponding to the low (< 5 kJ/mol) free energy levels covers
only a narrow fraction of the map, which indicates preferences for a
relatively rigid conformation of a given linkage. However, the energy
level corresponding to the secondary free energy minima on FEM
calculated for the GlcNH+
3 - GlcNAc linkage is located close to the zerolevel of energy which indicates enhanced flexibility of such linkage,
compared to the remaining ones (levels of ca. -7.5 kJ/mol vs. ca. -12 kJ/
mol). This corresponds to the population of the alternative chain ge
ometries ca. 5%. Apart from that, an additional, tertiary minimum at the
relatively low level of ca. -9 kJ/mol can be observed. Considering the
large abundance of this type of linkages and the possible contribution of
the remaining linkage types, one has to assume the non-negligible in
fluence of the non-standard conformers of the residue-residue linkage on
the overall chain geometry.
The intramolecular hydrogen bonding included mainly interactions
between the O5 ring oxygen atoms and –OH groups of the two consec
utive monosaccharide residues. However, the quantitative occurrences
of intramolecular hydrogen bonding per 1 residue are low (0.52 per
timeframe), indicating the limited intensity of such interaction types and
preferred interactions with water molecules instead (6.48 solute-solvent
hydrogen bonds per 1 residue). Apart from the conformationallyrestricted mutual orientation of the neighbouring residues, no ten
dency to the formation of regular, helical shapes within a larger
dimensional scale was observed.
The MD modeling also allowed to quantitatively determine the timeaveraged gyration radius Rg and the average end-to-end distance of the
molecule Lete (for 0.01 M HCl) as a function of DP. These dependencies
are illustrated in Fig. 4. One can observe that these parameters can be
well fitted by following linear dependencies
Rg = 0.227 + 0.119DP
interpolated by the dependence.
Lete max = 0.083 + 0.454DP
where: Lete max is expressed in [nm].
The latter dependence allowed to determine the residue contour
length, which was 0.460 nm (see Table 1). Additionally, the persistence
length determined during MD simulations and based on the ‘backbone’
defined by anomeric carbon atoms is 5.0 nm. For comparison, the
experimental values reported in the literature vary between 4.5 (Schatz
et al., 2003) and 7.6 nm (Lamarque et al., 2005).
The density of the chitosan molecule was calculated using the pre
viously applied method (Adamczyk et al., 2018). Accordingly, the size of
the simulation boxes, where a single chitosan molecule was confined,
was systematically increased, resulting in the decrease in the chitosan
mass fraction from 0.02 to 0. The density of these systems ρs, as well as
that of the pure solvent ρe, were determined in additional MD runs.
Then, the dependence of ρe/ρs on wp was plotted and fitted by a straight
line characterized by the slope sp and the density was calculated from
the formula:
ρp =
ρe
1 + sp
(5)
Dependences of the relative densities of the chitosan solutions on the
mass fraction determined by two complementary approaches: molecular
dynamics (MD) modeling and densitometry were presented in Fig. S4,
Fig. S5 and Table S2, respectively.
It was determined that, at the temperature of 298 K (0.01 M HCl), the
density of the bare chitosan chain (no hydration) was 1.82 × 10³ kg m− 3.
This value can be rescaled upon assumption that each residue in a chain
is accompanied by either water molecule(s) (chain hydration) or coun
terions (ion condensation occurring in the case of charged residues). For
instance, the density for the hydrated chain is 1.49 × 10³ kg m− 3
(Table 1). For comparison, the experimental value reported by Errington
et al. (Errington et al., 1993) for DA = 58% in 0.2 M NaCl was 1.72 ×
103 kg m− 3. It should be mentioned that molecule density is the indis
pensable parameter for a proper hydrodynamic interpretation of the
experimentally derived intrinsic viscosity.
Using the densities of 1.82 × 10³ kg m− 3 and 1.49 × 10³ kg m− 3 one
can calculate the average volume of a monomer from the dependence ν1
= M1/(ρpNA) which was 0.163 and 0.200 nm3 for the cases of bare
chitosan chain and hydration accompanying one water molecule per
residue, respectively (Table 1). Consequently, assuming its cylindrical
shape and considering that its molar mass is 0.179 kg mol− 1, the
equivalent monomer diameter calculated as d1 = (4ν1/πlm)1/2 was 0.672
and 0.744 nm, respectively.
Similar values of the extended chain diameter 0.662 and 0.733 nm,
for no hydration and hydration with one H2O molecule per monomer,
respectively, were obtained from direct MD modeling. For this purpose,
(2)
where: Rg is expressed in [nm]
Lete = 0.681 + 0.336DP
(4)
(3)
where: Lete is expressed in [nm].
Assuming that DP is equal to zero, Eqs. (2) and (3) will provide nonphysical results. As the data used to obtain the best-fit parameters were
generated for chains of a minimal length of 5 residues, the extrapolation
below this value, where end-effects may play a more substantial role, is
associated with larger errors of predictions, leading ultimately to nonzero Rg and Lete for DP = 0. In spite of that, the relative magnitude of
such errors is rather small when referring to the absolute values of both
quantities determined for longer chains.
On the other hand, the maximum end-to-end distance, which can be
interpreted as the contour length of the fully extended molecule was
5
D. Lupa et al.
Carbohydrate Polymers 292 (2022) 119676
Table 1
Primary physicochemical characteristics of the chitosan molecule derived from
MD modeling, 0.01 M HCl, 40% periodic acetylation (DA).
Quantity [unit], symbol
Value
Remarks
Monomer molar mass
[kg mol− 1], M1
Extended monomer
contour length [nm],
lm
0.179
Average value for protonated amine
groups
This work, MD modeling, fully extended
chain
DA = 0.05, (Korchagina & Philippova,
2010)
DA = 0.40, (Lamarque et al., 2005)
This work, MD modeling
DA = 0.40 (Lamarque et al., 2005)
(Schatz et al., 2003)
(Rinaudo et al., 1993)
This work, MD modeling, no hydration
Persistence length [nm],
Lp
Molecule density [kg
m− 3], ρp
0.460 ±
0.02
0.515
0.49
5.0
7.6
4.5
5
1.82 ±
0.10 × 10³
1.49 ±
0.10 × 10³
1.35 ±
0.10 × 10³
Monomer volume [nm3],
ν1
Monomer equivalent
cylinder diameter
[nm], dc
Extended chain diameter
[nm], dex
Chain diameter [nm]
1.72 × 10³
0.163
0.200
0.221
0.672 ±
0.03
0.744 ±
0.03
0.781 ±
0.03
0.662 ±
0.03
0.733 ±
0.03
0.769 ±
0.03
0.731 ±
0.03
0.809 ±
0.03
0.849 ±
0.03
This work, MD modeling, hydration of 1
water molecule
per protonated monomer
This work, MD modeling, with
condensation of one Cl− ion per one
protonated monomer
DA = 0.58, Errington et al. (1993)
This work, no hydration, calculated as ν1
= M1/(ρpAv)
This work, hydration
Ion condensation
This work, no hydration, calculated as dc
= (4ν1/πlm)
This work, hydration
This work, ion condensation
No hydration, calculated from contour
length
This work, hydration
Ion condensation
No hydration, calculated from the
average end-to-end Distance value
for 0.01 M HCl
Hydration, 0.01 M HCl
Ion condensation, 0.01 M HCl
The agreement is even better when using the corresponding value
relying only on the MD simulations of the shortest chain (0.474 nm)
which is the most extensively sampled, providing probably the most
accurate maximal extended chain value. Minor differences between
theoretical predictions and the experimental data are expected due to
the following factors: (i) deviations in the system composition with
respect to the real systems (this includes both the necessary restrictions
in the system size and the uncertain pattern of acetylation which does
not necessarily correspond to the periodic one assumed in our MD
simulations); (ii) sampling-inherent inaccuracies. The latter issue con
cerns mainly the persistence length as it cannot be determined using the
enhanced-sampling metadynamics technique and is possible to be esti
mated only for sufficiently long chains (it was possible only for the
longest chain in the case of presently studied systems) and, at the same
time, is slowly converging variable. The presently estimated value of 5.0
nm is close to the lower limit of experimentally-inferred values, to the
MD-relying value of 5 nm by Singhal et al. (Singhal et al., 2020) and
persistence lengths calculated by Tsereteli and Grafmüller using the
coarse-grained model and varying in the range of 6–9 nm (Tsereteli &
Grafmüller, 2017). The latter work is also in line with our finding stating
that the GlcNH+
3 -GlcNAc linkage is the most flexible one.
One should expect that the extrapolation of these results to a larger
molar mass of chitosan furnishes useful data inaccessible for direct
theoretical modeling because of excessive time of computations.
Fig. 4. (A) The average gyration radius (Rg) calculated from the results of MD
modeling vs. the degree of polymerization (DP) (B) The average end-to-end
length (Lete) vs. DP (C) The maximal values of the end-to-end length (Lete max)
vs. DP. The solid line denotes the linear fitting of theoretical data. Vertical bars
in panels (A) and (B) denote the fluctuations of the given quantity found during
MD modeling and expressed as standard deviation values.
the density-dependent monomer volume was multiplied by the numbers
of mers in the individual chain and related to the monomer length
determined for the shortest chain. These data correspond to a negligible
ionic strength limit.
On the other hand, for the ionic strength of 0.01 M, the chain
diameter was 0.731 and 0.809 nm, for no hydration and hydration,
respectively.
The theoretically-determined extended monomer contour length
(0.460 nm) agrees reasonably well with the experimental values of 0.49
(Lamarque et al., 2005) and 0.515 nm (Korchagina & Philippova, 2010).
6
D. Lupa et al.
Carbohydrate Polymers 292 (2022) 119676
However, it is to remember that this only concerns chitosan samples of
low dispersity.
where: k is the Boltzmann constant, T is the absolute temperature, η is
the dynamic viscosity of the electrolyte and D is the diffusion coefficient
of the molecule derived from DLS.
It is revealed that there were two main fractions were present in the
chitosan sample: the first one characterized by the hydrodynamic
diameter of 19 ± 2 nm (number averaged) and the other exhibiting dH =
40 ± 5 nm (also number averaged). Interestingly, the former value was
fairly independent of pH and the storage time up to 72 h, which is
illustrated in Fig. 5.
It is also observed that the hydrodynamic diameter at pH 2 (for the
primary peak) decreased from 20 to 15 nm upon an increase of the
temperature from 293 to 323 K (Fig. S10 part B).
It is interesting to compare the chitosan molecule hydrodynamic
diameter derived from DLS with the diameter of an equivalent sphere ds
calculated as:
3.2. Experimental characteristics of chitosan
Dry mass of chitosan powder was determined using classic ther
mogravimetry. The detailed protocol for these measurements can be
found in Section 2.1 in Supporting Information. Such experiments
showed that the water content in the chitosan sample was 8%.
Elemental composition of the chitosan sample, especially the C/N
atomic ratio was determined using elemental analysis. Additionally, the
presence of characteristic moieties and DA value were evaluated using
Fourier transform infrared spectroscopy (FTIR).
It was 37% ± 3 and 39% ± 2, respectively. It was assumed that the
distribution of the -NH2 groups was quasi-periodic, as in theoretical
modeling (see Fig. 1).
The calculation of DA, a spectrum of the chitosan sample and the
most significant peaks visible in the spectrum, as well as their assign
ment to respective vibrations, were collected in Fig. S3 and Table S1,
respectively.
The chitosan molecule density for various temperatures was deter
mined by the dilution method according to the procedure described
previously (Adamczyk et al., 2018). The primary results shown in Fig. S5
enabled to calculate the density from Eq. (5) using the slope of ρe/ρs vs.
the mass fraction of chitosan in the solution, wp analogously as for the
theoretical modeling. In this way, one obtained 1.5 ± 0.2 × 10³ and 1.55
± 0.02 × 10³ kg m− 3 for the temperature of 298 K and 308 K, respec
tively. It is noteworthy here that the value of ρs determined at 298 K
agrees with the result derived from MD modeling.
On the other hand, the molar mass of the chitosan sample deter
mined by AF4-RI-MALS and MALDI-TOF/TOF MS was 412 and 346 kg
mol− 1 (kDa), respectively. These values differ significantly from the
molar mass given by the producer, 50 to 190 kg mol − 1 (average value
120 kg mol− 1), as determined by a viscosity method. However, such
discrepancy is common for chitosan samples, where the molar mass
derived for osmotic pressure measurements and MALS may differ in
some cases by a factor up to 4.6 (Anthonsen et al., 1993). This is mainly
attributed to the sample aggregation during the measurements. As
shown in Ref. (Korchagina & Philippova, 2010) for the chitosan sample
with Mp = 125 kDa, approx. 10% of chitosan chains are forming
spherical aggregates characterized by an aggregation number of ca. 10.
Therefore, in this work except for the dynamic viscosity measure
ments, a few complementary methods were applied to derive informa
tion about the chitosan and conformations of its molecule in electrolyte
solutions. Primarily, the dynamic light scattering (DLS) measurements
were carried out yielding the diffusion coefficient of molecules from the
light intensity autocorrelation function. The advantage of DLS method,
compared to the static light scattering (MALS) is that no column sepa
ration of the sample is needed and that the signal is independent of the
molecule shape. Additionally, macroion samples characterized by sig
nificant dispersity can be analyzed at a relatively low concentration
range.
Extensive measurements discussed in Supporting Information
enabled to determine the chitosan molecule diffusion coefficient as a
function of pH varied between 2 and 6, for a fixed ionic strength of 0.01
M NaCl (see Fig. S9). Also, the dependence of the diffusion coefficient on
the storage time was measured for various pHs in order to determine the
chitosan solution stability. Finally, the dependence of the diffusion co
efficient on the temperature, which varied between 293 and 323 K, was
experimentally determined (see Fig. S10 part A). These data were con
verted to the molecule hydrodynamic diameter dH using the StokesEinstein relationship (Einstein, 1908)
dH =
kT
3πηD
(
ds =
6Mp
πρp NA
)1/3
(7)
For Mp = 50 kDa one obtains from Eq. (7) ds = 4.7 nm. For Mp = 120
kDa (average value given by the producer), one obtains ds = 6.3 nm.
These values are significantly smaller than the DLS hydrodynamic
diameter. This indicates that at an ionic strength of 0.01 M the chitosan
molecule assumes a largely elongated shape, analogously as previously
observed for other macroions (Adamczyk et al., 2018); (Michna et al.,
2021). Therefore, it is reasonable to theoretically interpret the DLS re
sults using the slender body hydrodynamics pertinent to the case where
the length to width ratio (aspect ratio) of a molecule denoted by λ
considerably exceeds unity (Brenner, 1974). For such a case the hy
drodynamic diameter can be expressed in the following form (Mansfield
& Douglas, 2008); (Adamczyk et al., 2012):
dH =
Lc
λ
= dc
c1 ln2λ + c2
c1 ln2λ + c2
(8)
where Lc is the contour length of the molecule, c1, c2 are the dimen
sionless constants depending on the shape of the body and dc is the
molecule chain diameter.
For prolate spheroids one has c1 = 1, c2 = 0; for blunt cylinders: c1 =
1, c2 = − 0.11; (Brenner, 1974) for linear chain of touching beads:c1 = 1,
c2 = 0.25 and for a chain of beads forming a torus one has: c1 = 11/12,
Fig. 5. The dependence of the hydrodynamic diameter of the chitosan molecule
(first fraction) on pH and the storage time, I = 0.01 M; T = 298 K; bulk solution
concentration 100 mg L− 1. The dashed line denotes the average value of dH =
19 ± 2 nm.
(6)
7
D. Lupa et al.
Carbohydrate Polymers 292 (2022) 119676
c2 = 0.67 (Adamczyk et al., 2006). Replacing the string of touching
beads by a flexible cylinder of the same volume and length one obtains
c1 = 1, c2 = − 0.45 (linear chain) and c1 = 11/12, c2 = 0.48 (torus)
(Adamczyk et al., 2006).
The Lc parameter appearing in Eq. (8) can be calculated as lmMp/M1
using the monomer contour length lm given in Table 1. For the extended
chain (this corresponds to a low ionic strength limit) one has lm = 0.460
nm, whereas for the 0.01 M ionic strength one has lm = 0.378 nm. Using
also the chain diameter of 0.733 nm (Table 1) one can calculate that for
the molar mass of 50 kDa, where Lc = Lex = 280 nm, the hydrodynamic
diameter predicted from Eq.(8) is 21.9, 22.3 and 21.9 nm for spheroid,
cylinder and torus, respectively. Analogously, for I = 0.01 M, where Lc =
105 nm and the chain diameter is 0.809 nm one obtains dH = 18.6, 18.9
and 18.6 nm for spheroid, cylinder and torus. As can be seen, these
values little depend on the molecule shape and agree within the error
bound with the experimental value (DLS) 19 nm.
For the average molar mass of 120 kDa, Lex = 308 nm, and dH = 45.7,
46.5 and 46.3 nm for the spheroid, cylinder and torus, respectively, in
the low ionic strength limit. Analogously, for 0.01 M ionic strength one
obtains dH = 39.2, 39.8 and 39.5 nm for the spheroid, cylinder and torus.
Again, these values agree with the experimental hydrodynamic diameter
derived from DLS (40 nm) for the second chitosan fraction. It is also
worth mentioning that in Ref. (Korchagina & Philippova, 2010) a similar
value of the hydrodynamic diameter 36 ± 4 nm was reported for an
unaggregated chitosan sample having the molar mass of 125 kDa and
DA = 5%.
Interestingly, for the straight cylinder conformation, the gyration
radius becomes independent of the chitosan molecule diameter and can
be calculated from the formula (Adamczyk et al., 2021)
Rg =
Lc
121/2
Fig. 6. The dependence of the electrophoretic mobility and the number of
elementary charges per one chitosan molecule on pH. Measurement conditions:
I = 0.01 M; T = 298 K; bulk solution concentration 300 mg L− 1. The solid line
denotes the logistic fit of experimental results.
molecule can be calculated as
Nc = qe/e, where e is the elementary charge 1.602 × 10− 19 C.
Eq. (10) is valid for an arbitrary charge distribution and the shape of
molecules. However, its accuracy decreases for larger ionic strengths
where the double-layer thickness κ− 1 = (εkT/2e2I)1/2 (where ε is the
electric permittivity of the solvent) becomes comparable with the
molecule diameter.
Using the experimental hydrodynamic diameter of 19 nm (for the
molecule molar mass of 50 kDa) and the electrophoretic mobility data
one obtains Nc = 50, 33 and 9 at pH 2, 5.6 and 7.3, respectively. The
dependence of Nc on pH is graphically shown in Fig. 6. Analogously, for
the average molar mass of 120 kDa where the hydrodynamic diameter is
40 nm one obtains Nc = 105, 69 and 19 at pH 2, 5.6 and 7.3, respec
tively. Considering that DP was 280 and 670 (for 50 and 120 kDa,
respectively) and DA = 40% one can calculate that the electrokinetic
charge at pH 2 amounts to 0.32 to 0.26 of the nominal charge (158 e and
402 e for 50 and 120 kDa, respectively). These results indicate that the
molecule charge stemming from the protonated –NH2 groups is signifi
cantly compensated by counterion accumulation in the diffuse part of
the electric double-layer. This effect is well-known as the Manning ion
condensation (Manning, 1979). It is also interesting to mention that such
behaviour was previously reported for PDADMAC (Adamczyk et al.,
2014), and PLL (Adamczyk et al., 2018) macroions.
Except for the electrokinetic charge, the electrophoretic mobility
data allow to calculate the zeta potential, an important parameter
controlling macromolecule interactions among themselves, i.e., their
solution stability, and their interactions with interfaces, i.e., the
adsorption kinetics and isotherms. The dependence of the chitosan
molecule zeta potential on pH calculated from the electrophoretic
mobility using the general Ohshima model is plotted in Fig. 7. The
electrophoretic mobility, the zeta potential and the number of electro
kinetic charges of the chitosan molecule at various pHs were presented
in Table S4.
Furthermore, the dependences of zeta potential and the electroki
netic charge of the chitosan molecule on the temperature at pH = 2 for I
= 0.01 M HCl were determined. The obtained results can be found in
Fig. S11 and Table S5.
(9)
Thus, for the molar mass of 50 kDa one can calculate from Eq. (9)
that the gyration radius is 37 and 30.3 nm, in the limit of low ionic
strength and for 0.01 M, respectively. Analogously, for the molar mass of
120 kDa, the gyration radius is 88.9 and 72.7 nm for these two cases,
respectively.
Independently, the hydrodynamic diameter of chitosan molecules
was determined as described above using OWLS, which yielded repro
ducible results for the low solution concentration of 5 mg L− 1 where the
interaction among chitosan molecules become negligible. Primarily, in
these experiments, the adsorption kinetics of chitosan expressed as the
mass coverage vs. the time dependence was determined under regulated
flow rate (see Fig. S12). The hydrodynamic diameter obtained in this
way at 0.01 M ionic strength was 38 ± 2 nm, which agrees with the
theoretical data predicted for the average molar mass of the chitosan
sample.
The hydrodynamic diameter data acquired above from DLS and
OWLS can also be used to determine the electrokinetic charge of chi
tosan molecules, an essential parameter, which has not been before
determined in the literature. This additionally requires the electropho
retic mobility of molecules μe (this parameter is the ratio of the molecule
migration velocity to the applied electric field) which can be directly
measured by the LDV method as described above. The dependence of μe
on pH acquired at 0.01 M ionic strength and the temperature of 298 K is
shown in Fig. 6. As can be noticed, the mobility attains a maximum value
of 5.1 μm cm(Vs)− 1 at pH 2 and monotonically decreases to zero at pH
ca. 8.5.
Using the experimental electrophoretic mobility μe and the hydro
dynamic diameter one can determine the electrokinetic charge at the
chitosan molecule by applying the Lorentz–Stokes relationship
(Adamczyk et al., 2006); (Michna et al., 2017):
qe = 3πηdH μe =
kT
μ
D e
4. Viscosity measurements
(10)
Thorough characteristics of chitosan solutions were also acquired
applying the viscosity method, widely used in the literature to determine
Consequently, the number of elementary charges Nc per one
8
D. Lupa et al.
Carbohydrate Polymers 292 (2022) 119676
other ionic strength were less reproducible because of the instability of
chitosan solutions. To be more precise, due to the lower solubility of
chitosan in less concentrated solutions of HCl, the range of Φv presented
in Fig. 8 is inaccessible under HCl concentration lower than 6 × 10− 3 M,
as determined experimentally. Additionally, the direct dilution of
freshly prepared chitosan solution in 0.01 M HCl was applied to prepare
chitosan solution of lower ionic strength. Unfortunately, this approach
resulted in precipitation of chitosan. To the best of our knowledge, there
is no available literature data concerning the dynamic viscosity of chi
tosan solutions characterized by ionic strength lower than 0.01 M.
The slopes of these dependencies give directly the experimental
values of the intrinsic viscosity increment νexp (a dimensionless
parameter) defined as
νexp = [η]ρp
(11)
where [η] is the usually defined intrinsic viscosity expressed as dL g− 1,
therefore, having the dimension of a specific volume.
It is determined that νexp was practically independent of pH for the
range 2–4 (see Fig. 8) assuming an average value of 1150 ± 50. This
value is slightly lower for pH 5, attaining a value of 1070 ± 30. How
ever, at pH 6, νexp markedly decreased assuming 860 ± 40 for the NaCl
concentration of 0.01. Such large values of the viscosity increment,
compared to the Einstein value of 2.5 pertinent to spherical (random
coil) molecule conformation, unequivocally indicate that the chitosan
molecule assumes largely extended conformation. This agrees with the
above prediction derived from DLS and OWLS measurements.
The influence of the temperature on the viscosity increment at pH 2
and I = 0.01 M was also studied. The results shown in Fig. S14 and
Table S6 confirmed that the increment decreased from 1150 ± 50 to 710
± 30 for 293 and 323 K.
These viscosity increment data were interpreted in terms of theo
retical results derived in Ref. (Brenner, 1974) within the framework of
low Reynolds number hydrodynamics. In this work, the intrinsic vis
cosity increment was analytically calculated for prolate spheroids
characterized by the elongation parameter λ up to 50. A broad range of
the Peclet (Pe) number defining the significance of the hydrodynamic
shear rate to the rotary diffusion coefficient of molecules was consid
ered. In the limit of zero Pe number (corresponding to negligible shear
rate) the exact numerical results obtained for λ ≫ 1 were interpolated by
the following analytical expression
Fig. 7. Dependence of the zeta potential of the chitosan molecule on pH.
Measurements conditions: I = 0.01 M; T = 298 K; bulk solution concentration
300 mg L− 1. The solid line denotes the logistic fit of experimental data.
the molar mass via the Mark-Houvink equation and other derivative
parameters such as the chain conformation, persistence length, chain
ăming,
stiffness, etc. (Kasaai, 2007; Morris et al., 2009; Weinhold & Tho
2011) Primarily, in the measurements, the zero shear rate dynamic
viscosity of dilute chitosan solution denoted as ηs was measured for
various pHs and temperatures at a fixed ionic strength of 0.01 M. These
primary results were expressed as the dependence of the normalized
viscosity ηs/ηe (where ηe is the supporting electrolyte viscosity) on the
chitosan volume fraction Φv = cb/ρp rather than on the mass fraction as
usually done in the literature.
Such dependencies of the normalized viscosity, ηs/ηe on the volume
fraction Φv for various pHs, the temperature 298 K and I = 0.01 M are
presented in Fig. 8. The dependencies of normalized viscosity on the
volume fraction for various temperatures, at pH 2 are presented in
Fig. S13.
It should be mentioned that dynamic viscosity measurements for
ν = c1ν
λ2
λ2
+ c2ν
+ cν
ln2λ − 0.5
ln2λ − 1.5
(12)
where c1v = 3/15, c2v = 1/15 and cv is 8/5 for spheroids and 14/15 for
blunt cylinders (Harding, 1995).
The precision of Eq. (12) is ca. 1% for λ = 10 and 0.2% for λ above
100.
However, one should underline that Eq. (12) is strictly valid for rigid
bodies having regular shape such as prolate spheroids or cylinders of
arbitrary cross-section area. No exact theoretical results were reported
in the literature for flexible, worm-like, molecule shapes. However,
there exist results for cyclic molecule chains approximated by strings of
touching beads, either freely jointed or forming Gaussian rings, with a
quasi-toroidal geometry (Bernal et al., 2002). The obtained results were
expressed as the ratio of the intrinsic viscosity increment of the linear to
the cyclic chains having the same number of beads, denoted as qη. For
the number of beads exceeding 20 (this corresponds to the λ parameter
in the slender body nomenclature), it is shown that qη was 0.60 ± 0.2.
This result confirms that the increment of a flexible molecule bent to a
form of a torus (a circle in the limit of large elongations) amounts to 60%
of the molecule forming a fully expanded conformation. Therefore, it is
reasonable to assume that any intermediate conformation such as
example a semi-circle will produce even a smaller, about 20% change in
the viscosity increments. By virtue of these results, one can calculate the
limiting viscosity increment for a flexible molecule in the toroidal
Fig. 8. Dependence of the normalized viscosity ηs/ηe on the volume fraction Φv
of chitosan solutions at various pHs, I = 0.01 M, T = 298 K. The lines represent
linear interpolation of the experimental data.
9
D. Lupa et al.
Carbohydrate Polymers 292 (2022) 119676
conformation by multiplying the viscosity derived from Eq. (12) by the
factor qη. Theoretical results calculated in this way are given in Table 2
and compared with the experimental value determined in this work for
0.01 M ionic strength. As can be seen, the experimental value of 1150 ±
50 agrees with the theoretically predicted 1090, which was calculated
for a straight molecule conformation and the molar mass of 50 kDa,
whereas the toroidal conformation yields νc = 660, i.e., significantly
smaller. In contrast, for the average molar mass of 120 kDa, the theo
retical values of the viscosity increment for the straight and toroidal
conformation are 4590 and 2760, respectively, which significantly ex
ceeds the experimental value. A plausible explanation of this discrep
ancy is the uncertainty in the molar mass determination, mainly caused
by the presence of aggregates exhibiting significantly larger molar mass
than the average value. As shown by Anthonsen et al. (Anthonsen et al.,
1993) and Korchagina & Philippova (Korchagina & Philippova, 2010)
such aggregates exhibit a compact molecule shape rather than largely
elongated, pertinent to monomer molecules. As a result, although they
shift the average molar mass to large values, they little contribute to the
intrinsic viscosity. In order to test this hypothesis, some literature data
acquired for well-defined experimental conditions are theoretically
analyzed in terms of the hydrodynamic model using the molecule di
mensions derived from this work from the MD modeling.
Errington et al. (Errington et al., 1993) carried out measurements for
chitosan samples of various origins characterized by molar mass deter
mined by the sedimentation equilibrium varying between 4.3 and 64
kDa and the acetylation degree of 58%. The ionic strength of the solution
was 0.2 M and pH was 4.3. In contrast to other works, the density of the
chitosan sample 1.72 g cm− 3 was determined by the dilution method.
The viscosity increment results shown in Table 2 indicate that an almost
quantitative agreement with theoretical predictions is observed for the
28.9 and 64 kDa samples. However, for the low molar mass samples of
8.8 and 4.3 kDa, the experimental intrinsic viscosity increments were
significantly larger than those predicted for a fully extended chain. This
unusual behaviour can be attributed to the large uncertainty in the
molar mass determination by the sedimentation equilibrium for low
molar mass samples.
Anthonsen et al. (1993), performed systematic viscosity measure
ments for chitosan samples characterized by the molar mass (deter
mined by osmotic pressure) varying between 15 and 310 kDa and
acetylation degrees 60, 15 and 0%, respectively. Additionally, the in
fluence of ionic strength changed between 1 and 0.013 M (at pH 5) was
determined. In Table 2, the results obtained for DA = 15% and 0.013 M
extrapolated to 0.01 M ionic strength are compared with the theoretical
predictions derived from our model assuming ρp = 1.72 g cm− 3 that
corresponds to the experimental value determined by Errington et al.
(1993). Considering the possible experimental error, a satisfactory
Table 2
Theoretical (derived from the slender body approach) and experimental values of the intrinsic viscosity increments of chitosan molecules in aqueous electrolyte
solutions.
Mp
[kDa]
DP
[1]
Lext
Rg
[nm]
λext
[1]
L01
Rg
[nm]
λ01
[1]
νext
ν01
50
280
128
37.0
175
105
30.3
141
1610
1090
660
120
670
420
7910
4590
2760
1150
748
348
9680
5600
3360
2100
98
587
274
6210
3630
2180
1900
82
491
229
4490
2620
1570
1370
78
467
218
4100
2400
1490
1250
62
371
173
2700
1580
948
1030
35
210
973
575
344
550
120
714
333
8900
5170
3100
403
78
464
252
72.7
282
81.4
222
64.1
186
53.7
176
50.8
140
40.4
79.1
22.8
270
77.9
176
50.8
312
125
308
88.9
344
99.3
270
77.9
226
65.2
215
62.1
171
49.4
96.4
27.8
329
95.0
214
61.8
217
4070
2380
1430
217
64.1
347
218
2400
1400
842
1380
156
132
38.1
59.0
17.0
18.0
5.2
8.8
2.5
162
28.9
160
46.2
71.9
20.8
21.9
6.3
10.7
3.1
72.9
572
340
203
193
22.2
74
45
27
115
11.0
24
16
8.8
47.6
4.3
23.2
469
368
308
293
233
132
448
292
98.0
29.9
14.6
98.2
[1]
[1]
νc
[1]
Refs, Remarks
1150 ± 50
This work, DA = 40%
M1 = 0.179 kg mol− 1
ρp = 1.5 g cm− 3
pH 2–4, 0.01 M HCl
T = 298 K
This work
[1]
9.2
DP = Mp/M1 - degree of polymerization the molecule.
Lext = DPlm - extended contour length of the molecule
λext = Lext/dex - aspect ratio parameter.
λ01 = λext(dex/d01)3 - aspect ratio parameter for 0.01 M electrolyte
νext = viscosity increment for fully extended chain, Eq. (12).
ν01 = fv (λ01) - viscosity increment for a cylinder and a spheroid valid for λ > 10.
νc = Cc fv (λ01) - viscosity increments for a cyclic molecule (Bernal et al., 2002) determined for 0.01 M electrolye.
νexp = [η]ρp - experimental viscosity increment.
lm = 0.460 nm; dex = 0.733 nm; lm01 = 0.378 nm; d01 = 0.809 nm (Table 1).
10
νexp
45
Anthonsen et al. (1993)
DA = 15%,
M1 = 0.167 kg mol− 1
pH 5, 0.01 M NaCl
T = 295 K,
ρp = 1.72 g cm-3 (assumed)
Tsaih and Chen (1999)
DA = 17%,
M1 = 0.168 g mol− 1
ρp = 1.72 g cm− 3 (assumed)
T = 303 K
Errington et al. (1993)
DA = 58%,
M1 = 0.185 g mol− 1
ρp = 1.72 g cm− 3
pH 4.3, 0.2 M NaCl
T = 298 K
D. Lupa et al.
Carbohydrate Polymers 292 (2022) 119676
agreement with theoretical predictions is evident for the molar mass
range of 35 to 98 kDa. Only for the 125 kDa sample, the experimental
intrinsic viscosity increment becomes markedly smaller than the theo
retical value predicted for the toroidal conformation of the molecules.
One can argue that this deviation can be attributed to the uncertainty in
the molar mass determination by the osmotic pressure measurements. It
may become significant for molar mass above 100 kDa given that the
concentration of chitosan in the osmotic pressure measurements
attained 6000 mg L− 1, increasing interactions among molecules, which
may lead to aggregation.
The significant role of chitosan solutions aggregation creating un
certainty in molar mass determination is confirmed in other works.
Thus, Tsaih and Chen (1999) performed systematic measurements of
chitosan solution viscosity for samples characterized by molar mass
determined by static light scattering varying between 78 and 914 kDa,
and the acetylation degree of 17%, (at pH 2.18). The influence of ionic
strength changed between 0.01 and 0.2 M at the temperature of 30 was
investigated. In Table 2 the experimental results obtained for 78 and
120 kDa samples are compared with the theoretical predictions derived
from our model assuming ρp = 1.72 g cm− 3. As can be inferred, the
intrinsic viscosity increment for the molar mass of 120 kDa is almost
eight times smaller than that theoretically predicted and more than four
times smaller than the experimental value obtained by Anthonsen et al.
(1993). For the molar mass of 78 kDa the increment is six times smaller
than that obtained by Anthonsen for practically the same experimental
conditions. The results obtained by Tsaih and Chen (1999) were inter
preted in terms of the Mark-Houwink (MH) equation. For 0.01 M ionic
strength, the a and K parameters were 0.715 and 5.48 × 10− 4 dL g − 1,
respectively.
review & editing. Aneta Michna: Investigation, Methodology, Writing –
review & editing, Funding acquisition. Monika Wasilewska: Investi
gation, Methodology, Writing – original draft. Paweł Pomastowski:
Investigation, Methodology, Writing – original draft. Adrian Gołę
biowski: Investigation, Methodology, Writing – original draft. Bogu
sław Buszewski: Conceptualization, Writing – review & editing, Data
curation. Zbigniew Adamczyk: Conceptualization, Writing – original
draft, Writing – review & editing, Supervision.
Declaration of competing interest
The authors declare that they have no known competing financial
interests or personal relationships that could have appeared to influence
the work reported in this paper.
Acknowledgments
This work was financially supported by the National Science Centre,
Poland, Opus Project, UMO-2018/31/B/ST8/03277 and partially by the
Statutory activity of the J. Haber Institute of Catalysis and Surfa
ceChemistry PAS (advanced calculation for interpretation of experi
mental data).
Paweł Pomastowski, Adrian Gołębiowski and Bogusław Buszewski
´ Center of Excellence “Towards Personalized
are members of Torun
Medicine” operating under Excellence Initiative-Research University.
Appendix A. Supplementary data
Supplementary data to this article can be found online at https://doi.
org/10.1016/j.carbpol.2022.119676.
5. Conclusions
References
Extensive MD modeling confirmed that the chitosan molecule ex
hibits in electrolyte solutions a flexible-rod shape showing no tendency
to the formation of helical conformation. Several parameters of primary
significance were theoretically calculated for the first time such as the
monomer contour length, the hydrated chain diameter and the molecule
density under different ionic strengths. Applying an extrapolation pro
cedure these data enabled to calculate the contour length for chitosan
molecules of various molar masses and the molecule length to diameter
ratio. Considering that the latter parameter assumes large values, the
molecule hydrodynamic diameter, gyration radius and the intrinsic
viscosity increments were calculated by applying the slender body hy
drodynamics. It was predicted that the hydrodynamic diameter for
straight and bent molecule conformation was practically equal, whereas
the increment decreased by ca. 40% for the toroidal molecule confor
mation. These theoretical results allowed to quantitatively interpret
experimental measurements, where the diffusion coefficient, the hy
drodynamic diameter, the electrophoretic mobility and the intrinsic
viscosity increment of the chitosan molecule were determined at a broad
range of pH and the temperature. A satisfactory agreement was attained
considering the sample dispersity.
Additionally, a thorough analysis of extensive literature data ac
quired under well-defined experimental conditions confirmed the utility
of the hydrodynamic model developed in this work for predicting
intrinsic viscosity of lower molar mass chitosan solutions.
It is argued that besides significance for basic science as reference
data, the obtained results can be exploited for the optimization of pro
cedures for macroion film formation at various substrates often used as
efficient supports for bioparticle immobilization.
Abraham, M. J., Murtola, T., Schulz, R., P´
all, S., Smith, J. C., Hess, B., & Lindahl, E.
(2015). GROMACS: High performance molecular simulations through multi-level
parallelism from laptops to supercomputers. SoftwareX, 1–2, 19–25. />10.1016/j.softx.2015.06.001
Adamczyk, Z., Bratek, A., Jachimska, B., Jasi´
nski, T., & Warszy´
nski, P. (2006). Structure
of poly(acrylic acid) in electrolyte solutions determined from simulations and
viscosity measurements. Journal of Physical Chemistry B, 110(45), 22426–22435.
/>Adamczyk, Z., Cichocki, B., Ekiel-Je˙zewska, M. L., Słowicka, A., Wajnryb, E., &
Wasilewska, M. (2012). Fibrinogen conformations and charge in electrolyte
solutions derived from DLS and dynamic viscosity measurements. Journal of Colloid
and Interface Science, 385(1), 244–257. />Adamczyk, Z., Jamroz˙ y, K., Batys, P., & Michna, A. (2014). Influence of ionic strength on
poly(diallyldimethylammonium chloride) macromolecule conformations in
electrolyte solutions. Journal of Colloid and Interface Science, 435, 182–190. https://
doi.org/10.1016/j.jcis.2014.07.037
Adamczyk, Z., Morga, M., Kosior, D., & Batys, P. (2018). Conformations of poly-l-lysine
molecules in electrolyte solutions: Modeling and experimental measurements.
Journal of Physical Chemistry C, 122(40), 23180–23190. />acs.jpcc.8b07606
Adamczyk, Z., Batys, P., Płazi´
nski, W., Morga, M., Lupa, D., & Michna, A. (2021).
Macroion molecule properties from slender body hydrodynamics. Polymers for
Advanced Technologies, 32(10), 3900–3908. />Anthonsen, M. W., Vårum, K. M., & Smidsrød, O. (1993). Solution properties of chitosans:
Conformation and chain stiffness of chitosans with different degrees of Nacetylation. Carbohydrate Polymers, 22(3), 193–201. />Bano, I., Arshad, M., Yasin, T., & Ghauri, M. A. (2019). Preparation, characterization and
evaluation of glycerol plasticized chitosan/PVA blends for burn wounds.
International Journal of Biological Macromolecules, 124, 155–162. />10.1016/j.ijbiomac.2018.11.073
Barducci, A., Bussi, G., & Parrinello, M. (2008). Well-tempered metadynamics: A
smoothly converging and tunable free-energy method. Physical Review Letters, 100
(2), Article 020603. />Bernal, J. M. G., Tirado, M. M., Freire, J. J., & García De La Torre, J. (2002). Monte Carlo
calculation of hydrodynamic properties of cyclic polymers in ideal solution.
Macromolecules, 23(13), 3357–3362. />Berth, G., & Dautzenberg, H. (2002). The degree of acetylation of chitosans and its effect
on the chain conformation in aqueous solution. Carbohydrate Polymers, 47(1), 39–51.
/>Boardman, S. J., Lad, R., Green, D. C., & Thornton, P. D. (2017). Chitosan hydrogels for
targeted dye and protein adsorption. Journal of Applied Polymer Science, 44846.
/>
CRediT authorship contribution statement
Dawid Lupa: Investigation, Methodology, Visualization, Writing –
´ ski: Inves
original draft, Writing – review & editing. Wojciech Płazin
tigation, Methodology, Visualization, Writing – original draft, Writing –
11
D. Lupa et al.
Carbohydrate Polymers 292 (2022) 119676
Brenner, H. (1974). Rheology of a dilute suspension of axisymmetric brownian particles.
International Journal of Multiphase Flow, 1(2), 195–341. />0301-9322(74)90018-4
Bussi, G., Donadio, D., & Parrinello, M. (2007). Canonical sampling through velocity
rescaling. The Journal of Chemical Physics, 126(1), Article 014101. />10.1063/1.2408420
Chien, R. C., Yen, M. T., & Mau, J. L. (2016). Antimicrobial and antitumor activities of
chitosan from shiitake stipes, compared to commercial chitosan from crab shells.
Carbohydrate Polymers, 138, 259264. />carbpol.2015.11.061
Că
olfen, H., Berth, G., & Dautzenberg, H. (2001). Hydrodynamic studies on chitosans in
aqueous solution. Carbohydrate Polymers, 45(4), 373–383. />S0144-8617(00)00269-1
Czechowska-Biskup, R., Wojtasz-Pająk, A., Sikorski, J., Henke, A., Ula´
nski, P., &
Rosiak, J. M. (2007). Aqueous solutions of hydrochloric acid as simple solvents of
chitosan for viscosity- and light-scattering-based molecular weight determination.
Polish Chitin Society, 87–94.
Darden, T., York, D., & Pedersen, L. (1998). Particle mesh Ewald: An N⋅log(N) method for
Ewald sums in large systems. The Journal of Chemical Physics, 98(12), 10089. https://
doi.org/10.1063/1.464397
Earl, D. J., & Deem, M. W. (2005). Parallel tempering: Theory, applications, and new
perspectives. Physical Chemistry Chemical Physics, 7(23), 3910–3916. https://doi.
org/10.1039/B509983H
Einstein, A. (1908). Elementare theorie der brownschen 1) bewegung. Zeitschrift für
Elektrochemie und Angewandte Physikalische Chemie, 14(17), 235–239. https://doi.
org/10.1002/bbpc.19080141703
Errington, N., Harding, S. E., Vårum, K. M., & Illum, L. (1993). Hydrodynamic
characterization of chitosans varying in degree of acetylation. International Journal of
Biological Macromolecules, 15(2), 113–117. />90008-A
Gonz´
alez-Espinosa, Y., Sabagh, B., Moldenhauer, E., Clarke, P., & Goycoolea, F. M.
(2019). Characterisation of chitosan molecular weight distribution by multidetection asymmetric flow-field flow fractionation (AF4) and SEC. International
Journal of Biological Macromolecules, 136, 911–919. />ijbiomac.2019.06.122
Guvench, O., Mallajosyula, S. S., Raman, E. P., Hatcher, E., Vanommeslaeghe, K.,
Foster, T. J., Jamison, F. W., & Mackerell, A. D. (2011). CHARMM additive all-atom
force field for carbohydrate derivatives and its utility in polysaccharide and
` protein modeling. Journal of Chemical Theory and Computation, 7
carbohydrate A
(10), 3162–3180. />Harding, S. E. (1995). On the hydrodynamic analysis of macromolecular conformation.
Biophysical Chemistry, 55(1–2), 69–93. />00143-8
Harding, S. E., Tombs, M. P., Adams, G. G., Paulsen, B. S., Inngjerdingen, K. T., &
Barsett, H. (2017). Marine polysaccharides. In S. E. Harding, M. P. Tombs,
G. G. Adams, B. S. Paulsen, K. T. Inngjerdingen, & H. Barsett (Eds.), An introduction to
polysaccharide biotechnology (2nd ed., pp. 153–192). Taylor & Francis Group.
Hasegawa, M., Isogai, A., & Onabe, F. (1994). Molecular mass distribution of chitin and
chitosan. Carbohydrate Research, 262(1), 161–166. />Hess, B. (2008). P-LINCS: A parallel linear constraint solver for molecular simulation.
Journal of Chemical Theory and Computation, 4(1), 116–122. />10.1021/ct700200b
Hockney, R. (1970). The potential calculation and some applications. In B. Alder,
S. Fernbach, & M. Rotenberg (Eds.), Methods in computational physics (pp. 135–211).
Jorgensen, W. L., Chandrasekhar, J., Madura, J. D., Impey, R. W., & Klein, M. L. (1998).
Comparison of simple potential functions for simulating liquid water. The Journal of
Chemical Physics, 79(2), 926. />Kaczmarek, M. B., Struszczyk-Swita, K., Li, X., Szczęsna-Antczak, M., & Daroch, M.
(2019). Enzymatic modifications of chitin, chitosan, and chitooligosaccharides.
Frontiers in Bioengineering and Biotechnology, 7, 243. />fbioe.2019.00243
Kasaai, M. R. (2007). Calculation of Mark–Houwink–Sakurada (MHS) equation
viscometric constants for chitosan in any solvent–temperature system using
experimental reported viscometric constants data. Carbohydrate Polymers, 68(3),
477–488. />Korchagina, E. V., & Philippova, O. E. (2010). Multichain aggregates in dilute solutions
of associating polyelectrolyte keeping a constant size at the increase in the chain
length of individual macromolecules. Biomacromolecules, 11(12), 3457–3466.
/>Lamarque, G., Lucas, J. M., Viton, C., & Domard, A. (2005). Physicochemical behavior of
homogeneous series of acetylated chitosans in aqueous solution: Role of various
structural parameters. Biomacromolecules, 6(1), 131–142. />bm0496357
Manning, G. S. (1979). Counterion binding in polyelectrolyte theory. Accounts of
Chemical Research, 12(12), 443–449. />Mansfield, M. L., & Douglas, J. F. (2008). Transport properties of rodlike particles.
Macromolecules, 41(14), 5422–5432. />Meng, X., Liu, H., Dong, X., Wang, Q., Xia, Y., & Hu, X. (2022). A soft Pickering emulsifier
made from chitosan and peptides endows stimuli-responsiveness, bioactivity and
biocompatibility to emulsion. Carbohydrate Polymers, 277, Article 118768. https://
doi.org/10.1016/j.carbpol.2021.118768
Michna, A., Adamczyk, Z., Sofi´
nska, K., & Matusik, K. (2017). Monolayers of poly(amido
amine) dendrimers on mica – In situ streaming potential measurements. Journal of
Colloid and Interface Science, 485, 232–241. />jcis.2016.09.007
Michna, A., Pomorska, A., Nattich-Rak, M., Wasilewska, M., & Adamczyk, Z. (2020).
Hydrodynamic solvation of poly(amido amine) dendrimer monolayers on silica.
Journal of Physical Chemistry C, 124, 17684–17695. />jpcc.0c04638
Michna, A., Płazi´
nski, W., Lupa, D., Wasilewska, M., & Adamczyk, Z. (2021).
Carrageenan molecule conformations and electrokinetic properties in electrolyte
solutions: Modeling and experimental measurements. Food Hydrocolloids, 121,
Article 107033. />Miyamoto, S., & Kollman, P. A. (1992). Settle: An analytical version of the SHAKE and
RATTLE algorithm for rigid water models. Journal of Computational Chemistry, 13(8),
952–962. />Morris, G. A., Castile, J., Smith, A., Adams, G. G., & Harding, S. E. (2009).
Macromolecular conformation of chitosan in dilute solution: A new global
hydrodynamic approach. Carbohydrate Polymers, 76(4), 616–621. />10.1016/j.carbpol.2008.11.025
Ohshima, H. (2012). Electrophoretic mobility of charged particles. In H. Ohshima (Ed.),
Electrical phenomena at interfaces and biointerfaces: Fundamentals and applications in
nano-, bio-, and environmental sciences (1st ed., pp. 35–49). John Wiley & Sons Inc.
Park, S., Lee, J., Qi, Y., Kern, N. R., Lee, H. S., Jo, S., Joung, I., Joo, K., Lee, J., & Im, W.
(2019). CHARMM-GUI Glycan Modeler for modeling and simulation of
carbohydrates and glycoconjugates. Glycobiology, 29(4), 320–331. />10.1093/glycob/cwz003
Parrinello, M., & Rahman, A. (1981). Polymorphic transitions in single crystals: A new
molecular dynamics method. Journal of Applied Physics, 52(12), 7182–7190. https://
doi.org/10.1063/1.328693
Patrulea, V., Ostafe, V., Borchard, G., & Jordan, O. (2015). Chitosan as a starting material
for wound healing applications. European Journal of Pharmaceutics and
Biopharmaceutics, 97, 417–426. />Pini, N. I. P., Lima, D. A. N. L., Luka, B., Ganss, C., & Schlueter, N. (2020). Viscosity of
chitosan impacts the efficacy of F/Sn containing toothpastes against erosive/
abrasive wear in enamel. Journal of Dentistry, 92, Article 103247. />10.1016/j.jdent.2019.103247
Raguzzoni, J. C., Delgadillo, I., & Lopes da Silva, J. A. (2016). Influence of a cationic
polysaccharide on starch functionality. Carbohydrate Polymers, 150, 369–377.
/>Rajabi, M., McConnell, M., Cabral, J., & Ali, M. A. (2021). Chitosan hydrogels in 3D
printing for biomedical applications. Carbohydrate Polymers, 260, Article 117768.
/>Rinaudo, M., Milas, M., & Dung, P. L. (1993). Characterization of chitosan. Influence of
ionic strength and degree of acetylation on chain expansion. International Journal of
Biological Macromolecules, 15(5), 281–285. />90027-J
Saha, D., & Bhattacharya, S. (2010). Hydrocolloids as thickening and gelling agents in
food: A critical review. Journal of Food Science and Technology, 47(6), 587–597.
/>Schatz, C., Viton, C., Delair, T., Pichot, C., & Domard, A. (2003). Typical physicochemical
behaviors of chitosan in aqueous solution. Biomacromolecules, 4(3), 641–648.
/>Singhal, A., Schneible, J. D., Lilova, R. L., Hall, C. K., Menegatti, S., & Grafmüller, A.
(2020). A multiscale coarse-grained model to predict the molecular architecture and
drug transport properties of modified chitosan hydrogels. Soft Matter, 16(47),
10591–10610. />Soares, L.d. S., Perim, R. B., de Alvarenga, E. S., Guimar˜
aes, L.d. M., Teixeira, A. V. N.
d. C., Coimbra, J. S.d. R., & de Oliveira, E. B. (2019). Insights on physicochemical
aspects of chitosan dispersion in aqueous solutions of acetic, glycolic, propionic or
lactic acid. International Journal of Biological Macromolecules, 128(1), 140–148.
/>Suo, H., Zhang, J., Xu, M., & Wang, L. (2021). Low-temperature 3D printing of collagen
and chitosan composite for tissue engineering. Materials Science and Engineering C,
123, Article 111963. />Tribello, G. A., Bonomi, M., Branduardi, D., Camilloni, C., & Bussi, G. (2014). PLUMED 2:
New feathers for an old bird. Computer Physics Communications, 185(2), 604–613.
/>Tsaih, M. L., & Chen, R. H. (1999). Effects of ionic strength and pH on the diffusion
coefficients and conformation of chitosans molecule in solution. Journal of Applied
Polymer Science, 73(10), 2041–2050. />(19990906)73:10<2041::AID-APP22>3.0.CO;2-T
Tsereteli, L., & Grafmüller, A. (2017). An accurate coarse-grained model for chitosan
polysaccharides in aqueous solution. PLoS ONE, 12(7), Article e0180938. https://
doi.org/10.1371/journal.pone.0180938
Vakili, M., Rafatullah, M., Salamatinia, B., Abdullah, A. Z., Ibrahim, M. H., Tan, K. B.,
Gholami, Z., & Amouzgar, P. (2014). Application of chitosan and its derivatives as
adsorbents for dye removal from water and wastewater: A review. Carbohydrate
Polymers, 113, 115–130. />Wan Ngah, W. S., Teong, L. C., & Hanafiah, M. A. K. M. (2011). Adsorption of dyes and
heavy metal ions by chitosan composites: A review. Carbohydrate Polymers, 83(4),
1446–1456. />Wang, W., Bo, S., Li, S., & Qin, W. (1991). Determination of the Mark-Houwink equation
for chitosans with different degrees of deacetylation. International Journal of
Biological Macromolecules, 13(5), 281–285. />90027-R
Wardy, W., Pujols Martínez, K. D., Xu, Z., No, H. K., & Prinyawiwatkul, W. (2014).
Viscosity changes of chitosan solution affect physico-functional properties and
12
D. Lupa et al.
Carbohydrate Polymers 292 (2022) 119676
consumer perception of coated eggs during storage. LWT - Food Science and
Technology, 55(1), 67–73. />Wasilewska, M., Adamczyk, Z., Pomorska, A., Nattich-Rak, M., & Sadowska, M. (2019).
Human serum albumin adsorption kinetics on silica: Influence of protein solution
stability. Langmuir, 35(7), 2639–2648. />langmuir.8b03266
Weinhold, M. X., & Thă
oming, J. (2011). On conformational analysis of chitosan.
Carbohydrate Polymers, 84(4), 1237–1243. />carbpol.2011.01.011
13