Microkinetic model of propylene oligomerization on Brønsted acidic zeolites at low conversion
Bạn đang xem bản rút gọn của tài liệu. Xem và tải ngay bản đầy đủ của tài liệu tại đây (1.19 MB, 69 trang )
Subscriber access provided by Northwestern Univ. Library
Article
Microkinetic model of propylene oligomerization
on Brønsted acidic zeolites at low conversion
Sergio Vernuccio, Elizabeth Bickel, Rajamani Gounder, and Linda J. Broadbelt
ACS Catal., Just Accepted Manuscript • DOI: 10.1021/acscatal.9b02066 • Publication Date (Web): 21 Aug 2019
Downloaded from pubs.acs.org on September 2, 2019
Just Accepted
“Just Accepted” manuscripts have been peer-reviewed and accepted for publication. They are posted
online prior to technical editing, formatting for publication and author proofing. The American Chemical
Society provides “Just Accepted” as a service to the research community to expedite the dissemination
of scientific material as soon as possible after acceptance. “Just Accepted” manuscripts appear in
full in PDF format accompanied by an HTML abstract. “Just Accepted” manuscripts have been fully
peer reviewed, but should not be considered the official version of record. They are citable by the
Digital Object Identifier (DOI®). “Just Accepted” is an optional service offered to authors. Therefore,
the “Just Accepted” Web site may not include all articles that will be published in the journal. After
a manuscript is technically edited and formatted, it will be removed from the “Just Accepted” Web
site and published as an ASAP article. Note that technical editing may introduce minor changes
to the manuscript text and/or graphics which could affect content, and all legal disclaimers and
ethical guidelines that apply to the journal pertain. ACS cannot be held responsible for errors or
consequences arising from the use of information contained in these “Just Accepted” manuscripts.
is published by the American Chemical Society. 1155 Sixteenth Street N.W.,
Washington, DC 20036
Published by American Chemical Society. Copyright © American Chemical Society.
However, no copyright claim is made to original U.S. Government works, or works
produced by employees of any Commonwealth realm Crown government in the course
of their duties.
Page 1 of 68
1
2
3
4
5
6
7
8
9
10
11
12
13
14
15
16
17
18
19
20
21
22
23
24
25
26
27
28
29
30
31
32
33
34
35
36
37
38
39
40
41
42
43
44
45
46
47
48
49
50
51
52
53
54
55
56
57
58
59
60
ACS Catalysis
Microkinetic model of propylene oligomerization on
Brønsted acidic zeolites at low conversion
Sergio Vernuccioa, Elizabeth E. Bickelb, Rajamani Gounderb, Linda J. Broadbelta*
aDepartment
of Chemical and Biological Engineering, Northwestern University, Evanston, IL, 60208, United States
bDavidson
School of Chemical Engineering, Purdue University, West Lafayette, IN, 47907, United States
Abstract
The construction of a computational framework that describes the kinetic details of the
propylene oligomerization reaction network on Brønsted acidic zeolites is particularly
challenging due to the considerable number of species and reaction steps involved in
the mechanism. This work presents a detailed microkinetic model at the level of
elementary steps that includes 4,243 reactions and 909 ionic and molecular species
within the C2-C9 carbon number range. An automated generation procedure using a set
of eight reaction families was applied to construct the reaction network. The kinetic
ACS Paragon Plus Environment
1
ACS Catalysis
1
2
3
4
5
6
7
8
9
10
11
12
13
14
15
16
17
18
19
20
21
22
23
24
25
26
27
28
29
30
31
32
33
34
35
36
37
38
39
40
41
42
43
44
45
46
47
48
49
50
51
52
53
54
55
56
57
58
59
60
Page 2 of 68
parameters for each elementary step were estimated using transition state theory,
Evans-Polanyi relationships, and thermodynamic data. The reaction mechanism and its
governing kinetic parameters were embedded into the design equation of a plug-flow
reactor, which was the reactor configuration used to experimentally measure reactant
and product concentrations as a function of propylene conversion and temperature on a
representative H-ZSM-5 (MFI) zeolite. The resulting mechanistic model is able to
accurately describe the experimental data over a wide range of operating conditions in
the low propylene conversion (<4%) regime. The agreement between experimentally
measured propylene conversion and product selectivities and the model results
demonstrates the robustness of the model, and the approach used to develop it, to
simulate the kinetic behavior of this complex reaction network.
Keywords. Oligomerization; Propylene; Kinetic Model; Zeolite; H-ZSM-5.
1. Introduction
ACS Paragon Plus Environment
2
Page 3 of 68
1
2
3
4
5
6
7
8
9
10
11
12
13
14
15
16
17
18
19
20
21
22
23
24
25
26
27
28
29
30
31
32
33
34
35
36
37
38
39
40
41
42
43
44
45
46
47
48
49
50
51
52
53
54
55
56
57
58
59
60
ACS Catalysis
The direct conversion of light olefins into heavier oligomers over Brønsted acid
catalysts is an economically attractive strategy to upgrade shale gas feedstocks into
liquid products. The increased availability of shale resources and their consequent
decreased cost over the last decade have attracted significant interest in their
conversion into chemicals and liquid transportation fuels [1-4]. A typical process for the
conversion of light olefins to gasoline range products (< C12) is based on the use of
shape-selective Brønsted acidic zeolites such as H-ZSM-5 (MFI) [5,6], because
Brønsted acid sites that charge-compensate framework Al atoms in zeolites are reactive
toward unsaturated olefinic molecules. The application of this family of zeolites was
originally proposed, as a potential replacement for solid phosphoric acid catalysts, in the
olefins-to-gasoline process developed by Mobil to convert light olefins from fluid catalytic
cracking (FCC) [7-11].
The olefin oligomerization reaction sequence over acidic zeolites can be rationalized in
terms of alkylation chemistry, where the first step is the protonation of a physisorbed
olefin by a Brønsted acid site to form an ionic intermediate, followed by addition of an
olefin to form a higher carbon number intermediate, and finally deprotonation to form a
ACS Paragon Plus Environment
3
ACS Catalysis
1
2
3
4
5
6
7
8
9
10
11
12
13
14
15
16
17
18
19
20
21
22
23
24
25
26
27
28
29
30
31
32
33
34
35
36
37
38
39
40
41
42
43
44
45
46
47
48
49
50
51
52
53
54
55
56
57
58
59
60
Page 4 of 68
heavier product olefin. This process is highly exothermic and results in a net decrease in
the number of molecules [12] upon the formation of true oligomers, which are the
products expected from dimerization and subsequent oligomerization reactions of the
olefin monomer reactant [13]. These oligomers can further undergo skeletal
isomerization and cracking via β-scission, resulting in a mixture of olefins including
carbon numbers that are not integer multiples of the initial monomer. These reactions
contribute to modifying the molecular weight distribution of the products, resulting in
large and highly interconnected reaction networks.
The typical approach that is applied to study these complex reacting systems is
“pathways-level modelling”, which consists of lumping of several reactions into a single
one describing the conversion of a reagent into a product and disregarding any reaction
intermediate(s) [14-16]. In lumped kinetic models, several compounds are grouped
together based on their molecular properties, such as the carbon number. These models
are relatively easy to develop because the number of lumps and the number of reactions
considered
are
limited,
however,
molecular
information
is
obscured
by
the
multicomponent nature of each lump. Furthermore, the use of these models is usually
ACS Paragon Plus Environment
4
Page 5 of 68
1
2
3
4
5
6
7
8
9
10
11
12
13
14
15
16
17
18
19
20
21
22
23
24
25
26
27
28
29
30
31
32
33
34
35
36
37
38
39
40
41
42
43
44
45
46
47
48
49
50
51
52
53
54
55
56
57
58
59
60
ACS Catalysis
associated with several assumptions, for example concerning the nature of the rate-
determining step(s). This affects the predictive power of the model, rendering its
application beyond the range of conditions for which it was specifically developed
limited. The alternative proposed in this paper is based on the development of a
microkinetic model, which is an attractive method to elucidate the complexity of a large
and highly interconnected reaction network. Substantial progress has been made in
recent decades regarding automated generation of reaction mechanisms applied to
many different types of chemistries and disparate processes [17]. In this work, a detailed
reaction network was automatically generated to include each elementary reaction
occurring at the Brønsted acid sites in the zeolite catalyst. The reaction rate of each step
was expressed by an elementary rate law containing specific kinetic coefficients. All of
the involved kinetic parameters are specified based on theoretical considerations and
are, for this reason, independent of operating conditions and feed.
The resulting model is able to describe with very good accuracy the salient kinetic
details of propylene oligomerization measured experimentally on a representative
commercial H-ZSM-5 zeolite at low conversion. The dominant reaction pathways that
ACS Paragon Plus Environment
5
ACS Catalysis
1
2
3
4
5
6
7
8
9
10
11
12
13
14
15
16
17
18
19
20
21
22
23
24
25
26
27
28
29
30
31
32
33
34
35
36
37
38
39
40
41
42
43
44
45
46
47
48
49
50
51
52
53
54
55
56
57
58
59
60
Page 6 of 68
consume propylene and form oligomeric products are revealed based on net rate
analysis.
2. Automated kinetic network generation
The first step in building a microkinetic model to describe the oligomerization of
propylene was the automated generation of a reaction network. In this work we
employed NetGen, a software package developed by Broadbelt et al. [18][19].
The elementary steps proposed to describe the oligomerization mechanism of the
generic olefin 𝐶𝑛𝐻2𝑛 are listed below [20]:
𝐶𝑛𝐻2𝑛(𝑔)↔𝐶𝑛𝐻2𝑛(𝑝)
(1)
+
𝐶𝑛𝐻2𝑛(𝑝) + 𝐻 + ↔ 𝐶𝑛𝐻2𝑛
+ 1(𝑝)
(2)
+
+
𝐶𝑛𝐻2𝑛
+ 1(𝑝) + 𝐶𝑛𝐻2𝑛(𝑝)↔𝐶2𝑛𝐻4𝑛 + 1(𝑝)
(3)
+
+
𝐶2𝑛𝐻4𝑛
+ 1(𝑝)↔ i-𝐶2𝑛𝐻4𝑛 + 1(𝑝)
(4)
+
+
𝐶2𝑛𝐻4𝑛
+ 1(𝑝)↔𝐶2𝑛𝐻4𝑛(𝑝) + 𝐻
(5)
𝐶2𝑛𝐻4𝑛(𝑝)↔𝐶2𝑛𝐻4𝑛(𝑔)
(6)
ACS Paragon Plus Environment
6
Page 7 of 68
1
2
3
4
5
6
7
8
9
10
11
12
13
14
15
16
17
18
19
20
21
22
23
24
25
26
27
28
29
30
31
32
33
34
35
36
37
38
39
40
41
42
43
44
45
46
47
48
49
50
51
52
53
54
55
56
57
58
59
60
ACS Catalysis
The suffixes (g) and (p) indicate the gas phase and the pores of the zeolite, respectively.
After physisorption of the olefin from the gas phase into the pores of the zeolite (step 1),
an ionic intermediate is generated through protonation (step 2). The exact nature of the
ionic intermediates (carbenium ion or alkoxide) depends on the specific structure of the
bound species, temperature, and geometry of the active site [21]. The resulting
chemisorbed ionic intermediate can increase its hydrocarbon chain length by undergoing
oligomerization with a physisorbed olefin (step 3) or it can isomerize (step 4), where the
symbol i before the olefin (step 4) indicates a particular isomer. β-Scission is the reverse
step of oligomerization, and it forms a smaller olefin and a smaller ionic species from a
larger oligomer. The oligomer product deprotonates (step 5) and desorbs (step 6) from
the pore of the zeolite into the gas phase.
The chemical reactions that a physisorbed species can undergo, as specified in steps
2-5, were grouped into reaction families and are listed in Table 1 (extracted from [17]).
The ionic intermediates are referred to herein as carbenium ions for convenience,
although their nature can reflect more carbenium ion or more alkoxide character. The
isomerization steps include hydride shift, methyl shift, and α and β protonated
ACS Paragon Plus Environment
7
ACS Catalysis
1
2
3
4
5
6
7
8
9
10
11
12
13
14
15
16
17
18
19
20
21
22
23
24
25
26
27
28
29
30
31
32
33
34
35
36
37
38
39
40
41
42
43
44
45
46
47
48
49
50
51
52
53
54
55
56
57
58
59
60
Page 8 of 68
cyclopropane (PCP) branching. This last isomerization step is postulated to proceed via
a PCP intermediate with the charge delocalized over the ring [22]. The subcategories α
and β depend on the bond to be broken in the three-membered ring intermediate. These
ionic intermediates can also undergo hydride transfer steps to form paraffins, but since
the experimental data collected in this study at low conversion (<4%) showed the
presence of only minor amounts of paraffins (Figure S1, Table S1, <0.2% of the overall
product distribution), the list of reactions considered in Table 1 excludes hydride transfer
steps. In this regard, paraffins are considered side products during oligomerization and
cracking of light olefins on acidic zeolites [23-25]. In some cases, during the mechanism
generation processes, the minor amounts of paraffins that are detected experimentally
are lumped with the olefins of the same carbon number in order to reduce calculation
efforts [23,26], which was the approach used here.
Table 1. List of reaction families proposed for the oligomerization of propylene on acidic
zeolites at low conversion (extracted from [17]).
ACS Paragon Plus Environment
8
Page 9 of 68
1
2
3
4
5
6
7
8
9
10
11
12
13
14
15
16
17
18
19
20
21
22
23
24
25
26
27
28
29
30
31
32
33
34
35
36
37
38
39
40
41
42
43
44
45
46
47
48
49
50
51
52
53
54
55
56
57
58
59
60
ACS Catalysis
Protonation
R1
Deprotonation
H R1
Oligomerization
R1+
β-Scission
R1
Hydride Shift
H R1
+ H+
R2
R2+
R2
α-PCP-Branching
R1
R3
R2
R2
+ H+
R1
R2
R1+
R3+
+
R2+
CH3
Methyl Shift
R1
+ R2
R2+
H R1
R1
+ R2
R3
R2H
+
R3
R3+
+
R4
R1
R2
+
R1
R2
β-PCP-Branching
R2
R3
+
R3
R4H
R5
R1
R2
R3H
+
R1
CH3
R3
R4H
R5
R1
R2
R4
R3H
R4
R5
+
R4
R5
In principle, the automated generation process is infinite because oligomerization
leads to the formation of higher molecular weight ionic species through consecutive
additions of monomers, and the reaction family can be subsequently applied to each
product. In this study, a carbon- and rank-based termination criterion 𝑐𝑖 ― 𝑟𝑗 [27] was
ACS Paragon Plus Environment
9
ACS Catalysis
1
2
3
4
5
6
7
8
9
10
11
12
13
14
15
16
17
18
19
20
21
22
23
24
25
26
27
28
29
30
31
32
33
34
35
36
37
38
39
40
41
42
43
44
45
46
47
48
49
50
51
52
53
54
55
56
57
58
59
60
Page 10 of 68
applied, where i = 9 and j = 0 are respectively the maximum number of carbon atoms
and the highest rank of the species allowed to react. However, as expected, imposing
this termination criterion resulted in the generation of several ionic species of rank 0 and
carbon number > 9 that were not allowed to react further because of their failure to meet
the carbon number criterion. This is a direct consequence of the oligomerization process
that produces heavier ionic oligomers that are not associated with any increase in rank.
In order to avoid the presence of these unwanted intermediates, the reaction network
was limited to ionic and molecular species with carbon number lower or equal to 9.
3. Kinetic parameter determination
3.1 Frequency factors. The kinetic constants for the elementary steps (1 to 6) were
expressed as a function of temperature following an Arrhenius dependence:
with
{
0
𝐵𝑖 = |∆𝐻𝑝ℎ𝑦𝑠|
𝐸𝑎,𝑖
𝐵𝑖
( )
(7)
i = physisorption
i = desorption
otherwise
(8)
𝑘𝑖 = 𝐴𝑖 ∙ 𝑒𝑥𝑝 ―
𝑅𝑇
ACS Paragon Plus Environment
10
Page 11 of 68
1
2
3
4
5
6
7
8
9
10
11
12
13
14
15
16
17
18
19
20
21
22
23
24
25
26
27
28
29
30
31
32
33
34
35
36
37
38
39
40
41
42
43
44
45
46
47
48
49
50
51
52
53
54
55
56
57
58
59
60
ACS Catalysis
where 𝑘 is the rate coefficient, 𝐴 is the Arrhenius pre-exponential factor, 𝑅 is the
universal gas constant, 𝑇 is the temperature, ∆𝐻𝑝ℎ𝑦𝑠 is the physisorption enthalpy, and
𝐸𝑎 is the activation energy. The reverse of physisorption is denoted as “desorption” in
Eq. 8.
The pre-exponential factors were estimated using transition state theory, assuming
that every elementary step proceeds through the formation of a transition state or
activated complex [28]:
𝐴=
𝑘𝐵𝑇
( )
ℎ
𝑒
∆𝑆 ≠
𝑅 1 ― ∆𝑛 ≠
𝑒
(𝑐0)∆𝑛
≠
(9)
where 𝑘𝐵 is Boltzmann’s constant, ℎ is Planck’s constant, ∆𝑆 ≠ is the entropy change
between the reactants and the activated complex, ∆𝑛 ≠ is the change in the number of
moles in going from the reactants to the transition state, and 𝑐0 is the standard state
concentration (1 M).
The first term in Eq. (9) (𝑘𝐵𝑇/ℎ) represents the vibrational frequency along the reaction
coordinate, and it is followed by an expression derived from the equilibrium constant
between the reactants and transition state. The entropy changes for some of the
reactions involved in the network were obtained from data tabulated by Nguyen et al.
ACS Paragon Plus Environment
11
ACS Catalysis
1
2
3
4
5
6
7
8
9
10
11
12
13
14
15
16
17
18
19
20
21
22
23
24
25
26
27
28
29
30
31
32
33
34
35
36
37
38
39
40
41
42
43
44
45
46
47
48
49
50
51
52
53
54
55
56
57
58
59
60
Page 12 of 68
[29] for isobutene on H-ZSM-5 at 300 K. That study reports an entropy loss in going from
physisorbed isobutene and chemisorbed tert-butyl ion to the transition state. Vice versa,
an entropy gain is reported in going from chemisorbed tert-butoxy ion to the transition
state. This indicates that, at industrially relevant temperatures (T >300 K), the formation
of tertiary alkoxides is not entropically favoured. Furthermore, in this temperature range,
the entropic contribution to Gibbs free energies outweighs the enthalpic contribution of
covalent bond formation. As a consequence, the formation of tertiary alkoxides is less
favorable than the formation of tertiary carbenium ions within the pores of the zeolite
[21][29]. Secondary species, on the other hand, were reported to remain stable as
alkoxides in a temperature range of 300-600 K. However, at higher temperatures, the
formation of a covalent bond in the alkoxide state introduces an entropic penalty that is
not compensated for by the enthalpic gain, resulting in formation of a carbenium ion
being more favorable [21]. According to this finding, in the present work which covers a
temperature range of 483-523 K, secondary intermediates were treated as alkoxides,
while tertiary intermediates were treated as carbenium ions. Primary carbenium ions are
commonly not considered as candidate intermediates due to their highly unstable nature
ACS Paragon Plus Environment
12
Page 13 of 68
1
2
3
4
5
6
7
8
9
10
11
12
13
14
15
16
17
18
19
20
21
22
23
24
25
26
27
28
29
30
31
32
33
34
35
36
37
38
39
40
41
42
43
44
45
46
47
48
49
50
51
52
53
54
55
56
57
58
59
60
ACS Catalysis
[30,31], but they can be stabilized by interaction with the zeolite framework. For this
reason, all primary intermediate species were treated as alkoxides in this study.
The entropy change between reactants and transition states was assumed to be the
same for each elementary step within a reaction family involving ionic intermediates with
the same alkoxide or carbenium ion character as the reactants. The estimates of the
order of magnitude of the frequency factors are listed in Table 2, together with the
entropy changes used in the calculation. The frequency factor for alkoxide isomerization
was estimated assuming that the entropy change between reactants and transition
states is zero. The ratio of frequency factors for physisorption and desorption
𝐴𝑝ℎ𝑦𝑠
𝐴𝑑𝑒𝑝ℎ𝑦𝑠
was
estimated to be O(10-7) according to an entropy loss of 116 J·mol-1·K-1 in going from gas-
phase isobutene to the physisorbed state [29].
Table 2. Order of magnitude of the frequency factors estimated at 503 K according to
transition state theory. ∆𝑆 ≠ for protonation and deprotonation are reported in [29].
Reaction
∆𝑆 ≠
[J·mol-1·K-1]
∆𝑛 ≠
𝑂(𝐴)
[-]
ACS Paragon Plus Environment
13
ACS Catalysis
1
2
3
4
5
6
7
8
9
10
11
12
13
14
15
16
17
18
19
20
21
22
23
24
25
26
27
28
29
30
31
32
33
34
35
36
37
38
39
40
41
42
43
44
45
46
47
48
49
50
51
52
53
54
55
56
57
58
59
60
Page 14 of 68
Protonation
-54
-1
104
Pa-1 s-1
Deprotonation (carbenium ion)
-71
0
109
s-1
Deprotonation (alkoxide)
23
0
1014
s-1
Isomerization (alkoxide)
0
0
1013
s-1
A generalization of these entropy values for unimolecular and bimolecular reactions
resulted in the application of the frequency factors calculated for protonation and
deprotonation to oligomerization and β-scission, by analogy. The frequency factors for
all the elementary steps that involved carbenium ions as reactants were calculated from
the corresponding ones involving alkoxides, by applying the same scaling factor of 10-5
specifically calculated for deprotonation (Table 2).
3.3 Reaction enthalpies. The enthalpy of reaction on the surface of the zeolite is
defined as the sum of the enthalpies of formation of products and reactants, weighted by
their stoichiometric coefficients. For example, for a typical oligomerization step between
a molecule 𝑅𝐻 and a protonated intermediate 𝑅1+ :
ACS Paragon Plus Environment
14
Page 15 of 68
1
2
3
4
5
6
7
8
9
10
11
12
13
14
15
16
17
18
19
20
21
22
23
24
25
26
27
28
29
30
31
32
33
34
35
36
37
38
39
40
41
42
43
44
45
46
47
48
49
50
51
52
53
54
55
56
57
58
59
60
ACS Catalysis
𝑅𝐻 + 𝑅1+ →𝑅2+
(10)
∆𝐻𝑅 = ∆𝐻𝑓𝑝ℎ𝑦𝑠(𝑅2+ ) ― ∆𝐻𝑓𝑝ℎ𝑦𝑠(𝑅1+ ) ― ∆𝐻𝑓𝑝ℎ𝑦𝑠(𝑅𝐻)
(11)
the enthalpy of reaction ∆𝐻𝑅 is expressed as:
where ∆𝐻𝑓𝑝ℎ𝑦𝑠 are the enthalpies of formation of the species in their physisorbed states.
The latter can be related to the enthalpies of formation in the gas phase by means of:
∆𝐻𝑓𝑝ℎ𝑦𝑠(𝑅𝐻) = ∆𝐻𝑓𝑔(𝑅𝐻) ― ∆𝐻𝑝ℎ𝑦𝑠(𝑅𝐻)
(12)
∆𝐻𝑓𝑝ℎ𝑦𝑠(𝑅2+ ) = ∆𝐻𝑓𝑔(𝑅2+ ) ― ∆𝑞(𝑅2+ )
(14)
∆𝐻𝑓𝑝ℎ𝑦𝑠(𝑅1+ ) = ∆𝐻𝑓𝑔(𝑅1+ ) ― ∆𝑞(𝑅1+ )
(13)
where ∆𝐻𝑓𝑔 is the enthalpy of formation of the species in the gas phase, ∆𝐻𝑝ℎ𝑦𝑠 is the
enthalpy change of a neutral molecular species in going from the gas phase to its
physisorbed state within the zeolite pore, and ∆𝑞 is the stabilization enthalpy of a
protonated intermediate [32]. Combining Eq. (11), (12), (13), and (14), the enthalpy of
reaction can be finally expressed as:
∆𝐻𝑅 = ∆𝐻𝑓𝑔(𝑅2+ ) ― ∆𝑞(𝑅2+ ) + ∆𝑞(𝑅1+ ) ― ∆𝐻𝑓𝑔(𝑅1+ ) ― ∆𝐻𝑓𝑔(𝑅𝐻) + ∆𝐻𝑝ℎ𝑦𝑠(𝑅𝐻)
(15)
∆𝐻𝑅 = ∆𝐻𝑅,𝑔 ― ∆𝑞(𝑅2+ ) + ∆𝑞(𝑅1+ ) + ∆𝐻𝑝ℎ𝑦𝑠(𝑅𝐻)
(16)
or concisely as:
where ∆𝐻𝑅,𝑔 is the reaction enthalpy in the gas phase.
Generalizing, the reaction enthalpy of every elementary step can be expressed as:
ACS Paragon Plus Environment
15
ACS Catalysis
1
2
3
4
5
6
7
8
9
10
11
12
13
14
15
16
17
18
19
20
21
22
23
24
25
26
27
28
29
30
31
32
33
34
35
36
37
38
39
40
41
42
43
44
45
46
47
48
49
50
51
52
53
54
55
56
57
58
59
60
∆𝐻𝑅 = ∆𝐻𝑅,𝑔 +
∑𝜈 ∙ ∆𝑞(𝑅
𝑖
𝑖
+
𝑖
) + ∑𝜈𝑗 ∙ ∆𝐻𝑝ℎ𝑦𝑠(𝑅𝐻𝑗)
𝑗
Page 16 of 68
(17)
where 𝑅𝑖+ and 𝑅𝐻𝑗 are, respectively, a generic ionic intermediate and a generic
molecular species. 𝜈 is the stoichiometric coefficient of each species in the elementary
step and is defined as positive for products and negative for reactants.
The reaction enthalpy in the gas phase was calculated based on Benson’s group
additivity method [33] using the group additivity values reported in a previous study [34].
The physisorption enthalpies of the neutral species were estimated depending on the
molecule type from linear relationships between physisorption energies and carbon
number reported in the literature. From these statistical thermodynamic studies, we
deduced that in H-ZSM-5 zeolites, each single-bonded carbon atom provides a
contribution of 3.0 kcal·mol-1 [35], while each double-bonded carbon atom provides a
contribution of 5.6 kcal·mol-1 [36] to the overall physisorption enthalpy of a molecule.
However, bimolecular reactions require co-adsorption of two molecules at the same
Brønsted acid site. After the physisorption of the first molecule, the second molecule
adsorbs on the active site-adsorbate complex with a reduced energy (approximately
60% of the physisorption energy of the first molecule at an uncovered Brønsted acid
ACS Paragon Plus Environment
16
Page 17 of 68
1
2
3
4
5
6
7
8
9
10
11
12
13
14
15
16
17
18
19
20
21
22
23
24
25
26
27
28
29
30
31
32
33
34
35
36
37
38
39
40
41
42
43
44
45
46
47
48
49
50
51
52
53
54
55
56
57
58
59
60
ACS Catalysis
site) [37][38]. For this reason, the physisorption energy of this second molecular species
involved in the network was calculated as:
∆𝐻𝑝ℎ𝑦𝑠 = 𝑐 ∙ (3.0 ∙ 𝑛𝑆 + 5.6 ∙ 𝑛𝐷)
(18)
with 𝑐 = 0.6 and where 𝑛𝑆 and 𝑛𝐷 represent, respectively, the number of single-bonded
and double-bonded carbon atoms.
𝑍𝑒𝑂 ― + 𝐻 + + 𝑅(𝑔)
∆𝑞(𝐻 + )
𝑍𝑒𝑂 ―
+
+
𝑅(𝑔)
𝑃𝐴
𝑍𝑒𝑂𝐻 + 𝑅(𝑔)
∆𝐻𝑝ℎ𝑦𝑠
∆𝐻𝑐ℎ𝑒𝑚
∆𝑞(𝑅 + )
physisorbed complex
∆𝐻𝑝𝑟𝑜𝑡
chemisorbed complex
ACS Paragon Plus Environment
17
ACS Catalysis
1
2
3
4
5
6
7
8
9
10
11
12
13
14
15
16
17
18
19
20
21
22
23
24
25
26
27
28
29
30
31
32
33
34
35
36
37
38
39
40
41
42
43
44
45
46
47
48
49
50
51
52
53
54
55
56
57
58
59
60
Page 18 of 68
Figure 1. Energy levels used for the estimation of the stabilization energy of the ionic
intermediates. Adapted from [29]. R in the diagram denotes an olefin.
For calculation convenience, we introduced a quantity defined as the stabilization
enthalpy of a protonated species relative to the deprotonation enthalpy of the zeolite (∆𝑞
(𝐻 + ) = 295 kcal·mol-1 [39]), defined as:
Δ∆𝑞(𝑅 + ) = ∆𝑞(𝐻 + ) ― ∆𝑞(𝑅 + )
(19)
According to the enthalpy diagram depicted in Figure 1, the stabilization enthalpy of the
ionic intermediate 𝑅 + can be expressed as:
∆𝑞(𝑅 + ) = ― (∆𝐻𝑐ℎ𝑒𝑚 ― ∆𝑞(𝐻 + ) + 𝑃𝐴)
(20)
where ∆𝐻𝑐ℎ𝑒𝑚 is the chemisorption enthalpy of a gas-phase olefin and 𝑃𝐴 is its proton
affinity. As reported in [36], physisorption and chemisorption enthalpies can be
considered equal to the corresponding electronic energies in the temperature range 300-
800 K. The relative stabilization enthalpy results in the expression in Eq. 21 accordingly:
Δ∆𝑞(𝑅 + ) = ∆𝐻𝑐ℎ𝑒𝑚 + 𝑃𝐴
(21)
The chemisorption enthalpies and the proton affinities of the olefins from 𝐶2 to 𝐶9,
together with the calculated relative stabilization enthalpies for the corresponding
alkoxides or carbenium ions on H-ZSM-5, are listed in Table 3.
ACS Paragon Plus Environment
18
Page 19 of 68
1
2
3
4
5
6
7
8
9
10
11
12
13
14
15
16
17
18
19
20
21
22
23
24
25
26
27
28
29
30
31
32
33
34
35
36
37
38
39
40
41
42
43
44
45
46
47
48
49
50
51
52
53
54
55
56
57
58
59
60
ACS Catalysis
The chemisorption enthalpy of 1-nonene was estimated by extending the linear trend
reported for olefins from 𝐶2 to 𝐶9 in [36]. The increasing trend of the proton affinity with
the size of the olefin is rationalized by the electron-donating effect of the alkyl chain to
stabilize the positive charge of the donated proton. However, this electron-donating
effect tends to become attenuated once the alkyl chain of the olefin becomes sufficiently
long, as demonstrated by the 𝑃𝐴 values for olefins between 𝐶3 and 𝐶8 in Table 3. For this
reason, the proton affinity of 1-nonene was set equal to that of 1-octene.
Table 3.
Chemisorption enthalpies and proton affinities of 𝐶2 to 𝐶9 olefins and relative
stabilization enthalpies of the corresponding alkoxide or carbenium ion on H-ZSM-5.
species
primary
π-complex → σ-
∆𝐻𝑐ℎ𝑒𝑚
complex
[kcal/mol]
Ref
𝑃𝐴
Ref
[kcal/mol]
Δ∆𝑞(𝑅 + )
[kcal/mol]
ethene → ethoxy
– 31.1
[36]
168.4
[40]
137.3
propene → propoxy
– 33.7
[36]
179.5
[41]
145.8
1-butene → 1-butoxy
–35.1
[36]
184.7
[40]
149.6
–37.3
[36]
188.1
[40]
150.8
secondary
1-pentene → 1pentoxy
ACS Paragon Plus Environment
19
ACS Catalysis
1
2
3
4
5
6
7
8
9
10
11
12
13
14
15
16
17
18
19
20
21
22
23
24
25
26
27
28
29
30
31
32
33
34
35
36
37
38
39
40
41
42
43
44
45
46
47
48
49
50
51
52
53
54
55
56
57
58
59
60
1-hexene → 1-hexoxy
Page 20 of 68
–37.0
[36]
192.4
[41]
155.4
–37.8
[36]
-
-
-
1-octene → 1-octoxy
–39.9
[36]
191.0
[40]
151.1
1-nonene → 1-nonoxy
–40.6
Estimated
191.0
Estimated
150.4
isobutene → t-butyl
– 17.2
[29]
195.3
[40]
178.1
1-heptene → 1heptoxy
tertiary
The relative stabilization enthalpy of an ionic intermediate depends on the energy level
of the protonated species in the gas phase. Thus, it was expressed as a function of the
nature of the ionic intermediate and its carbon number using a polynomial expression:
Δ∆𝑞(𝑅 + ) = ∆𝐻𝑡𝑦𝑝𝑒 + 𝑎 ∙ 𝑛𝐶 + 𝑏 ∙ 𝑛2𝐶
(22)
where ∆𝐻𝑡𝑦𝑝𝑒 represents the large contribution of the ionic species type (primary,
secondary or tertiary) to the relative stabilization enthalpy, and 𝑛𝐶 is the carbon number
of the ionic intermediate. The much smaller contribution 𝑎 ∙ 𝑛𝐶 + 𝑏 ∙ 𝑛2𝐶 to the species’
stability accounts for the stabilization effect of the alkyl chain on the distribution of the
positive charge [32]. The parameters a, b and ∆𝐻𝑠𝑒𝑐 were estimated by fitting the data
ACS Paragon Plus Environment
20
Page 21 of 68
1
2
3
4
5
6
7
8
9
10
11
12
13
14
15
16
17
18
19
20
21
22
23
24
25
26
27
28
29
30
31
32
33
34
35
36
37
38
39
40
41
42
43
44
45
46
47
48
49
50
51
52
53
54
55
56
57
58
59
60
ACS Catalysis
presented in Table 3 for secondary species with Eq. (22). The resulting equation was
scaled to match the relative stabilization energies of primary and tertiary species, by
estimating ∆𝐻𝑝𝑟𝑖𝑚 and ∆𝐻𝑡𝑒𝑟𝑡. The result of the described fitting procedure is shown in
Fig. 2 with the parameters listed in Table 4.
It is worth noting that the polynomial expression (Eq. 22) was specifically referred to the
range of carbon number 3 ≤ 𝑛𝐶 ≤ 9. The trend of the relative stabilization enthalpy of
heavier oligomers would be linear with a negative slope dictated by the chemisorption
enthalpy change. For this reason, in the event that oligomers with higher carbon number
should be included in the model, the following expression is recommended to fit the
data:
∆𝐻𝑡𝑦𝑝𝑒
+ 𝑎1 ∙ 𝑛𝐶 + 𝑏1 ∙ 𝑛2𝐶
1
Δ∆𝑞(𝑅 ) =
∆𝐻𝑡𝑦𝑝𝑒
+ 𝑎2 ∙ 𝑛𝐶
2
+
{
𝑖𝑓 3 ≤ 𝑛𝐶 ≤ 9
𝑖𝑓 𝑛𝐶 > 9
(23)
ACS Paragon Plus Environment
21
ACS Catalysis
Table 4. Parameters estimated by fitting the relative stabilization enthalpies listed in Table 3
with Eq. (22).
Parameter
Value
[–]
𝑎
8.4
-
𝑏
– 0.6
-
122.7
kcal/mol
126.4
kcal/mol
154.7
kcal/mol
∆𝐻𝑝𝑟𝑖𝑚
∆𝐻𝑠𝑒𝑐
∆𝐻𝑡𝑒𝑟𝑡
190
180
170
q [kcal (mol)-1]
1
2
3
4
5
6
7
8
9
10
11
12
13
14
15
16
17
18
19
20
21
22
23
24
25
26
27
28
29
30
31
32
33
34
35
36
37
38
39
40
41
42
43
44
45
46
47
48
49
50
51
52
53
54
55
56
57
58
59
60
Page 22 of 68
160
150
140
130
120
Primary
Secondary
Tertiary
110
100
0
2
4
6
Carbon Number
8
10
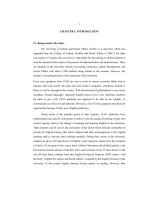
Figure 2. Relative stabilization enthalpies for primary, secondary and tertiary ionic intermediates
as a function of the carbon number in the range 3 ≤ 𝑛𝐶 ≤ 9. The dashed lines are regression
lines to fit the relative stabilization enthalpies listed in Table 3 using Eq. (22).
ACS Paragon Plus Environment
22
Page 23 of 68
1
2
3
4
5
6
7
8
9
10
11
12
13
14
15
16
17
18
19
20
21
22
23
24
25
26
27
28
29
30
31
32
33
34
35
36
37
38
39
40
41
42
43
44
45
46
47
48
49
50
51
52
53
54
55
56
57
58
59
60
ACS Catalysis
3.2 Activation energies. According to the Evans-Polanyi relationship, the activation
energies were expressed as linear functions of the enthalpy changes associated with the
chemical transformations:
𝐸𝑎 = 𝐸0 + α∆𝐻𝑅
for ∆𝐻𝑅 ≤ 0
𝐸𝑎 = 𝐸0 + (1 ― 𝛼)∆𝐻𝑅
for ∆𝐻𝑅 > 0
(24)
where 𝐸0 is the intrinsic energy barrier and 𝛥𝐻𝑅 is the enthalpy of reaction. α is the
transfer coefficient (0 ≤ 𝛼 ≤ 1) that characterizes the position of the transition state along
the reaction coordinate, such that more exothermic reactions have earlier transition
states (𝛼 closer to 0) and more endothermic reactions have later transition states (𝛼
closer to 1).
For endothermic reactions, the value of 𝐸𝑎 was automatically set equal to the enthalpy
of reaction, in the event that Eq. (24) predicted a value lower than the enthalpy of
reaction itself. For exothermic reactions, the value of 𝐸𝑎 was set equal to zero, in cases
where Eq. (24) predicted a negative value for the activation energy. For thermodynamic
consistency, the same value of the energy barrier 𝐸0 was selected for the forward and
reverse reaction families (e.g. protonation/deprotonation or oligomerization/β-scission)
such that:
ACS Paragon Plus Environment
23
ACS Catalysis
1
2
3
4
5
6
7
8
9
10
11
12
13
14
15
16
17
18
19
20
21
22
23
24
25
26
27
28
29
30
31
32
33
34
35
36
37
38
39
40
41
42
43
44
45
46
47
48
49
50
51
52
53
54
55
56
57
58
59
60
Page 24 of 68
(25
𝐸𝑎, 𝑓𝑜𝑟𝑤𝑎𝑟𝑑 ― 𝐸𝑎, 𝑟𝑒𝑣𝑒𝑟𝑠𝑒 = ∆𝐻𝑅
)
The values of the transfer coefficient 𝛼 were fixed according to the typical reaction
enthalpies of the elementary steps included in each reaction family. Values of 0.1 and
0.3 were selected, respectively, for oligomerization and protonation according to the
general expectation for highly and moderately exothermic elementary steps [32]. A value
of 0.5, which is consistent with a symmetric transition state that has both reactant and
product character, was assigned to the isomerization steps [42].
The intrinsic energy barrier for protonation/deprotonation was distinguished depending
on whether the protonated species was an alkoxide (primary or secondary ionic
intermediate) or a carbenium ion (tertiary ionic intermediate), to match the experimental
observation reported in the literature for isobutene protonation [29], such that:
𝐸0, 𝑐𝑎𝑟𝑏𝑒𝑛𝑖𝑢𝑚
𝐸0, 𝑎𝑙𝑘𝑜𝑥𝑖𝑑𝑒
(26
= 0.3
)
ACS Paragon Plus Environment
24