Báo cáo y học: " A topological model of biofeedback based on catecholamine interactions" pptx
Bạn đang xem bản rút gọn của tài liệu. Xem và tải ngay bản đầy đủ của tài liệu tại đây (1.18 MB, 10 trang )
BioMed Central
Page 1 of 10
(page number not for citation purposes)
Theoretical Biology and Medical
Modelling
Open Access
Research
A topological model of biofeedback based on catecholamine
interactions
Tapas K Basak*, Suman Halder, Madona Kumar, Renu Sharma and
Bijoylaxmi Midya
Address: Department of Electrical Engineering, Jadavpur University, Kolkata-700032, India
Email: Tapas K Basak* - ; Suman Halder - ;
Madona Kumar - ; Renu Sharma - ; Bijoylaxmi Midya -
* Corresponding author
BiofeedbackTransduction PhaseCatecholaminePsychosomatic DiseaseActivation of smooth muscles
Abstract
Background: The present paper describes a topological model of biofeedback. This model
incorporates input from a sensory organ and a transduction phase mediated through catecholamine
production in the feedback path. The transduction phase comprises both conservative and
dissipative systems, from which the appropriate output is combined in a closed loop.
Results: The model has been simulated in MATLAB 6.0 R12 in order to facilitate a comprehensive
understanding of the complex biofeedback phenomena concomitant with the transduction phases
associated with migraine and with psychosomatic diseases involving digestive disorders.
Conclusion: The complexity of the biological system influences the transduction phase and nature
of the system response, which is consequent on the activation of smooth muscles by sympathetic
and parasympathetic stimulation.
Background
The paper describes a comprehensive model of a biofeed-
back system; it adopts a new approach to modeling. Using
artificial neural networks (ANN) it is not easy to obtain a
dynamic response that reflects dependence on hormone
production. Therefore, the authors have endeavoured to
design an approach that focuses on the internal state of
the subject consequent on biofeedback stimulation.
A biofeedback system involves a sensory organ and an
appropriate stimulus. The stimulus is mediated through
organs derived from specific biosensors [2-8]. If a subject
has disorders involving parenchymal lesions, his or her
internal state is likely to indicate exhaustion, as evident
from output responses in a conservative system (see
below). Thus, it is or may be possible to establish the
internal state of the subject from the output responses.
The model described in this paper has been developed pri-
marily with a focus on the galvanic skin response (GSR) in
biofeedback [9]; galvanic skin response training is also
known as the electrodermal response (EDR). The device
measures electrical conductance in the skin, which is asso-
ciated with the activity of the sweat glands [9,10]. Sweat
gland activity is due to catecholamine secretion resulting
from the stimulation of adrenergic receptors (discussed
later). The GSR in a biofeedback system is caused by a
Published: 21 March 2005
Theoretical Biology and Medical Modelling 2005, 2:11 doi:10.1186/1742-4682-2-11
Received: 21 October 2004
Accepted: 21 March 2005
This article is available from: />© 2005 Basak et al; licensee BioMed Central Ltd.
This is an Open Access article distributed under the terms of the Creative Commons Attribution License ( />),
which permits unrestricted use, distribution, and reproduction in any medium, provided the original work is properly cited.
Theoretical Biology and Medical Modelling 2005, 2:11 />Page 2 of 10
(page number not for citation purposes)
stimulus that activates the sweat glands. This activation
can be indicated by recording bio-potentials by placing
the electrodes on the body surface. The instrumentation
for recording consists of a set of amplifiers and filters
designed for the purpose [9,10] (Fig. 1).
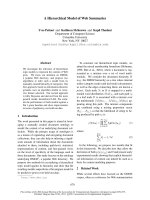
If T
1
is the duration of the rising phase, T
2
is the duration
of the decaying phase and ∆V is the residual homeostatic
output level, the result from Fig. 1 is tabulated below
(Table 1).
Before we focus on the design of the biofeedback system,
some important terminology needs to be discussed: Topo-
logical model, Transduction Phase, Unity biofeedback, Home-
ostasis, Homeostat, Residual Homeostatic output level,
Feedback Control systems, Catecholamine Interactions, Con-
scious and subconscious parts of the brain and Dissipative &
Conservative system.
A topological model originates from a root and spreads in
tree-like branches. It affords a complete description of the
interactions among the different parts of the system con-
sidered. The transduction phase of a subject reflects physio-
logical changes caused by hormone release consequent on
stimulation. This phase is characteristic of an individual
subject [2-7]. For example, the transduction phase of a
psychosomatic patient is sometimes reflected during a
journey in a high-speed vehicle, when the physiological
outcome can adversely affect his mental condition, associ-
ated with headache and vomiting.
Unity biofeedback means that the homeostatic output is
directly fed to the brain without going through the trans-
duction phase, which incorporates conservative and dissi-
pative systems. Homeostasis is the set of processes by which
constant or 'static' conditions are maintained within the
internal environment of a subject [6,7,11]; a homeostat is a
controller involved in maintaining homeostasis.
In this paper the residual homeostatic output level, ∆V, has a
particular value for each successive response. It can be cor-
related with the GSR [9]. The residual homeostatic output
arises as a result of sustained catecholamine action, which
often persists for minutes or hours; control is prolonged,
not just instantaneous activation or inhibition [11]. The
residual homeostatic output indicated by the GSR
response signifies that sweating persists even after the
withdrawal of the biofeedback stimulus [9].
Mammals are endowed with a vast network of feedback
control systems with controllers (homeostats) without
which survival would be difficult [11]. In this control sys-
tem a particular neuro-hormone exerts a negative feed-
back effect, preventing over-secretion of other hormones
associated with over-activity of the muscles, unless there is
specific disorder in the system [11].
Catecholamine interactions are very important in biofeed-
back systems. Catecholamines are excitatory or inhibitory
neurotransmitters or hormonal agents. The catecho-
lamine neuro-hormones are epinephrine, norepinephrine,
dopamine and serotonin. Epinephrine and norepinephrine
function as excitatory hormones. Serotonin functions as
an inhibitory hormone, and dopamine is excitatory in
some areas and inhibitory in others. Stimulation of sym-
pathetic nerves in the adrenal medullae causes large quan-
tities of epinephrine and norepinephrine to be released
into the circulating blood, which carries them to all tissues
of the body. Norepinephrine increases the total peripheral
resistance and thus elevates the arterial pressure; epine-
phrine raises the arterial pressure to lesser extent but
increases the cardiac output more. Epinephrine has a 5 to
10 times greater metabolic effect than norepinephrine
[11].
The adrenergic receptors include α and β receptors. The α-
receptors control such physiological activities as vasocon-
striction, iris dilatation, intestinal relaxation, intestinal
sphincter contraction, pilomotor contraction and bladder
sphincter contraction; β-receptors control (e.g.) vasodila-
tation, cardio-acceleration, increased myocardial strength,
intestinal relaxation, uterus relaxation, bronchodilata-
tion, calorigenesis, glycogenesis, lipolysis and bladder
Generalized Galvanic Skin ResponseFigure 1
Generalized Galvanic Skin Response.
Table 1: Records of the measurements of the SCR
Measure Measured
value
Measure Measured
value
Per unit
value
SCR latency 3s Peak
response
84.5 mV 1 p.u.
SCR rise
time
9.69s Amplitude 25.5mV 0.3 p.u.
Half
recovery
time
8.75s
Theoretical Biology and Medical Modelling 2005, 2:11 />Page 3 of 10
(page number not for citation purposes)
wall relaxation. It is therefore evident that both α and β
receptors have inhibitory and excitatory functions [11].
Blood pressure transduction phases are associated with
activation of α and β receptors [4-6].
The cerebral cortex, which includes the conscious part of
the brain, never functions alone but always in association
with lower centres of the nervous system. In fact, the lower
brain centres (or subconscious part of the brain) initiate
wakefulness in the cerebral cortex [11]. The subconscious
part of the brain performs vegetative functions; notably,
the hypothalamus controls sympathetic and parasympa-
thetic stimulation [11]. The sweat glands secrete large
quantities of sweat when the sympathetic nerves are stim-
ulated; they are controlled primarily by centers in hypoth-
alamus that are usually considered to be parasympathetic
centers [11]. Therefore, sweating could be called a para-
sympathetic function, although it is controlled by nerve
fibres that are anatomically distributed through the sym-
pathetic nervous system [11]. The sympathetic innerva-
tion of sweat glands results from a developmental change
in transmitter phenotype (from catecholaminergic to
cholinergic), making parasympathetic stimulation also
possible [13].
In biofeedback systems, the subject undergoes different
transduction phases. Depending on the nature of trans-
duction phase a system can be classified as dissipative or
conservative. A dissipative system diverges from its original
state during biofeedback; it may undergo successive stages
during which the response decreases exponentially, with
the characteristic features of a normal physiological sys-
tem. A conservative system, in contrast, has an output
characterised by exponentially rising phases due to sus-
tained levels of catecholamines.
Nowadays, biofeedback has important clinical applica-
tions in at least the following areas. Headache is a psycho-
physiological disorder associated with disturbances in the
homeostatic relationship between mind and body. The
classical psychosomatic disorders are included in this cat-
egory, e.g. peptic ulcer, bronchial asthma, migraine and
essential hypertension.[12] In classical migraine (in
which the sufferer is sensitive to light and sound stimuli)
there are neurological symptoms such as homonymous
hemianopia, paresthesias, aphasia and hemiparesis,
which precede the unilateral headache (tension head-
ache) and are reflected in the subject's muscle activity
[12]. Biofeedback is useful for migraine treatment. Stimu-
lation or inhibition of specific adrenergic receptors, medi-
ated through catecholamines, often help relieve the pain,
inducing a feeling of drowsiness by a process associated
with the smelling of ripe mango or fresh lemon [4].
The digestive system as a whole is governed by innumera-
ble control mechanisms at the cell and tissue levels,
whereby a pathway can be activated as needed or inhib-
ited as products accumulate [12]. For example, acetylcho-
line is an excitatory cholinergic transmitter for smooth
muscle fibers in some organs, but an inhibitory transmit-
ter for smooth muscle in others. When acetylcholine
excites a muscle fiber, norepinephrine ordinarily inhibits
it. Conversely, when acetylcholine inhibits a fiber, nore-
pinephrine usually excites it [11]. Cholinergic (mus-
carinic) receptors are involved in the parasympathetic
activity. Muscarinic receptors are age dependent; their fre-
quency decreases with increasing age. Moreover, the fall of
blood pressure and pulse rate during parasympathetic
stimulation (discussed later) is due to the combined
effects of adrenergic and muscarinic receptors [14].
Adrenergic and cholinergic receptors in the autonomic
nervous system play opposite roles. De-activation of the
sympathetic innervation (which operates via adrenergic
receptors) is followed by enhancement of the cholinergic
receptors involved in parasympathetic stimulation in
smooth muscle. Conversely, noradrenergic enhancement
is diminished as cholinergic neurotransmission becomes
established [14].
In the model discussed in this paper, the stimulation of
adrenergic receptors diminishes concomitantly with
blood pressure and pulse-rate (a dissipative system). This
diminishing of the adrenergic receptor effect enhances
cholinergic receptor activity automatically in the control
of smooth muscle function. Similarly, in a conservative
system, adrenergic receptor stimulation is enhanced con-
comitantly with the blood pressure and the pulse rate.
This increasing effect of the adrenergic receptors will
diminish the effects of cholinergic receptors automatically
in the control of smooth muscle activity. Thus, cholinergic
receptors automatically operate in conjunction with
adrenergic receptors in the autonomic nervous system
control of mammalian smooth muscle.
The following extended account of the model focuses on
the state of the subject (dissipative or conservative).
Biofeedback can be fatal due to cardiac failure for subjects
in an exhausted state, unless attention is given.
In the paper, emphasis is placed on catecholamine stimu-
lation and a temporal pattern of responses is obtained. It
has been established that catecholamine secretion is not
only of short duration but also persists for long periods
(minutes or even hours) [11]. To take account of this, the
authors have designed 1
st
order and 2
nd
order systems. In
the 1
st
order system the response decays without oscilla-
tion during a short catecholamine secretion phase,
whereas the 2
nd
order system represents a prolonged
Theoretical Biology and Medical Modelling 2005, 2:11 />Page 4 of 10
(page number not for citation purposes)
period marked with oscillation, concomitant with adren-
ergic stimulation leading to vasoconstriction and
vasodilatation.
A comprehensive biofeedback model consists of a brain,
homeostat and transduction phase (Fig.2). The sensory
organs are responsible for biofeedback stimulation. Bio-
feedback stimulates the nervous system concomitantly
with homeostatic regulation of the body through hormo-
nal activation. The role of the brain is central, adjusting
the system in accordance with the biofeedback stimulus
received from the sensory organ. Without the brain there
would be no output response. Biofeedback stimulates the
subconscious part of the brain, and depends upon the
nature of stimulus received from the sensory organ in the
subject's particular current environment. Both the con-
scious and subconscious parts of the brain are important
in biofeedback. Dreams during sleep are sometimes
responsible for locomotor action evoked through stimula-
tion of subconscious parts of the brain.
Here, input stimulus to the biofeedback system is a step
function while the homeostatic output response is expo-
nential. The input stimulus may be optical (e.g. flash of
light), auditory (e.g. tone), tactile (e.g. a blow to the Achil-
les tendon), or a direct electrical stimulation of some part
of the nervous system.[8] Any sinusoidal or ramp input
can be simplified by expressing it as a function of step
inputs. For this reason the input is taken as a step. In this
particular model, the output responses are of two types:
exponential rise and exponential decay. Exponential rise
signifies that the system is unable to withstand the bio-
feedback stimulus, depending on the responses of home-
ostat. Exponential decay signifies a normal homeostatic
response. The homeostatic responses are regulated mainly
by the functioning of the kidney and heart in tandem.
A complex biofeedback output with multiple responses is
shown in Fig. 3. ∆V is the residual homeostatic output
level. In practice, subsequent biofeedback output
responses occur, as shown. The residual homeostatic out-
put level at each stage can sometimes exceed the corre-
sponding value in the previous stage, depending on
homeostatic responses.
A generalised GSR model was chosen.[9] For a step input,
the body's biofeedback output response is identical to that
illustrated in Fig 1. The GSR output was simulated using
MATLAB 6.0. Different time constants for the rising and
decaying phases were considered for simulation within a
fixed interval. Simulation in this model was facilitated by
the use of SIMULINK. Knowing that the input is a step and
the output exponential, the entire transfer function of the
system could be represented by the respective blocks (Fig.
4). K
1
and K
2
are the inverse time constants for the rising
and decaying phases of the biofeedback output respec-
tively; a
1
is the peak value of the of the biofeedback output
response.
Biofeedback CircuitFigure 2
Biofeedback Circuit.
A biofeedback output with multiple responsesFigure 3
A biofeedback output with multiple responses.
Block diagram representation of biofeedback output with sin-gle responseFigure 4
Block diagram representation of biofeedback output with sin-
gle response.
Theoretical Biology and Medical Modelling 2005, 2:11 />Page 5 of 10
(page number not for citation purposes)
Methods and Results
The p.u. (per unit) scale values signify normalisation of
the curve to correlate a particular physiological phenome-
non such as GSR. Qualitatively similar physiological
responses can be fitted by a single curve, irrespective of
amplitude, if per unit values are chosen. From Figs. 5, 6, 7
we see that GSRs, qualitatively identical but of different
amplitudes, are fitted by the single curve (Fig. 7).
In this model (Fig. 8) the output is a single response. The
values of K
1
and K
2
are taken as 0.2 and 0.3 and the time
periods for the rising and decaying phases are taken as 5s,
to correlate with the characteristic GSR response in bio-
feedback [9].
From Fig. 8 the residual homeostatic output level, ∆V, is
calculated as 0.142 p.u. Now by keeping K
2
fixed we can
change the value of K
1
and observe changes in the value of
the residual homeostatic output. For i) K
1
= 0.2, ∆V =
0.1418 p.u; ii) K
1
= 0.25, ∆V = 0.142 p.u; and iii) K
1
= 0.15,
∆V = 0.1422 p.u. We can conclude that the residual home-
ostatic output level does not depend on the time constant
of the rising phase of the biofeedback output response. In
a real biofeedback system (in this case GSR), there may be
more than one response. In that case the entire transfer
function can be represented by a block diagram (Fig. 9).
Galvanic skin response of a subject of a particular ageFigure 5
Galvanic skin response of a subject of a particular age.
Galvanic skin response of another subject of the same ageFigure 6
Galvanic skin response of another subject of the same age.
Fitting (per unit values) of data in Fig 5 and Fig 6Figure 7
Fitting (per unit values) of data in Fig 5 and Fig 6.
Biofeedback output with single responseFigure 8
Biofeedback output with single response.
Block diagram representation of biofeedback output with multiple responseFigure 9
Block diagram representation of biofeedback output with
multiple response.
Response vs. Time (Case-1)Figure 10
Response vs. Time (Case-1).
Theoretical Biology and Medical Modelling 2005, 2:11 />Page 6 of 10
(page number not for citation purposes)
In respect of the homeostatic output level in GSR, the con-
stants a
1,
a
2,
a
3
relate to the peak value; a
2
, a
4
represent
residual output level. K
1
, K
3
, K
5
respectively indicate the
slopes, i.e. the inverses of the respective time constants of
the successive rising phases of the GSR; and K
2
, K
4
, K
6
respectively represent the inverses of the e time constants
of the successive decaying phases. These constants are
selected so as to represent the GSR attributable to activa-
tion of sweat glands concomitant with stimulation
through catecholamine [9,13]. The hormonal stimulation
helps elicit physiological responses that obey an exponen-
tial law with rising and decaying phases.
Case-1
In the case of biofeedback with multiple responses, the K
1
and K
2
values for successive responses are taken as 0.2 and
0.3 respectively and K
3
, K
5
and K
4
, K
6
have values identical
to K
1
and K
2
(Fig. 10). The time periods for the rising and
decaying phases of successive responses are matched sep-
arately with the characteristic curve of the GSR response.
From Fig. 10 we observe that ∆V increases in successive
responses.
Case-2
Here (Fig. 11) K
1
= 0.2 and K
2
= 0.3; K
3
= 0.1, K
4
= 0.09; K
5
= 0.3, K
6
= 0.5; and the time periods of the 2
nd
and 3
rd
responses are taken to be half of the 1
st
response.
Case3
Here (Fig. 12) K
1
= 0.2, K
2
= 0.3, K
3
= 0.05, K
4
= 0.03, K
5
=
0.02, K
6
= 0.01; again, the time periods of the 2
nd
and 3
rd
responses are taken to be half of the first response.
In all these cases we see that the residual homeostatic out-
put level increases for each successive response [9].
With unity biofeedback the closed loop biofeedback
transfer function is given by H(S) = G(S)/(1+G(S)), where
G(S) is the open loop transfer function and the biofeed-
back output is given by Fig. 13. Now the whole system can
be shown by a block diagram representation in Fig. 14.
Here the unit feedback control system is converted into an
open loop control system, where the closed loop transfer
function becomes an open loop transfer function. We next
studied the output response when the transduction phase
was incorporated into the feedback loop of the biofeed-
back system. The result can again be shown by a block dia-
gram (Fig. 15). In the first order transduction phase, the
constant 'a' represents exponential rise or decay during the
phase of catecholamine activation [4-6].
The transduction phase can be either conservative or dis-
sipative. Depending on the nature of the transduction
phases, the biofeedback output of a closed loop model as
Response vs. Time (Case-2)Figure 11
Response vs. Time (Case-2).
Response vs. Time (Case-3)Figure 12
Response vs. Time (Case-3).
Biofeedback outputFigure 13
Biofeedback output.
Block diagram representation of closed loop transfer func-tion with unit feedbackFigure 14
Block diagram representation of closed loop transfer func-
tion with unit feedback.
Theoretical Biology and Medical Modelling 2005, 2:11 />Page 7 of 10
(page number not for citation purposes)
shown in Fig. 16 will typically show the relevant charac-
teristic responses. The expression for dissipative and con-
servative systems due to incorporation of the transduction
phase is:
Tp(Φ
d
) = Φ
d0
± ∂(ψ
d
)/∂t and Tp(Φc) = Φc
0
± ∫(ψ
c
)dt
where Φ
d0
and Φc
0
are the initial states of the dissipative
and conservative system respectively, ψ
d
is the time
dependent 1
st
order dissipative system and ψ
c
is the time
dependent 1
st
order conservative system. Here, the trans-
duction phase signifies the state of the internal environ-
ment of the subject [11]. It reflects the topological
asymmetry of cellular organization, which shows a relax-
ation jump associated with hydrophobic linkages among
polar heads [1].
Depending on the state of the subject, homeostasis is per-
turbed in a conservative system. This is the first order sys-
tem transduction phase where the value of a is taken as 2
and the output appears as
Case-I
Here peak amplitude = 0.101 p.u and settling time = 17 s
From Fig.16 we see that the exponentially decaying output
phase indicates that the subject returns to the original
state within a time frame depending on the duration of
the catecholamine signal. When the 2nd order transduc-
tion phase is incorporated into the biofeedback loop, the
block diagram representation of the system is shown
below.
To represent the 2
nd
order transduction phase, the con-
stants 'a' and 'b' are selected so that there will be simulta-
neous exponential rise and decay (Fig. 17). This is shown
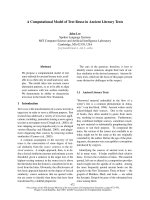
in Fig. 18, which illustrates the catecholamine activation
phase for a normal subject (dissipative system)
[4,5,11,13]. Fig. 18 represents the transduction of blood
flow mediated by catecholamine.
Assuming a = 1, b = 1 we can have the system response in
Fig. 19.
Case-II
Here peak amplitude = 0.129 p.u and settling time = 19 s.
Fig. 18 illustrates the fluctuations of parameters such as
blood pressure and pulse rate, which persist for a certain
period of time concomitant with the sustained
catecholamine signal.
Keeping the value of b fixed at 1 and by putting a = 0.5 we
obtain the output response shown in Fig. 19.
Case-III
Here (Fig. 20) peak amplitude = 0.158 p.u and settling
time = 18.3 s
Block diagram representation of system incorporating 1
st
order transduction phaseFigure 15
Block diagram representation of system incorporating 1
st
order transduction phase.
The biofeedback output response when the 1st order trans-duction phase is incorporated in the feedback loopFigure 16
The biofeedback output response when the 1st order trans-
duction phase is incorporated in the feedback loop.
The block diagram representation when the 2
nd
order trans-duction phase is incorporated in the feedback loopFigure 17
The block diagram representation when the 2
nd
order trans-
duction phase is incorporated in the feedback loop.
Theoretical Biology and Medical Modelling 2005, 2:11 />Page 8 of 10
(page number not for citation purposes)
Case-IV
Here (Fig. 21) peak amplitude = 0.171 p.u and settling
time = 30.2 s
Case-V
Here (Fig. 22) peak amplitude = 0.181 p.u. and settling
time = 99.2 s
Figs. 19, 20, 21, 22 model states with different values of
'a'. With decreasing 'a' values, the settling time increases
with the increase of oscillations. This is true for a subject
with sustained biofeedback.
Case-VI
Peak amplitude = 2.41 p.u and damping freq =
0.002463Hz (Fig. 23).
Case-VII
Here peak amplitude = 1.76 p.u and damped frequency =
1/(126-40.7) = 1/85.3 = 0.01172Hz (Fig. 24).
Figs. 23, 24 represent a subject with a permanent disorder;
the biofeedback stimuli cause the disorder to be manifest.
By putting a = 0 we can have the output response. Here we
clearly see that sustained oscillations amplify in a
Effect of sympathectomy on blood flow in the arm and the effect of a test dose of norepinephrine before and after sym-pathectomy (lasting only 1 minute or so), showing supersensi-tization of the vasculature to norepinephrineFigure 18
Effect of sympathectomy on blood flow in the arm and the
effect of a test dose of norepinephrine before and after sym-
pathectomy (lasting only 1 minute or so), showing supersensi-
tization of the vasculature to norepinephrine.
Biofeedback output response when 2
nd
order transduction phase is incorporated in the feedback loopFigure 19
Biofeedback output response when 2
nd
order transduction
phase is incorporated in the feedback loop.
Response amplitude vs Time (a = 0.5)Figure 20
Response amplitude vs Time (a = 0.5).
Response amplitude vs Time (a = 0.3)Figure 21
Response amplitude vs Time (a = 0.3).
Theoretical Biology and Medical Modelling 2005, 2:11 />Page 9 of 10
(page number not for citation purposes)
conservative transduction phase due to the prolonged
period of catecholamine activation.
Conclusion
The features of both dissipative and conservative systems
are represented in this comprehensive model, which is
based on catecholamine activation. The transduction
phase of the 2
nd
order system in biofeedback can act as
either a dissipative or a conservative system depending on
the system dissipation factor (which is related to
catecholamine production). For a dissipative system the
catecholamine signal is of shorter duration, whereas for a
conservative system it survives for a longer period. Bio-
feedback can sometimes produce complex responses in
biological systems depending on how sustained the cate-
cholamine signal is; these complexities are represented by
the present model. In the context of this paper, the enve-
lopes of the exponentially rising and decaying phases also
represent the stimulation of adrenergic receptors in
monotonic phase concomitant with the catecholamine
production. Adrenergic and cholinergic receptors have
opposing roles in the autonomic nervous system. Down-
regulation of sympathetic innervation via adrenergic
receptor is followed by enhancement of the cholinergic
receptors involved in parasympathetic stimulation in
smooth muscle. Conversely, noradrenergic enhancement
is diminished as cholinergic neurotransmission becomes
established. Thus it may be concluded that cholinergic
receptors automatically participate, along with adrenergic
receptors, in the autonomic nervous system control of
mammalian smooth muscle function.
In this paper a new conceptual approach has been taken
to modeling dynamic responses in biofeedback that
depend on hormone activity, by introducing homeostats
and transduction phases in the feedback path.
Competing Interests
As head of the Department of Electrical Engineering,
Jadavpur University, Professor Basak requested the
University authorities to obtain membership of http://
www.biomedical-engineering-online.com and the univer-
sity has given due consideration to this request.
Authors' contributions
Professor T. K. Basak received a third world scientist award
from ICTP, Trieste, Italy and worked with Professor A.
Glilozzi in the Dept of Biophysics, University of Genoa,
Italy in 1985. He furnished the innovative idea in the
present paper and provided comprehensive guidance to
Response amplitude vs Time (a = 0.1)Figure 22
Response amplitude vs Time (a = 0.1).
Response amplitude vs Time (a = 0.015)Figure 23
Response amplitude vs Time (a = 0.015).
Response vs Time (when damping is absent, i.e. a = 0)Figure 24
Response vs Time (when damping is absent, i.e. a = 0).
Publish with BioMed Central and every
scientist can read your work free of charge
"BioMed Central will be the most significant development for
disseminating the results of biomedical research in our lifetime."
Sir Paul Nurse, Cancer Research UK
Your research papers will be:
available free of charge to the entire biomedical community
peer reviewed and published immediately upon acceptance
cited in PubMed and archived on PubMed Central
yours — you keep the copyright
Submit your manuscript here:
/>BioMedcentral
Theoretical Biology and Medical Modelling 2005, 2:11 />Page 10 of 10
(page number not for citation purposes)
the team from the outset. After completing his Masters
degree in electrical engineering under the supervision of
Professor Basak, Mr. Suman Halder began Ph.D. work
under the same supervisor and was involved with the
work until the completion of the paper. Ms. Madona
Kumar and Mrs. Renu Sharma were Masters students
under Professor Basak's supervision and participated in
the completion of the work and the preparation of the
manuscript. Ms. Bijoylaxmi Midya' a lecturer in the
Department of Applied Electronics & Instrumentation
Engineering, Haldia Institute of Technology, Haldia, is
doing Ph.D. work under Prof. Basak and contributed to
the completion of the paper.
Acknowledgements
The authors are grateful to the authorities of Jadavpur University and to
Prof. T. K. Ghoshal, ex-head of the Electrical Engineering Department. Pro-
fessor T. K. Basak is particularly indebted for inspiration received from his
late wife, Mala Basak who is in the heavenly abode of Shree Shree Ram-
akrishna Paramhansa.
References
1. Gliozzi A, Bruno S, Basak TK, Rosa MD, Gambacorta A: Organiza-
tion and Dynamics of Bipolar Lipids from Sulfobus Solfatari-
cus in Bulk Phases and in Monolayer Membranes. System Appl
Microbiol 1986, 7:266-27.
2. Basak TK, Aich NS: Photo induction on fish-anabas testu-
dineus,. Proceedings of IEEE EMBS International Conference 1990,
XII(4):1635-1636.
3. Basak TK: Entropy transduction on photoinduction,. Proceed-
ings of IEEE EMBS International Conference 1991, 13(4):1534-1535.
4. Basak TK: Catecholamine interaction in blood pressure trans-
duction,. conference on Medimechatronics, Malaga, Spain organized by
Bristol University UK 1992.
5. Basak TK, Islam R: Role of sensory hormones in estimation of
blood pressure transduction,. Proceedings of IEEE EMBS Interna-
tional Conference, 0-7803-1377 1993:1590-1591.
6. Basak TK, Dutta J: pH dependence of the interactions in blood
pressure transduction,. proceeding of IEEE EMBS International con-
ference, 0-7803-2050 1994:852-853.
7. Basak TK: pH dependent transduction in renal function regu-
lation,. proceeding of 18th Annual International conference of the IEEE
EMBS, no. 0-7803-3811 Amsterdam 1996:2227-2228.
8. Basak TK, Dutta JC, Ghosh SK: Some optical characteristics of
biomembrane in the development of biosensors,. International
society for optical engineering SPIE, USA 2001, 1407:.
9. Liew SP: Monitoring galvanic skin responses in functional
magnetic resonance imaging. In Ph D thesis Queensland Univer-
sity, Brisbane; 2001.
10. Tarvainen M, Koistinen A, Valkonen-Korhonen M, Partanen J, Kar-
jalainen P: Principal component analysis of galvanic skin
responses. IEEE Trans Biomed Eng in press.
11. Guyton , Hall : Textbook of Medical Physiology: Elsevier 2003.
12. Wintrobe , Thorn , Adams , Braunwald , Isselbacher , Petersdorf : Prin-
ciples of Internal Medicine McGraw-Hill Kogakusha Ltd; 1972.
13. Tian H, Habecker B, Guidry G, Gurtan A, Rios M, Roffler-Tarlov S,
Landis SC: Catecholamines Are Required for the Acquisition
of Secretory Responsiveness by Sweat Glands,. J Neurosci 2000,
20:7362-7369.
14. Krizsan-Agbas D, Zhang R, Marzban F, Smith PG: Presynaptic
adrenergic facilitation of parasympathetic neurotransmis-
sion in sympathectomized rat smooth muscle. J Physiol 1998,
512:841-849.