Effect of cellulose nanocrystals and gelatin in corn starch plasticized films
Bạn đang xem bản rút gọn của tài liệu. Xem và tải ngay bản đầy đủ của tài liệu tại đây (4.19 MB, 8 trang )
Carbohydrate Polymers 115 (2015) 215–222
Contents lists available at ScienceDirect
Carbohydrate Polymers
journal homepage: www.elsevier.com/locate/carbpol
Effect of cellulose nanocrystals and gelatin in corn starch plasticized
films
J.S. Alves a,∗ , K.C. dos Reis b , E.G.T. Menezes a , F.V. Pereira c , J. Pereira a
a
Departamento de Ciência dos Alimentos, Universidade Federal de Lavras, Caixa Postal 3037, CEP 37200-000 Lavras, MG, Brazil
Departamento de Ciências Exatas, Universidade Federal de Lavras, Caixa Postal 3037, CEP 37200-000 Lavras, MG, Brazil
Instituto de Ciência Exatas, Universidade Federal de Minas Gerais, Av. Antônio Carlos, 6627, Pampulha, Caixa Postal 702, CEP 31270-901 Belo Horizonte,
MG, Brazil
b
c
a r t i c l e
i n f o
Article history:
Received 22 April 2014
Received in revised form 19 July 2014
Accepted 13 August 2014
Available online 3 September 2014
Chemical compounds studied in this article:
Glycerol (PubChem CID: 753)
Sulfuric acid (PubChem CID: 1118)
Water (PubChem CID: 962)
Keywords:
Biopolymers
Nanobiocomposite
Mechanical properties
Packaging
Barrier properties
RCCD
a b s t r a c t
Cellulose at the nanoparticle scale has been studied as a reinforcement for biodegradable matrices
to improve film properties. The goal has been to investigate the properties of starch/gelatin/cellulose
nanocrystals (CNC) films. Eleven treatments were considered using RCCD (rotatable central composite design), in addition to four control treatments. For each assay, the following dependent variables
were measured: water vapor permeability (WVP), thickness, opacity and mechanical properties. The
microstructure and thermal properties of the films were also assessed. Increases in gelatin and CNC concentrations lead to increases in film thickness, strength and elongation at break. The films containing
only gelatin in their matrix displayed better results than the starch films, and the addition of CNC had a
positive effect on the assessed response variables. The films exhibited homogeneous and cohesive structures, indicating strong interactions between the filler and matrix. Films with low levels of gelatin and
CNC presented the maximum degradation temperature.
© 2014 Elsevier Ltd. All rights reserved.
1. Introduction
Starch is widely used in the form of biodegradable films in varied
applications because it is a renewable, abundant and inexpensive
material. According to (Fakhouri et al., 2007), films produced from
polysaccharides or proteins have excellent mechanical, optical and
sensory properties but are sensitive to humidity and have a high
water-vapor permeability coefficient. Nevertheless, this problem
can be mitigated by adding plasticizers (polyols, such as glycerol,
sorbitol and polyethylene glycol) or reinforcements.
Another edible and renewable raw material used in the production of biodegradable films is gelatin. Gelatin is a protein of animal
origin obtained from collagen through acid or alkaline hydrolysis
that is widely used in both food and pharmaceutical industries.
Abbreviations: CNWs, cellulose nanowhiskers; CNCs, cellulose nanocrystals.
∗ Corresponding author. Tel.: +55 35 38291660; fax: +55 35 38291401.
E-mail addresses: janyelle (J.S. Alves),
kelen (K.C. dos Reis),
(E.G.T. Menezes), (F.V. Pereira), fla.br (J. Pereira).
/>0144-8617/© 2014 Elsevier Ltd. All rights reserved.
Gelatin preparation may or may not involve alkaline pretreatment,
which converts asparagine and glutamine into their respective
acids, resulting in greater viscosity. The acid pretreatment (type
A gelatin) uses pig skin, whereas the alkaline pretreatment (type
B gelatin) uses cattle hides and bones. All types of gelatin have
similar composition, containing water, a small amount of minerals and pure connective tissue protein (Almeida & Santanta, 2010).
Gelatin is primarily used as gelling agent to create transparent,
elastic gels that are thermo-reversible under cooling below 35 ◦ C
(Teixeira, 2011). According to Bertan (2003), as cited by (Fakhoury
et al., 2012), gelatin-based bioplastics are resistant, transparent and
easy to handle.
One of the most promising technical advances in the material industry has been the development of nanobiocomposites,
namely, the dispersion of nanosized filler reinforcements into a
starch biopolymer matrix (Xie, Pollet, Hallet, & Averous, 2013).
Cellulose is the most abundant organic compound on earth and
is found in plant cell wall in association with hemicellulose
and lignine. From cellulose, the natural nano-reinforcements,
called cellulose nanowhiskers (CNWs) or cellulose nanocrystals
(CNCs) can be obtained using a controlled sulfuric acid hydrolysis,
216
J.S. Alves et al. / Carbohydrate Polymers 115 (2015) 215–222
Table 1
Experimental range and levels of independent variables.
Variables
Gelatin (g 100 g−1 )
CNCa (%)
a
Coded variables
X1
X2
Variables Levels
− 1.41
−1
0
+1
+ 1.41
6
0
7.16
0.44
10
1.5
12.84
2.56
14
3
CNC = cellulose nanocrystals.
producing highly crystalline rod-like nanostructures (Mesquita,
Donnici, & Pereira, 2010).
CNCs (cellulose nanocrystals) act as reinforcement in biodegradable polymers, interacting with the matrix mainly to favor
mechanical and barrier properties (Cao, Chen, Chang, Muir, & Falk,
2008; Cao, Chen, Chang, Stumborg, & Huneault, 2008; Kaushik,
Singh, & Verma, 2010; Lu, Weng, & Cao, 2006; Mathew, Thielemans,
& Dufresne, 2008; Svagan, Hedenqvist, & Berglund, 2009). This
change allows a broader range of usage for these materials, especially in the packaging industry. In the present experiment, a film
made from corn starch and glycerol and supplemented with gelatin
was developed to obtain a more cohesive matrix. CNCs were also
incorporated to this film to improve mechanical, thermal and barrier properties.
2. Materials and methods
2.1. Materials
Corn starch (Amidex® 3001) was supplied by Corn Products
Brazil S/A, glycerol was purchased from Vetec Quimica Fina Ltda.
(São Paulo, Brazil) and bovine gelatin, of 180 Bloom and 30 mesh,
was obtained from Gelita do Brazil Ltda. (São Paulo, Brazil).
2.2. CNC preparation
CNC was obtained according to Beck-Candanedo, Roman, and
Gray (2005) with modifications according to Mesquita et al. (2010).
Sulfuric acid hydrolysis of eucalyptus wood pulp was performed.
Briefly, the wood pulp was ground until a fine particulate was
obtained using a Willey mill. Then, 10.0 g of cellulose was added
to 80.0 mL of 64 wt% sulfuric acid under strong mechanical stirring.
Hydrolysis was performed at 50 ◦ C for approximately 50 min.
After hydrolysis, the dispersion was diluted twice in water, and
the suspensions were then washed using three repeated centrifuge
cycles. The last washing was conducted using dialysis against
deionized water until the dispersion reached pH 6.0. Afterward,
the dispersions were ultrasonicated with a Cole Parmer Sonifier
cell disruptor equipped with a microtip for 8 min and finally filtered
using a 20 mm pore size filter.
2.3. Film preparation
The films were prepared using a casting process, which
consisted of dehydrating a filmogenic solution applied on a support
(Henrique, Cereda, & Sarmento, 2008). The filmogenic solutions
were prepared from 3% corn starch, 20% glycerol and gelatin
solution and cellulose nanocrystals (CNC) according to the experimental range as shown in Table 1.
To improve the barrier properties of the films, in each of the
11 treatment trials (T1–T11) (Table 2), two suspensions were prepared, one with corn starch and the other with gelatin. Then these
two solutions were combined. The gelatin solution was prepared by
hydrating gelatin with distilled water for an hour, heating in a water
bath until complete solubilization and then adding glycerol from
solution. The solutions with CNC were prepared by addition of CNC
to glycerol at ambient temperature, and there was occurrence of
the birefringence phenomenon as observed through crossed polarizers. The solution (CNC and glycerol) was mixed with corn starch
and distilled water under stirring and heating until 75.0 ◦ C. The two
suspensions, corn starch and gelatin, were mixed to create a single suspension. The mixture was cooled to room temperature and
poured onto polystyrene plates, which were dried in a controlled
temperature chamber at 25 ◦ C at 50% RH in circulated air (chamber
model 435314, Hotpack, Philadelphia, USA). The dried films were
peeled off the casting surface and stored in polyethylene bags at
25 ± 1 ◦ C until evaluation.
2.4. Experimental design
Eleven treatments were prepared using a 22 rotatable central
composite design (RCCD), plus four control treatments, to evaluate
each single matrix (starch or gelatin) films and thus to separately
analyze the interaction between CNC and each matrix. The 11 treatments (T1 through T11) were designed as presented in Table 2,
consisting of two independent variables, 4 factorial points, 4 axial
points and 3 central points, in accordance with Rodrigues and
Iemma (2005).
The response-surface methodology was applied to assess the
effect that the gelatin and CNC concentrations (X1 and X2 , respectively) had on the barrier and mechanical properties of the thin
films produced here. For each assay in the experimental design,
the following dependent variables were measured: water vapor
permeability (WVP), thickness, opacity and mechanical properties (puncture force, tensile strength and elongation at break). The
results for the scanning electron microscopy (SEM), differential
scanning calorimetry (DSC) and thermo gravimetric data (TG) are
shown in figures and tables generated from the assay in question.
The experiments were conducted in random order, and the data
were analyzed using Statistica 8.0 (Software Inc., Tulsa, OK, USA). A
significance level of 10% was adopted in the standard error analysis.
The polynomial used to fit the model is given in Eq. (1).
y = ˇ0 + ˇ1 X1 + ˇ11 X1 2 + ˇ2 X2 + ˇ22 X2 2 + ˇ12 X1 X2 + ε
(1)
where ˇ0 , ˇ1 , ˇ11 , ˇ2 , ˇ22 , ˇ12 are the regression coefficients, X1
is the concentration of gelatin, X2 is the concentration of cellulose
nanocrystals, and ε is the standard error.
The
remaining
four
control
treatments,
namely
T12 (starch + glycerol), T13 (starch + glycerol + CNC), T14
(gelatin + glycerol) and T15 (gelatin + glycerol + CNC), were produced from a suspension containing starch, glycerol, gelatin, CNC
and distilled water using the concentrations defined in Table 2.
These four treatments were randomly produced and split into
two groups, namely T12 with T13 and T14 with T15. Standard
deviation was used to ascertain how close individual values were
to their mean. These four treatments served as controls for all the
others because the 11 treatments were prepared from the same
two-matrix (starch and gelatin) mixture.
2.5. Analyses of films
2.5.1. Water vapor permeability (WVP)
The WVP of the films was measured using a Permatran-W
device, model 1/50G (San Francisco, CA, USA), with an infrared
J.S. Alves et al. / Carbohydrate Polymers 115 (2015) 215–222
217
Table 2
Experimental design for corn starch/gelatin/CNC films treatment and observed data values of water vapor permeability (WVP), thickness measurements (TM), opacity (Op),
puncture force (PF), tensile strength (TS) and elongation at break (EB).
Treatment
1
2
3
4
5
6
7
8
9 (CP)
10 (CP)
11 (CP)
12
13
14
15
Corn starch
(g 100 g−1 )
3
3
3
3
3
3
3
3
3
3
3
3
3
0
0
Independent variables
Dependent variables
Gelatin
(g 100 g−1 )
CNC (%)
WVP (g
m/(m2
day KPa)
TM (mm)
Op
PF (N)
TS (MPa)
EB (%)
7.16 (−1)
12.84 (1)
7.16 (−1)
12.84 (1)
6 (−1.41)
14 (1.41)
10 (0)
10 (0)
10 (0)
10 (0)
10 (0)
0
0
10
10
0.44 (−1)
0.44 (−1)
2.56 (1)
2.56 (1)
1.5 (0)
1.5 (0)
0 (−1.41)
3 (1.41)
1.5 (0)
1.5 (0)
1.5 (0)
0
1.5
0
1.5
6.04
5.05
4.97
5.18
5.17
5.95
4.51
5.82
4.94 ± 0.66
4.58 ± 0.66
3.67 ± 0.66
4.51
4.63
7.49
4.56
0.09
0.09
0.11
0.09
0.09
0.08
0.11
0.08
0.07 ± 0.01
0.08 ± 0.01
0.07 ± 0.01
0.05 ± 0.01
0.04 ± 0.01
0.14 ± 0.03
0.13 ± 0.02
38.18
37.99
37.98
37.85
37.45
37.79
37.98
38.51
38.47 ± 0.17
38.33 ± 0.17
38.14 ± 0.17
39.50 ± 0.29
38.13 ± 1.09
37.68 ± 0.15
37.42 ± 0.34
27.22
27.04
23.36
42.50
28.31
41.90
32.64
50.29
30.28± 4.22
38.07 ± 4.22
39.97 ± 4.22
3.40 ± 2.16
2.79 ± 2.30
65.43 ± 15.19
69.39±23.18
41.58
46.82
42.93
38.29
48.17
29.30
40.75
49.09
42.30 ± 1.46
43.59 ± 1.46
45.21 ± 1.46
10.91 ± 6.32
13.21 ± 4.92
33.09 ± 5.45
32.28±2.18
8.41
11.10
7.50
15.61
6.98
10.00
7.74
7.56
8.81 ± 0.46
9.18 ± 0.46
8.27 ± 0.46
1.24 ± 0.44
1.99 ± 0.80
27.52 ± 12.10
38.25 ± 7.27
CNC = cellulose nanocrystals; CP = central point; WVP = water vapor permeability; TM = thickness measurements; Op = opacity; PF = puncture force; TS = tensile strength;
EB = elongation at break; T1 = 0.44% CNC = 9.1 mL CNC solution; T2 = 0.44% CNC = 14.2 mL CNC solution; T3 = 2.56% CNC = 52.98 mL CNC solution; T4 = 2.56% CNC = 82.46 mL
CNC solution; T5 = 1.5% CNC = 27.37 mL CNC solution; T6 = 1.5% CNC = 51.93 mL CNC solution; T7 = 0% CNC = 0 mL CNC solution; T8 = 3% CNC = 79.30 mL CNC solution;
T9 = T10 = T11 = 1.5% = 39.65 mL CNC solution.
sensor, according to the ATSM E398 standard test method (ASTM,
2003). The film sample was placed between two foil masks with an
internal area of 12.6 cm2 , and this unit was placed into the device’s
diffusion cell. The following parameters were used in the analysis: temperature of 37.8 ◦ C and controlled relative humidity of 50%
(permeant) and 10% (dry side).
2.5.2. Film thickness measurements
The film thickness was measured using a digital micrometer
(Instrutemp, São Paulo, Brazil) taking measurements at different
positions on the film. The results were expressed in mm.
2.5.3. Film opacity
The film opacity was determined with a color spectrometer
(Minolta, model CR 400, Japan), according to the Sobral (1999)
method in the reflectance mode. Opacity (Op) was calculated from
the relationship between the luminosity (parameter L*) of the film
superposed on the black standard (Opblack ) and that of the film
superposed on the white standard (Opwhite ) according to the following Eq. (2):
OP (%) =
Opblack
× 100.
Opwhite
(2)
2.5.4. Mechanical properties
The mechanical properties of the films were determined by two
tests using a texture analyzer TA.XT2i (Stable Micro System Ltd.,
Surrey, England) controlled by the Exponent Lite Express V.5.1.1.0
software. The size of the load cell was 30 kg.
The specimens for the tensile strength and elongation at break
analyses were cut in the shape of 80 mm × 20 mm strips, and those
for the puncture-force tests were cut into 30 mm × 30 mm squares.
The following parameters were used in the analysis for all the
thin films samples: pre-test speed of 0.8 mm s−1 , test speed of
0.8 mm s−1 , post-test speed of 10.00 mm s−1 . The probe used in the
tensile strength and elongation at break tests was an A/TG, with
50-mm distance between the grips.
In the puncture-force test, a film support and an SMS P/5S probe
(with initial distance of 15 mm) were used. The tensile strength
was calculated by dividing the maximum strength by the sectional
area of the film (film width × initial thickness). Elongation at break
was calculated by dividing the extension differential by the initial
distance between grips. Six specimens were used in each treatment.
2.5.5. Scanning electron microscopy (SEM)
Images were obtained according to the methodology proposed
by Bengtsson, Koch, and Gatenholm (2003), with some modifications, in which small film samples (−2 mm), in their cross
section, were fixed on “stubs” using double-sided adhesive tape and
sputter-coated with gold before observation to prevent charging
and observed using an applied voltage of 20.00 kV (sputter coater
FDU 010 – Balzers Union, from Liechtenstein). These samples were
later analyzed using a scanning electron microscope (LEO Electron
Microscopy Ltd., Cambridge, England).
2.5.6. Differential scanning calorimetry (DSC) and thermo
gravimetric data (TG)
The film properties were determined by DSC using an F3 200
DSC system (Netzsch, Germany). Approximately 3 mg of film sample were cut into small pieces and placed on a sample dish. The
reference was the empty dish. The thermo gravimetric data (TG)
for the various films was measured at a heating rate of 10 ◦ C min−1
from 30 ◦ C to 300 ◦ C.
3. Results and discussion
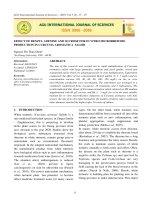
The suspensions (T1–T11, T13 and T15) were analyzed under
two crossed polarizers, and the birefringence phenomenon was
observed (Fig. 1).
According to Mesquita et al. (2010), flow birefringence in
whisker suspensions results from the alignment of nanoparticles
and indicates the presence of isolated CNC in the dispersion.
Table 2 shows the real and coded values for the independent
variables along with the results for the dependent variables (water
vapor permeability, thickness, opacity, puncture strength, tensile
strength and elongation at break) for the films obtained. The values
for the four control treatments (T12 through T15) were obtained as
the mean of six observations (Table 2).
218
J.S. Alves et al. / Carbohydrate Polymers 115 (2015) 215–222
Table 3
Results of analysis of variance (ANOVA) for water vapor permeability (WVP), thickness measurements (TM), opacity (Op), puncture force (PF), tensile strength (TS) and
elongation at break (EB).
ˇ0
ˇ1
ˇ11
ˇ2
ˇ22
ˇ12
R2
Fc
Ft
p
WVP (g m/(m2 day KPa)
TM (mm)
Cf
Cf
4.372
−0.050
0.496
0.115
0.412
0.300
0.58
1.41
3.45
<0.10
pV
0.000
0.828
0.073
0.631
0.189
0.388
0.083
0.011
0.005
0.007
0.002
0.007
0.81
4.40
3.45
<0.10
Op
pV
0.000
0.023
0.207
0.099
0.591
0.235
Cf
38.283
0.072
−0.252
0.051
−0.023
0.015
0.61
1.57
3.45
<0.10
PF (N)
pV
0.000
0.480
0.046
0.621
0.850
0.917
Cf
32.117
4.266
0.218
5.607
3.220
5.373
0.80
4.11
3.45
<0.10
TS (MPa)
pV
Cf
0.000
0.069
0.911
0.032
0.218
0.101
44.262
−2.770
−2.287
0.577
0.362
−2.470
0.62
1.62
3.45
<0.10
EB (%)
pV
0.000
0.152
0.224
0.746
0.866
0.348
Cf
7.786
1.191
0.806
0.541
0.786
0.415
0.72
2.62
3.45
<0.10
pV
0.000
0.060
0.165
0.335
0.255
0.588
WVP = water vapor permeability; TM = thickness measurements; Op = opacity; PF = puncture force; TS = tensile strength; EB = elongation at break; Cf = coefficient; pV = p value;
ˇ0 = constant, ˇ1 = gelatin (linear); ˇ11 = gelatin (quadratic), ˇ2 = cellulose nanocrystals (linear); ˇ22 = cellulose nanocrystals (quadratic); ˇ12 = interaction between gelatin and
cellulose nanocrystals, R2 = coefficient of determination; Fc = F calculated, Ft = F tabulated, p = significant at 10% probability.
3.1. Water vapor permeability (WVP)
Statistical analysis of the water vapor permeability results for
treatments 1 through 11, at the 10% significance level, indicated
that only the quadratic term of the variable for gelatin concentration was significant, and it had a positive effect. This result indicates
that an increase in gelatin concentration led to a minimum point for
the response variable, i.e., the smallest results for the water vaporpermeability variable comprise an intermediate value that relates
mainly to the central points (Table 3). In starch and gelatin films,
lower permeability is more interesting because less gas diffusion
through the polymeric material is desirable.
In the central region (10% gelatin and 1.5% CNC), encompassing the central points, treatments 9, 10 and 11 correspond to the
desired WVP values, i.e., the smallest ones (Table 2). The decrease in
water vapor permeability in these structures with nanometric particles is justified by the fact that, when such particles are perfectly
dispersed in the polymeric matrix, they create a kind of labyrinth,
hindering the diffusion of water vapor through the matrix (García,
Ribba, Dufresne, Aranguren, & Goyanes, 2009; Ma, Jian, Chang, &
Yu, 2008).
The WVP values for the control films (starch matrix – treatments
T12 and T13) were close to one another. For the gelatin films (T14
and T15), the film into which CNC was incorporated (T15) displayed
a lower value, which indicated a perfect dispersion of CNC in the
gelatin matrix. The reduction in permeability is strongly related to
a reduction in the diffusion coefficient imposed by the presence of
the fibers (Kaushik et al., 2010).
Fig. 1. Birefringence phenomenon observed between two crossed polarizers after
dispersion of whiskers or cellulose nanocrystals in glycerol.
The WVP values obtained in the present work are lower than
those found by Ghasemlou et al. (2013), who found results close to
8 g mm m−2 d−1 KPa−1 for corn starch films. The values found here
are same the found for composite films based on native starches
(wheat, sorghum, potato and rice) and gelatin by (Fakhouri et al.,
2007) values between 4.22 and 5.53 g mm m−2 d−1 KPa−1 .
3.2. Film thickness measurements
Table 3 lists the coefficients for the independent variables
regarding the thickness of the thin films (T1 through T11). The linear terms for gelatin and CNC concentrations were significant at a
10% probability level, both being positive; i.e., an increase in the
values of these variables leads to an increase in the film thickness.
This behavior was expected because the gels became visually more
viscous.
Given that the percentages of explained variance for thickness
(R2 ) were high, and the calculated F values are higher than the tabulated F, it can be concluded that the experimental data fit well to
the proposed statistical model.
Eq. (3) represents the mathematical model for film thickness,
where X1 represents the gelatin concentration, and X2 represents
the CNC concentration.
Thickness (mm) = 0.083 + 0.011 + X1 + 0.05X1 2 + 0.07X2
+ 0.02X2 2 + 0.06X1 X2
(3)
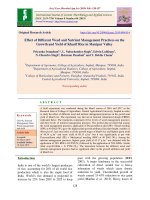
The analysis in Fig. 2A revealed that the lowest value for the
thickness variable was reached with close to the lowest values
for the gelatin concentration and intermediate levels of CNC. The
films with higher thickness values (T3 and T7) displayed low values for the water vapor permeability variable (Table 2). According
to Henrique et al. (2008), thickness influences film properties and,
when controlled, allows for material uniformity and validity among
comparisons.
The gelatin films (T14 and T15) displayed higher thickness values than the starch films (T12 and T13) (Table 2). The gelatin films
were more viscous than the starch films, most likely because the
gelatin concentration (10%) used was higher than in the starch films
(3%). Moreover, gelatin consists mainly of protein, which may lead
to higher viscosity and consequently greater thickness.
Other authors who have worked with corn starch films found
thickness values of approximately 0.15 mm (Ghasemlou et al.,
2013). (Fakhouri et al., 2007) assessed the thickness of composite films made with native starches from wheat, sorghum,
potato, rice and gelatin and found results between 0.053 mm
and 0.063 mm, which are lower than those found in the present
J.S. Alves et al. / Carbohydrate Polymers 115 (2015) 215–222
219
The opacity is highly influenced by the crystalline content of a
sample: more compact polymer chains make it more difficult for
light pass through and increase the opacity of films (Matsuguma
et al., 2009 cited by Fakhouri et al., 2013). Comparison of the results
for control films T12, T13, T14 and T15 reveals that the lowest values
were found in gelatin films and, among them (T12, T13) (T14, T15),
the films with CNC displayed lower values. This fact may be an
indication that nanoparticles were homogeneously distributed in
the matrix because they are white, and light incident on the film
surface is reflected in larger quantity due to the white particles.
Chen, Liu, Chang, Cao, and Anderson (2009) report that
nanocomposite films display higher transparency than pure-starch
films due to the nanometer size, the homogeneous dispersion
and the strong interaction between nanowhiskers and the starch
matrix.
3.4. Mechanical properties
According to Table 3, the linear terms gelatin concentration
and CNC were significantly (p < 0.10) and positively correlated. This
result indicates that increasing gelatin concentration and CNC (%)
drive an increase in the puncture force. This behavior is desirable
because a greater required puncture force indicates greater film
resistance, and resistant film is better suited for applications in the
packaging and coating industries.
The percentage of explained variance for the puncture force was
high (80%), and because the values for Fcalc (4.11) are higher than
Ftab (3.45), the model appears to fit well to the experimental data.
Eq. (4) represents the mathematical model for the puncture
force of the films, where X1 represents the gelatin concentration,
and X2 represents the CNC concentration.
Puncture force (N) = 32.117 + 4.266X1 + 0.218X1 2 + 5.607X2
+ 3.220X2 2 + 5.373X1 X2 .
Fig. 2. Response-surface plots showing the effect of the interaction between independent variables for the (A) thickness variable (mm) and (B) puncture force variable
(N) with CNC (%) versus gelatin (g 100 g−1 ).
study. Maran, Sivakumar, Sridhar, and Thirugnanasambandham
(2013) assessed cassava starch-based edible films and found values
between 0.027 mm and 0.046 mm for film thickness.
3.3. Film opacity
Only the quadratic term for gelatin concentration was significant at a 10% probability level, displaying a negative value (Table 3).
The increase in gelatin concentration led to an increase in opacity
until maximum values were reached. Table 2 for factorial design
indicates that the highest opacity values were obtained in the treatments with intermediate values of gelatin concentration in the film
compositions (T8, T9, T10 and T11). Because the opacity is inversely
proportional to the transparency, the treatments suggested in this
study would be those displaying the lowest opacity values, namely
treatments 5 and 6. According to Chen, Kuo, and Lai (2010) the
transparency of films is relatively important when films will be
used for food packaging or food coating because this factor directly
influences consumer acceptability.
(4)
Based on the proposed model, a response surface was generated.
The best results for the puncture force are obtained with treatments
that had the highest gelatin and CNC concentration values (Fig. 2B),
which according to the factorial design in Table 2 are treatments 4,
6 and 8.
For the control films, higher puncture force was observed in
gelatin films (T14 and T15) than in starch films (T12 and T13). Analysis of the gelatin films separately showed that the addition of CNC
increased the required puncture force.
These results are in agreement with the WVP analysis, in which
the same behavior was observed because these films exhibited
lower permeability. This behavior can be an indication that the
CNC dispersion was more homogenous in the gelatin matrix. A high
level of nanofiller addition can adversely affect the film properties
because of aggregation (Chen, Liu, Chang, Anderson, & Huneault,
2009).
In general, the results for puncture force of starch/gelatin films
found in this work (Table 2) were higher than those found in
the experiment by Aguilar-Méndez, Martín-Martínez, Tomás, CruzOrea, and Jaime-Fonseca (2008) (11.3 N–32.6 N), in which the
physicochemical properties of starch/gelatin films were assessed.
Table 3 shows that no term was significant at a 10% probability
level for the tensile strength variable. For this type of film, higher
tensile strengths are better because this property is related to the
ultimate tensile strength, i.e., the maximum stress that the film can
withstand without becoming deformed.
According to Table 2, the best values for tensile strength were
found in treatments 5 and 8.
For the control films, the gelatin films T14 and T15 had greater
tensile strength than the starch films T12 and T13.
220
J.S. Alves et al. / Carbohydrate Polymers 115 (2015) 215–222
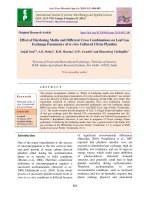
Fig. 3. Cross-section micrographs of thin films observed by SEM, where (A) treatment 1, (B) treatment 2, (C) treatment 3, (D) treatment 4, (E) treatment 5, (F) treatment 6,
(G) treatment 7, (H) treatment 8, (I) treatment 9.
Fakhouri et al. (2007) found values between 56.24 MPa and
104.62 MPa for composite films based on native starches (wheat,
sorghum, potato and rice) and gelatin, which higher than the values
found in the present study.
Table 3 shows that only the linear term of gelatin concentration
was significant at a 10% probability level, and its effect was positive. This pattern means that the addition of gelatin to treatments
increased their elongation at the breaking point, and higher values of this variable are better for application of these films for food
coating and packaging.
Although the CNC concentration variable was not significant,
treatment 4 displayed the highest result for elongation at break
(Table 2). This treatment had higher concentrations of gelatin and
CNC than the control treatments.
Regarding the control films, the gelatin T14 and T15 displayed
higher values for elongation at break than the starch films T12 and
T13. Remembering that all films have the same amount of glycerol
plasticizer, the comparison between the starch film (comparing
T12 with T13 treatments) and gelatin films (comparing T14 with
T15 treatments), showed that the incorporation of CNC increased
the elongation at break values. This result of increase in the elongation at break is somewhat unexpected, but other authors have
also found similar results for PLA/CNCs nanocomposites plasticized
with PEG (Oksman, Mathew, Bondeson, & Kvien, 2006) and for
starch/CNCs plasticized with sorbitol (Kvien, Sugiyama, Votrubec,
& Oksman, 2007). Oksman et al. (2006) found a clear positive effect
on the elongation at break of the nanocomposites with the addition of CNCs with PEG. The composites PLA/CNCs/PEG presented
a considerable increase in the elongation at break compared with
the system without CNCs (PLA/PEG). This somewhat unexpected
result was explained through a combination of nano-sized CNCs
dispersed together with a plasticizer (PEG). Since the CNCs present
a polar and high surface area that can interact strongly with a polar
plasticizer (such as PEG or glycerol), the authors stated that PEG
interacts strongly with the CNCs, covers them and improve the dispersion of the nanoparticles. Additionally, the plasticizer can be
more dispersed in the presence of the cellulose nanoparticles. We
believe that this effect can be the reason for the increase in the
elongation at break observed with the addition of the CNCs in a
combination with the plasticizer in our case.
3.5. Scanning electron microscopy (SEM)
Fig. 3 shows cross section photomicrographs of the thin films
made with corn starch, glycerol, gelatin and CNC at 500× magnification. The films were frozen in liquid nitrogen and broken into
small pieces.
In general, the thin films have a homogenous appearance, i.e.,
uniform interactions between the filler (CNC) and matrix (starch or
gelatin).
The corn-starch/gelatin thin films were less compact at lower
gelatin and/or CNC concentrations compared to the films with
intermediate to high gelatin and/or CNC concentrations (Fig. 3F–I
– central point). The latter films displayed a more compact texture.
However, Fig. 3I stands out from the rest. According to Henrique
et al. (2008), that work with casting films, the presence of pores
J.S. Alves et al. / Carbohydrate Polymers 115 (2015) 215–222
221
Fig. 4. Cross-section micrographs of thin films – control, observed by SEM, where (A) treatment 12, (B) treatment 13, (C) treatment 14, (D) treatment 15.
may influence permeability, and, as mentioned above and in agreement with the WVP results for the intermediate concentrations
(10% gelatin and 1.5% CNC; treatments 9, 10 and 11), the lowest
values were found at the central points, exactly where the desired
values for WVP were. This result confirmed that the structure was
more compact.
It is important to mention that the treatment 4 (Fig. 3D) exhibited small empty spaces inside the formed matrix due to the process
by which the film was produced (i.e. mixing of the suspension at
high rotation, favoring the formation of air micro bubbles). For
this reason, even though that apparently the presence of these
micro bubbles did not provide a significant effect on the WVP and
mechanical properties for this treatment (compared to the other
films), it is difficult to affirm that the behavior observed for this
film is undoubtedly from the formulation.
The photomicrographs of the gelatin control films (Fig. 4C and
D) reveal that these films had a more compact appearance and
greater thickness than the corn-starch control films (Fig. 4A and
B). This difference can be confirmed by the results of the thickness analysis conducted in this work (Table 2). This more compact
appearance and greater thickness resulted in films that were more
resistant (higher values for puncture force and tensile strength)
as shown in the results for the tested mechanical properties
(Table 2).
3.6. Differential scanning calorimetry (DSC) and thermo
gravimetric data (TG)
Based on Differential scanning calorimetry (DSC), the gelatin
and nanofiber addition altered the melting (gelatinization) peak
Table 4
Peak temperatures of melting (Tp ), the onset of melting point (To ) and the conclusion temperatures of the same transition (Tc ) obtained from DSC and Thermo Gravimetric
(TG) data of the films, showing the onset (T0 ) and maximum degradation (Tmax ) temperatures of the samples.
Treatment
DSC
◦
1
2
3
4
5
6
7
8
9
10
11
12
13
14
15
TG
◦
◦
Tp ( C)
To ( C)
Tc ( C)
T0 (◦ C)
Tmax (◦ C)
95.41
56.39
78.85
91.36
76.78
72.05
73.11
104.40
61.60
84.61
88.56
56.18
55.95
97.13
170.18
46.69
51.93
49.39
51.03
51.16
51.19
51.98
50.17
45.43
48.73
41.75
45.16
50.82
46.90
51.62
147.16
115.38
146.27
152.10
182.94
155.61
138.88
178.57
118.48
152.10
158.00
121.26
132.66
135.10
176.05
286.68
262.24
284.50
275.36
291.77
–
264.18
269.36
304.13
263.36
276.06
–
288.10
254.28
248.34
298.47
296.73
296.58
296.97
296.88
–
296.39
296.90
296.84
296.79
296.83
–
297.28
296.66
296.78
DSC (Differential scanning calorimetry) – transition temperatures; Tp = peak temperatures of melting; To = onset of melting point; Tc = conclusion temperatures of melting;
TG = thermo gravimetric data of films; T0 = onset degradation temperatures; Tmax = maximum degradation temperatures.
222
J.S. Alves et al. / Carbohydrate Polymers 115 (2015) 215–222
temperature (Tp ), the onset of melting (To ) and the endset (Tc ) of
the same transition (Table 4).
The films prepared with starch alone or only with the addition
CNCs in the starch matrix (treatments 12 and 13) presented the
lowest values of Tp (gelatinization temperatures of starch) around
56 ◦ C. The addition of gelatin altered significantly the Tp values,
but not significantly the onset temperature of melting point for all
treatments.
The thermal stability of the materials was investigated by thermogravimetric analysis, and the effect of the gelatin and CNC
concentration on the thermal properties of the starch films was
also studied. The temperature corresponding to the maximum rate
of weight loss (Tmax ) and the onset temperature (T0 ) of the films
are presented in Table 4.
The films with low contents of gelatin and of CNC presented the
maximum degradation temperature (298.47 ◦ C). According some
authors (Chen, Liu, Chang, Anderson, et al., 2009; Chen, Liu, Chang,
Cao, et al., 2009; Kaushik et al., 2010), adding CNWs to a starch
matrix may reduce the thermal stability.
4. Conclusion
Based on the experimental design employed in this work
(RCCD), in general, the independent variable gelatin interfered in
the analyzed film properties by increasing the values found. For the
response variable of water vapor permeability, the intermediate
gelatin concentration led to the lowest value. For the thickness, puncture force and elongation at break variables, increasing
the gelatin and CNC concentrations increased the values found.
Regarding the control films, the films containing a gelatin-only
matrix displayed better results than starch matrices for opacity
and mechanical properties. Moreover, comparisons between the
films of a given matrix regarding the addition of CNC showed that
CNC had a positive effect on the response variables measured. The
mechanical properties of the studied films enhanced significantly
with the concentration of gelatin and CNCs within the corn starch
films. The films with low contents of gelatin and of CNC presented
the maximum degradation temperature.
Acknowledgments
The authors thank the Brazilian Federal Agency for Support and Evaluation of Graduate Education (Coordenac¸ão de
Aperfeic¸oamento de Pessoal de Nível Superior – CAPES), the
National Counsel of Technological and Scientific Development
(Conselho Nacional de Desenvolvimento Científico e Tecnológico
– CNPq) and the Minas Gerais Research Foundation (Fundac¸ão de
Amparo à Pesquisa do estado de Minas Gerais – FAPEMIG) for their
financial support.
References
Aguilar-Méndez, M. A., Martín-Martínez, E. S., Tomás, S. A., Cruz-Orea, A., & JaimeFonseca, M. R. (2008). Gelatine–starch films: Physicochemical properties and
their application in extending the post-harvest shelf life of avocado (Persea
americana). Journal of the Science of Food and Agriculture, 88, 185–193.
Almeida, P. F. D, & Santanta, J. C. C. (2010). Avaliac¸ão da qualidade de uma
gelatina obtida a partir de tarsos de frango. In XXX Encontro Nacional de
Engenharia de Produc¸ão (XXX National Meeting of Production Engineering)
São Carlos,. Available at: />TN STP 114 750 15403.pdf Accessed 6.02.14
ASTM. (2003). Designation E 398 – 03: Standard test method for water vapor transmission rate of sheet materials using dynamic Relative humidity measurement.
In Annual book of ASTM standards. Philadelphia: American Society for Testing
and Materials.
Beck-Candanedo, S., Roman, M., & Gray, D. G. (2005). Effect of reaction conditions
on the properties and behavior of Wood cellulose nanocrystal suspensions.
Biomacromolecules, 6, 1048–1054.
Bengtsson, M., Koch, K., & Gatenholm, P. (2003). Surface octanoylation of highamylose potato starch films. Carbohydrate Polymers, 54, 1–11.
Cao, X., Chen, Y., Chang, P. R., Muir, A. D., & Falk, G. (2008). Starch-based nanocomposites reinforced with flax cellulose nanocrystals. Express Polymer Letters, 2,
502–510.
Cao, X., Chen, Y., Chang, P. R., Stumborg, M., & Huneault, M. A. (2008). Green composites reinforced with hemp nanocrystals in plasticized starch. Journal of Applied
Polymer Science, 109, 3804–3810.
Chen, Y., Liu, C., Chang, P. R., Anderson, D. P., & Huneault, M. A. (2009). Pea
starch-based composite films with pea hull fibers and pea hull fiber-derived
nanowhiskers. Polymer Engineering & Science, 49, 369–378.
Chen, Y., Liu, C., Chang, P. R., Cao, X., & Anderson, D. P. (2009). Bionanocomposites
based on pea starch and cellulose nanowhiskers hydrolyzed from pea hull fibre:
Effect of hydrolysis time. Carbohydrate Polymers, 76, 607–615.
Chen, C. H., Kuo, W. S., & Lai, L. S. (2010). Water barrier and physical properties of
starch/decolorized Hsian-tsao leaf gum films: Impact of surfactant lamination.
Food Hydrocolloids, 24, 200–207.
Fakhouri, F. M., Fontes, L. C. B., Gonc¸alves, P. V., de, M., Milanez, C. R., Steel, C. J., et al.
(2007). Films and edible coatings based on native starches and gelatin in the
conservation and sensory acceptance of crimson grapes. Ciência e Tecnologia de
Alimentos, 27, 369–375.
Fakhouri, F. M., Costa, D., Yamashitaa, F., Martelli, S. M., Jesus, R. C., Alganer, K.,
et al. (2013). Comparative study of processing methods for starch/gelatin films.
Carbohydrate Polymers, 95, 681–689.
Fakhoury, F. M., Martelli, S. M., Bertan, L. C., Yamashita, F., Innocentini Mei, L. H., &
Collares Queiroz, L. H. (2012). Edible films made from blends of manioc starch
and gelatin – influence of different types of plasticizer and different levels of
macromolecules on their properties. LWT – Food Science and Technology, 49,
149–154.
García, N. L., Ribba, L., Dufresne, A., Aranguren, M. I., & Goyanes, S. (2009). Physicomechanical properties of biodegradable starch nanocomposites. Macromolecular
Materials and Engineering, 294, 169–177.
Ghasemlou, M., Aliheidari, N., Fahmi, R., Shojaee-Aliabadi, S., Varz, B. K., Cran, M.
J., et al. (2013). Physical, mechanical and barrier properties of corn starch films
incorporated with plant essential oils. Carbohydrate Polymers, 98, 1117–1126.
Henrique, C. M., Cereda, M. P., & Sarmento, S. B. S. (2008). Características físicas de
filmes biodegradáveis produzidos a partir de amidos modificados de mandioca
[Physical characteristics of cassava modified starch films]. Ciência e Tecnologia
de Alimentos, 28, 231–240.
Kaushik, A., Singh, M., & Verma, G. (2010). Green nanocomposites based on thermoplastic starch and steam exploded cellulose nanofibrils from wheat straw.
Carbohydrate Polymers, 82, 337–345.
Kvien, I., Sugiyama, J., Votrubec, M., & Oksman, K. (2007). Characterization of starch
based nanocomposites. Journal of Materials Science, 42, 8163–8171.
Lu, Y., Weng, L., & Cao, X. (2006). Morphological, thermal and mechanical properties
of ramie crystallites – reinforced plasticized starch biocomposites. Carbohydrate
Polymers, 63, 198–204.
Ma, X., Jian, R., Chang, P. R., & Yu, J. (2008). Fabrication and characterization of citric
acid-modified starch nanoparticles/plasticized-starch composites. Biomacromolecules, 9, 3314–3320.
Maran, J. P., Sivakumar, V., Sridhar, R., & Thirugnanasambandham, K. (2013). Development of model for barrier and optical properties of tapioca starch based edible
films. Carbohydrate Polymers, 92, 1335–1347.
Mathew, A. P., Thielemans, W., & Dufresne, A. (2008). Mechanical properties of
nanocomposites from sorbitol plasticized starch and tunicin whiskers. Journal
of Applied Polymer Science, 109, 4065–4074.
Mesquita, J. P. D., Donnici, C. L., & Pereira, F. V. (2010). Biobased nanocomposites from
layer-by-layer assembly of cellulose nanowhiskers with chitosan. Biomacromolecules, 11, 473–480.
Oksman, K., Mathew, A. P., Bondeson, D., & Kvien, I. (2006). Manufacturing process
of cellulose whiskers/polylactic acid nanocomposites. Composites Science and
Technology, 66, 2776–2784.
Rodrigues, M. I., & Iemma, A. F. (2005). (Experimental design and process optimization:
A sequential design strategy) Planejamento de experimentos e otimizac¸ão de processos: uma estratégia seqüencial de planejamentos (1st ed.). Campinas, SP: Casa
do Pão Editora.
Sobral, P. J. A. (1999). Propriedades funcionais de biofilmes de gelatina em func¸ão da
espessura [Functional properties of gelatin biofilms as a function of thickness].
Ciência e Engenharia, 8, 60–67.
Svagan, A. J., Hedenqvist, M. S., & Berglund, L. (2009). Reduced water vapour sorption in cellulose nanocomposites with starch matrix. Composites Science and
Technology, 69, 500–506.
Teixeira, A. M. (2011). (Nanocomposites of montmorillonite clay, thermoplastic starch,
gelatin, soy protein isolate and chitosan) Nanocompósitos de argila montmorilonita,
amido, gelatina, isolado protéico de Soja e quitosana (Ph.D. thesis). Campinas, SP:
Universidade Estadual de Campinas.
Xie, F., Pollet, E., Halley, P. J., & Averous, L. (2013). Review: Starch-based nanobiocomposites. Progress in Polymer Science, 38, 1590–1628.